Not long ago, it was common for marketers and web analysts to spend the bulk of their day staring at Excel spreadsheets, manually collecting and organizing ad spend data across dozens of sources.
You had to go to each advertising account and export statistics on advertising campaigns, such as ad impressions, clicks, and costs, then export data from the web analytics system, and, finally, combine all the data manually.
Not an optimal use of time.
As it turns out, however, Google Analytics allows you to analyze the performance not only of Google Ads but also other advertising sources, such as Facebook, Bing, Twitter, Pinterest, LinkedIn, and more—in a single dashboard.
In this article, I explain how to import costs from all advertising platforms into Google Analytics and how to set up performance metrics such as ROAS, Cost of Sale, and more.
Table of contents
1. Create a Data Set in Google Analytics.
First, create a Data Set to load with advertising cost data.
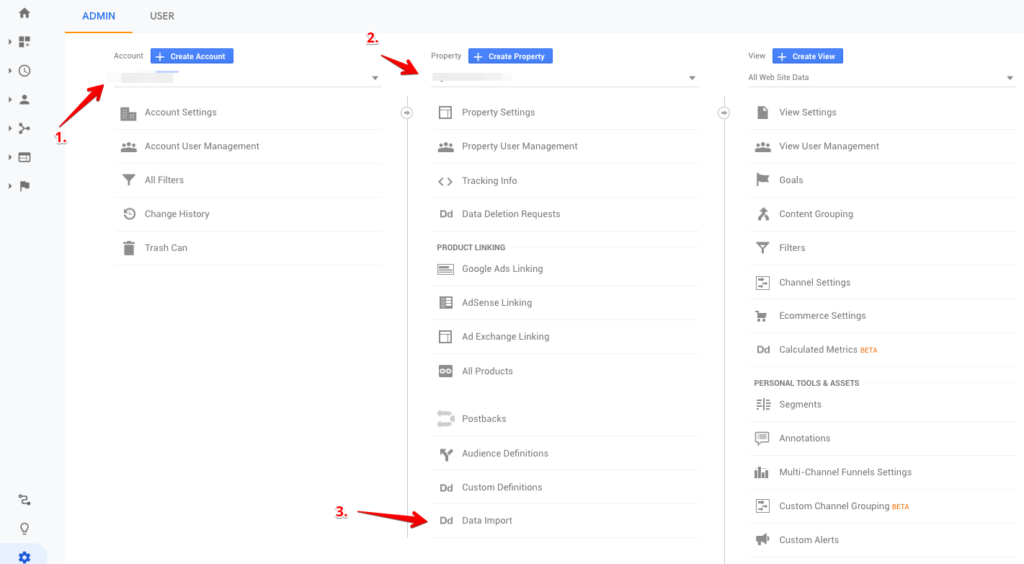
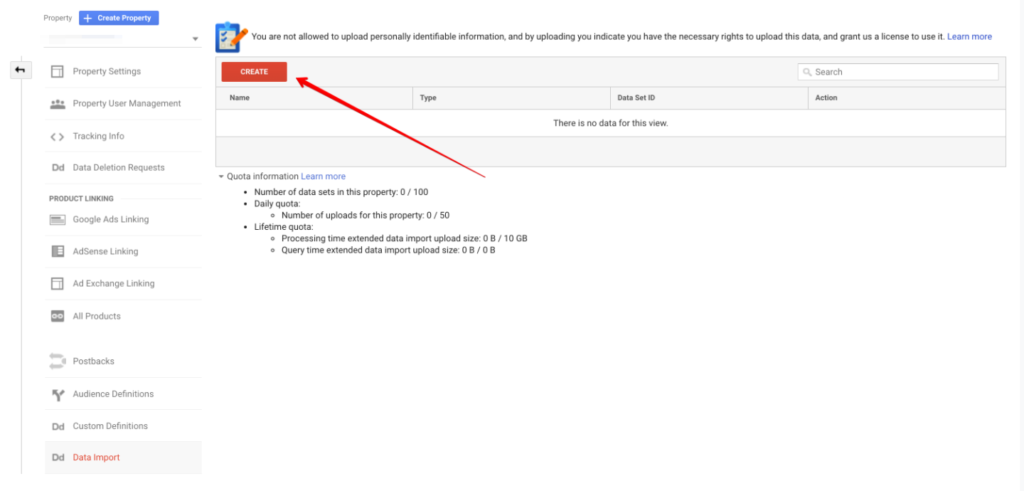
Go to the Google Analytics “Admin” section, select your account, and choose the “Property” into which you want to import data. Then select “Data Import.”
Next, click “Create” to create a new Data Set.
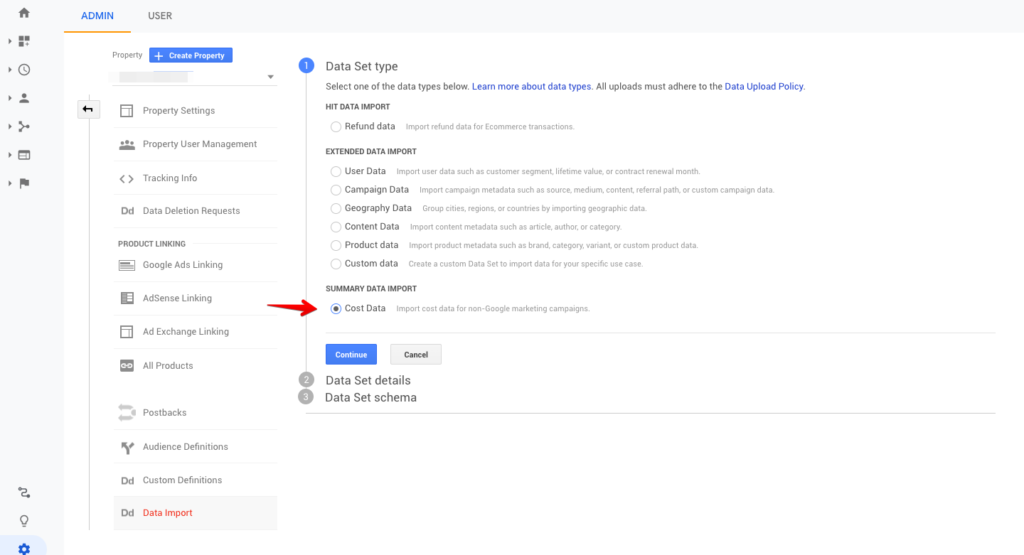
When choosing “Data Set type” select “Cost Data” and click on the “Continue” button:
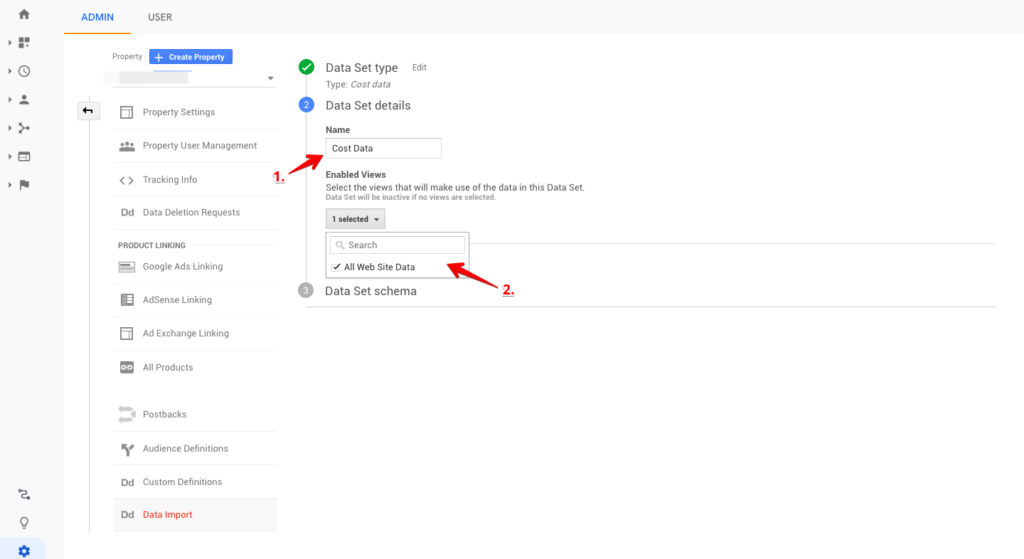
Enter a name for your Data Set and select the required “Enabled Views.” Ad cost data will be available only for selected “Views.”
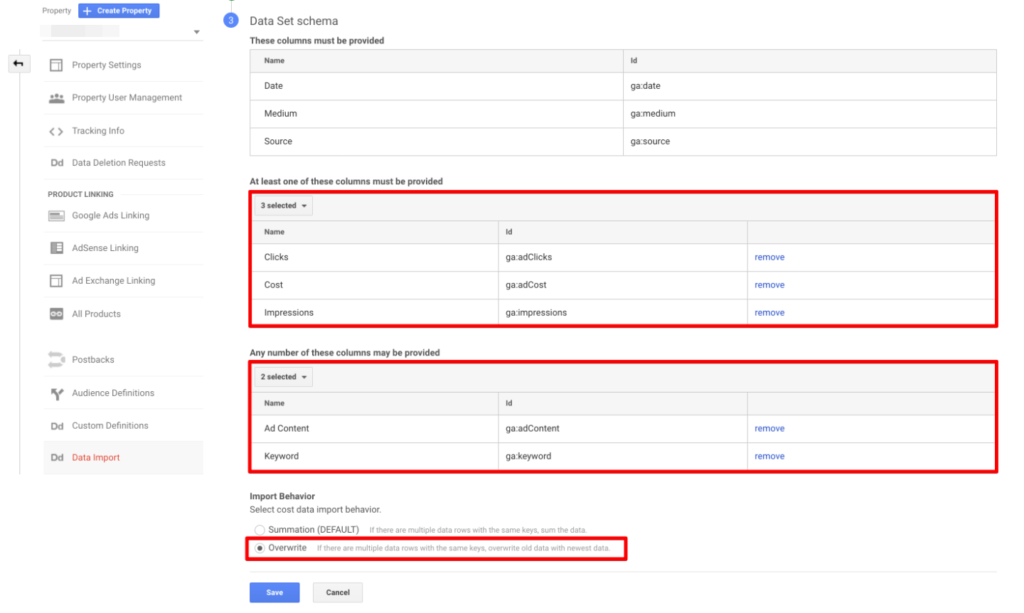
Next, in the settings, select the dimensions and metrics as shown in the screenshot. Set “Import Behavior” as “Overwrite,” and click on the “Save” button.
Done! You have created a Data Set, which can now be loaded with ad cost data from your chosen advertising platform.
What’s next?
2. Prepare a file with advertising costs.
To upload ad cost data, you first need to prepare a CSV file with a specific structure. To do this, create a new Google Sheets or Excel file with the following columns:
Access a Notion document (image below) with detailed column descriptions here.
Now, you can add data from all your advertising platforms to this file, such as Facebook, Bing, LinkedIn, Twitter Ads, and others.
In the same way, if you know the values, you can add the costs of email marketing, SEO, and other marketing activities.
Once you’ve added your desired data, export the file to a CSV.
3. Import the file into the created Data Set.
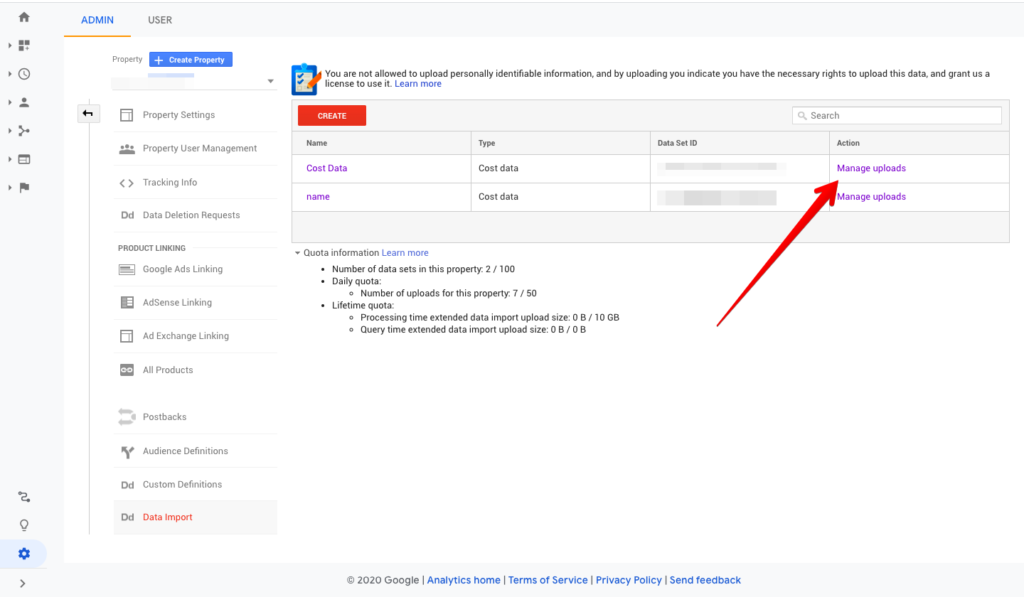
Go to the Admin > Property > Data Import section again, and click on “Manage uploads” in the row with the Data Set you just created.
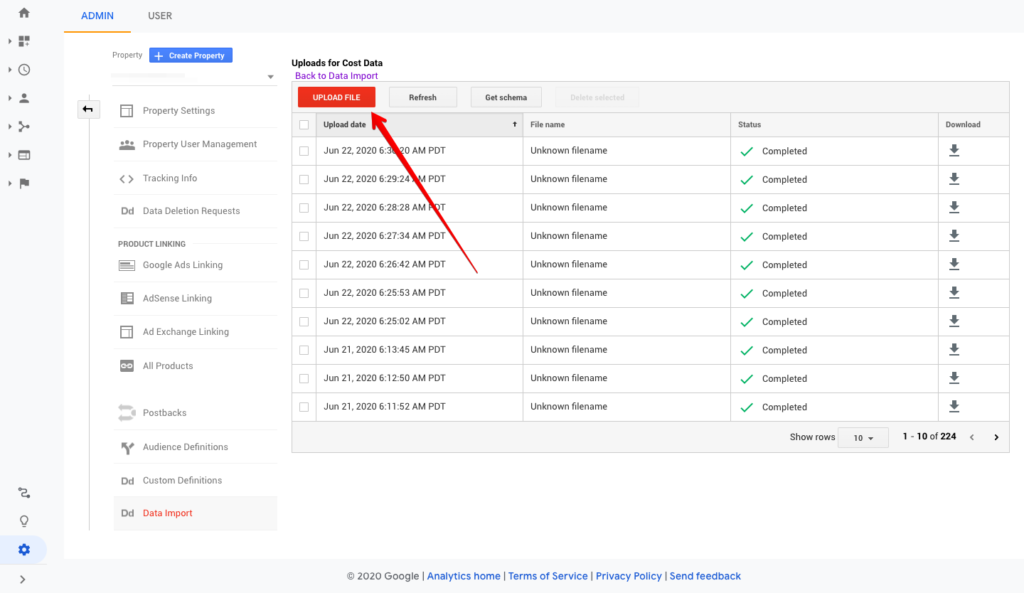
Click on the “Upload file” button and select the CSV file you prepared for import.
Your ad cost data has been loaded. You can now start creating reports and analyzing ad performance across your marketing channels.
Is it possible to automate the import process?
Yes. There are several popular tools on the market that can automate the process of importing ad cost data on a daily basis.
Thanks to such tools, you don’t need to go into each advertising account and manually export ad cost data for the selected period, then prepare a CSV file in the format required for import into Google Analytics.
You simply connect your Google Analytics account, select the ad platforms you use, and the system automatically imports your ad cost data on a daily basis.
Examples of such tools (ours included):
What should you consider if choosing an automation tool?
- What level of detail do you want? Some tools allow you to import costs only up to the Source/Medium and Campaign level; others give you the ability to analyze at the Content and Term level, too.
- Is the current UTM markup supported? Many tools import cost data only if ad campaigns have been tagged in a certain way. Make sure the tool you choose can use your current UTM markup so that you don’t have to re-configure the UTM tags for your campaigns.
- Is parsing of dynamic URL parameters supported? Most advertising platforms allow you to pass dynamic parameters in the URL that the user follows to the site (e.g., the location of a banner on the page, the region, etc.). If you want to analyze the effectiveness of advertising campaigns based on dynamic parameters, make sure the tool supports it.
- Is there an automatic currency conversion? If you buy ads in one currency (e.g., U.S. dollars) but your view in Google Analytics is configured in a different currency (e.g., Euros), then the reported data may be incorrect. Some tools have daily currency conversions.
- Is there a Google Sheets integration? You can use Google Sheets to import cost data from sources that don’t have an API. Some tools have turn-key integration with Google Sheets (so you don’t have to export and import a CSV file manually). You just update the data in the spreadsheet and the tool automatically uploads it to Google Analytics.
- Is retrospective data upload supported? Many ad platforms recalculate ad costs post-factum. Because of this, ad cost data for the same period may change. To accommodate these changes, some tools automatically import ad cost data for the entire previous week or month.
- Is it possible to import historical data? If you haven’t imported your ad cost data into Google Analytics before, you probably want to import past data. Some tools allow you to import data for the previous 3–6 months.
4. Check uploaded ad costs in Google Analytics.
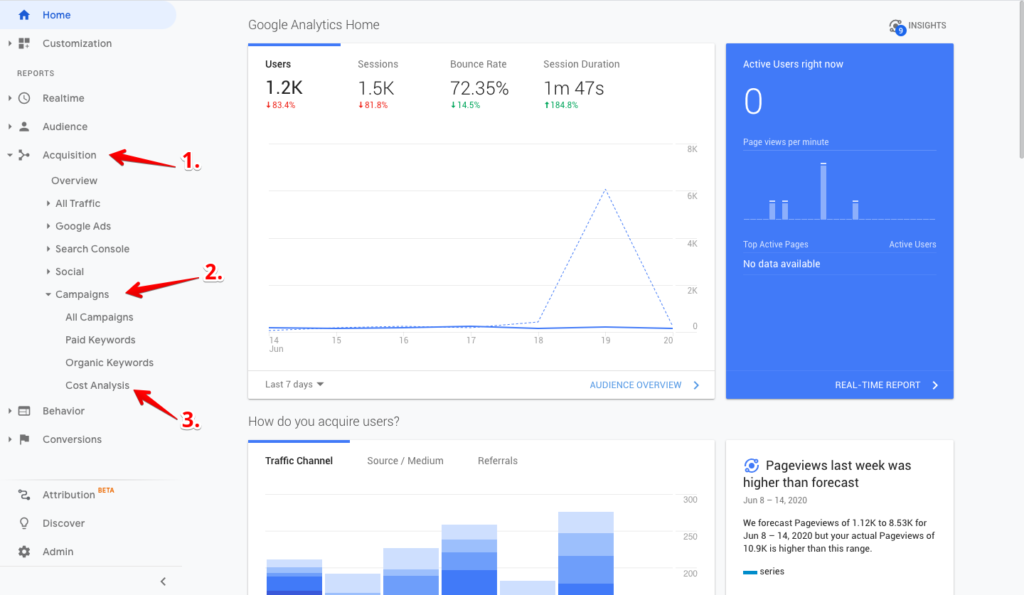
Go to the Acquisition > Campaign > Cost Analysis report, where information on the cost of advertising campaigns is available.
In this report, you can now see the costs not only for Google Ads, but also for your other ad platforms.
5. Add ad performance metrics to the report.
To make the report easier to use, add additional columns with your desired advertising performance metrics. To do this, click on “Edit” in the report and select the required metrics on the page that opens.
You can choose standard Google Analytics metrics as performance metrics, for example:
- Transactions: Number of orders placed on the site;
- Revenue: Revenue from placed orders on the site;
- ROAS: (revenue/cost data) x 100;
- RPC: Average revenue per click.
You can also add your own metrics to the reports by using calculated metrics, which allow you to add new metrics based on automated formulas. As an example, I’ll show you how to add the Cost of Sale (i.e. the percentage of revenue your ads consumed) to your report.
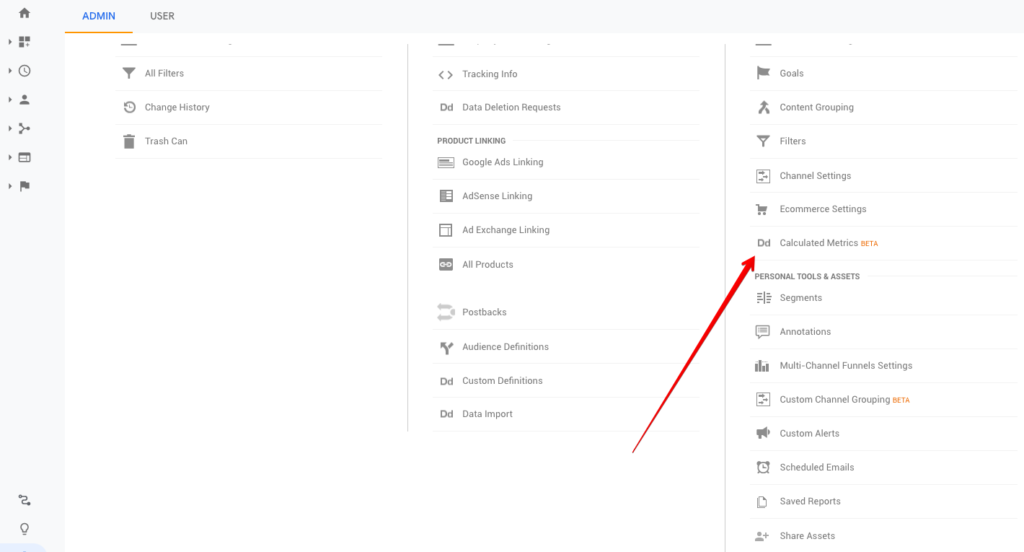
To do this, in the “Admin” section, find “Calculated Metrics” in the View menu:
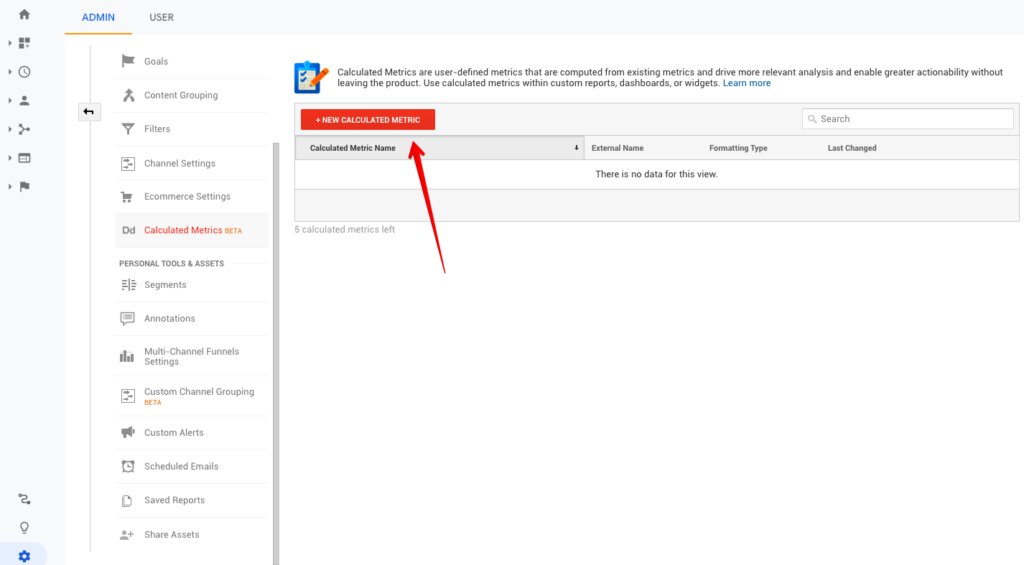
A section with all Calculated Metrics will open. To create a new metric, click on the ” + New calculated metric” button.
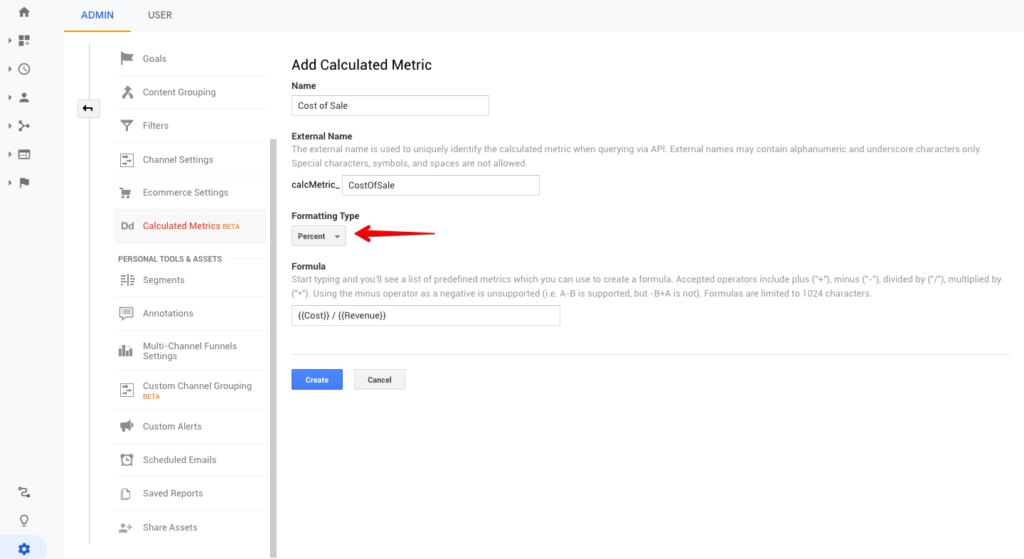
In the settings, specify the name of your metric (i.e. Cost of Sale) and, for this calculation, select “Percent” as the Formatting Type. The formula is in the screenshot below:
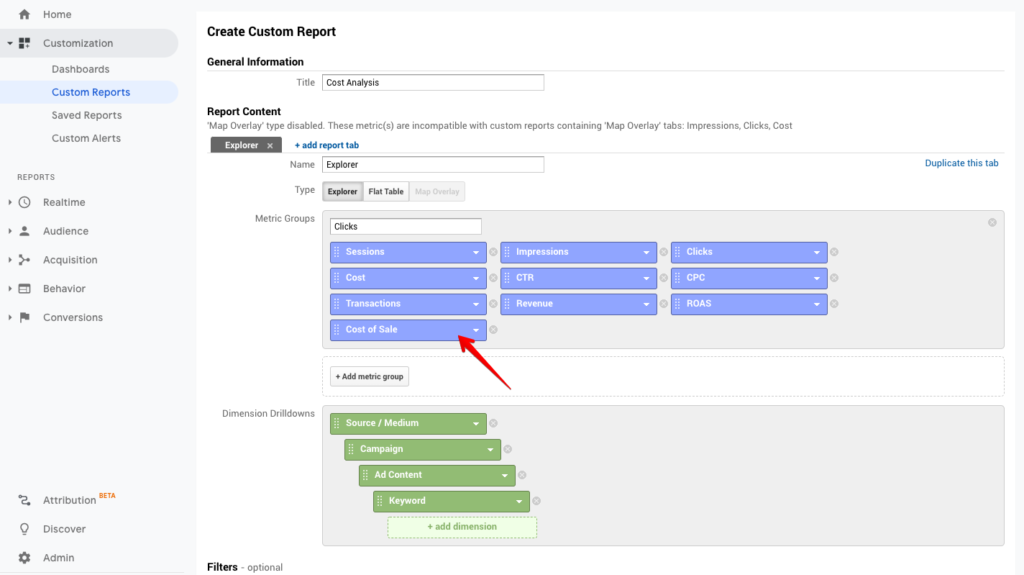
Click on the “Create” button. Now you can add the Cost of Sale metric in a custom report:
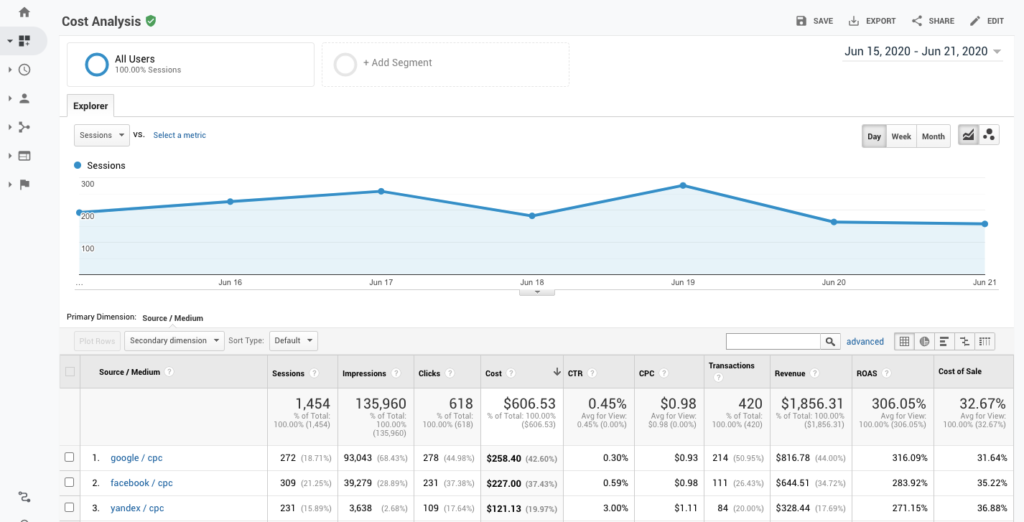
The final ad performance report might look like this:
You can analyze ad performance not only at the Source/Medium level but also at a more granular level. To do this, select the Secondary Dimension you’re interested in (e.g., Campaign, Ad Content, or Keyword).
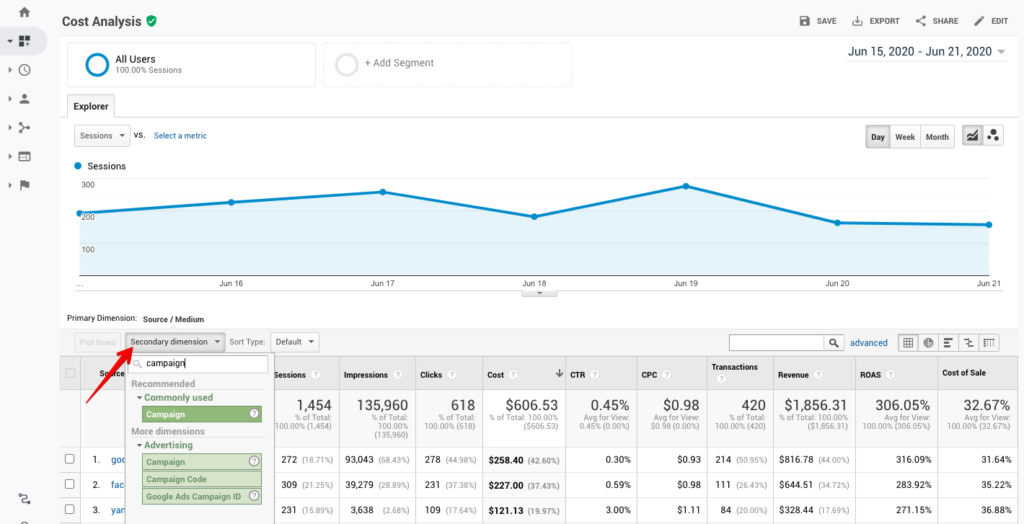
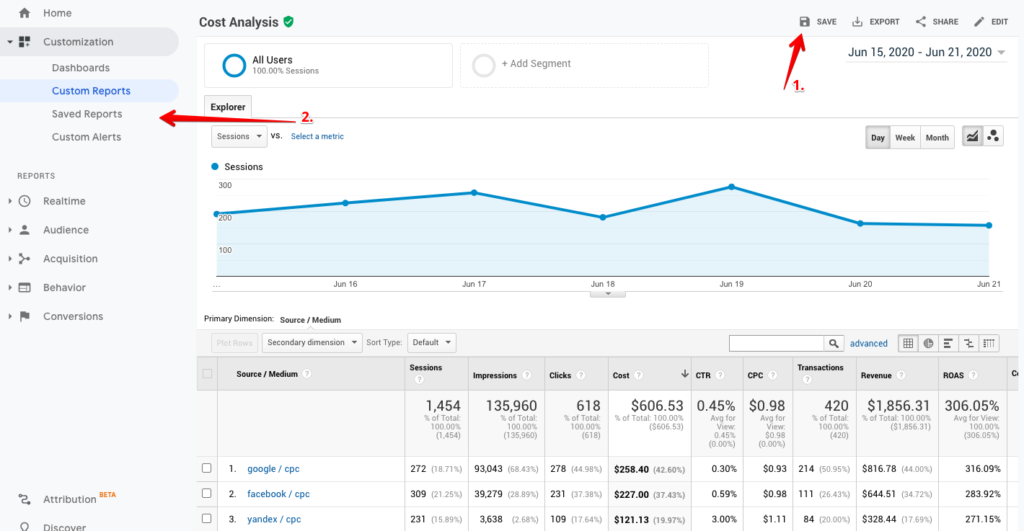
You can save the report so that you don’t have to configure it again in the future. It’s available in the Customization > Saved Reports section. Click Save and specify the name of your report.
How do you evaluate ROAS if the conversion is a lead, not a sale?
For many businesses, a conversion is a lead, registration, phone call, or other action without direct monetary value (unlike online stores, where conversion value = the amount of the placed order).
In this case, you can solve for ROAS in one of three ways:
Method #1. You don’t have to analyze ROAS at all. If the main conversion on your site is a lead form, you can benchmark ad performance against a Cost per Lead metric.
Say, for example, that you know it’s profitable to spend up to $50 for a lead. Thus, all channels and campaigns where the Cost per Lead is less than $50 will be effective for you.
If you still want to calculate ROAS, use one of the following two methods.
Method #2. The most basic (but often least accurate) method of analyzing ROAS is to set a conditional conversion value manually for each Goal. If, on average, one lead turns into $250 in final sales, you can use this number as the conversion value.
(For more information on how to set up conversion values, see the Google Analytics Help page.)
In the report in Google Analytics, you’ll see the following:
- You spent $2,500 on an ad campaign;
- Thanks to this ad campaign, you received 50 leads. The average cost of one acquired lead (CPL) is $50.
- If the value of one lead for your business is $250, then 50 leads mean the total received value is $12,500.
- To calculate ROAS, divide revenue by ad costs and multiply it by 100. In this case, the ROAS would be = (12,500 / 2,500) * 100 = 500% ROAS. (The Cost of Sale would be 20%.)
Method #3. If you’re not comfortable with such a calculation and want to combine data from Google Analytics with data on real sales from a CRM, we recommend using Google BigQuery to combine all data and build accurate end-to-end analytics reports.
When is Google Analytics not enough?
Despite the fact that Google Analytics allows you to import advertising costs and load offline data, it’s not always enough to analyze marketing performance, especially if:
- You want to analyze many dimensions and metrics, both online and offline. It’s much easier to export data from Google Analytics than to import all offline data into Google Analytics.
- Your reports require complex calculations and data transformations that are difficult or impossible to accomplish in Google Analytics.
- You need visual marketing reports that you can’t get within the standard Google Analytics interface.
- You want to apply advanced or custom attribution models that differ from those in Google Analytics.
In these cases, companies begin to build marketing analytics based on their own data warehouse (e.g., the aforementioned Google BigQuery), where all data from online and offline sources is collected without any restrictions.
By using Google BigQuery (or another data warehouse), businesses can:
- Collect raw data on a huge scale, without any limits or sampling;
- Transform and combine data from different sources according to any logic;
- Build absolutely any report using SQL;
- Visualize reports in any BI system—Google Data Studio, PowerBI, Tableau, Looker, etc.
- Apply advanced attribution models, including machine learning-based attribution.
Conclusion
By following the steps above, you now know how you can analyze the performance of all your advertising campaigns right in the Google Analytics interface.
While Google Analytics is not the only tool you’ll need to create and track your marketing campaigns, it’s one of the most versatile tools available today.






I would assume Google Analytics will eventually do better in allowing users to import offline data such as in-store purchases considering they are already allowing us to view store visits inside Google Ads by the way. I see this as a trend in general.