Testing tools are getting more sophisticated. Blogs are brimming with “inspiring” case studies. Experimentation is becoming more and more common for marketers. Statistical know-how, however, lags behind.
This post is filled with clear explanations of A/B testing statistics from top CRO experts. A/B testing statistics aren’t that complicated—but they are that essential to running tests correctly.
Here’s what we’ll cover (feel free to jump ahead):
- Mean, variance, and sampling;
- Statistical significance;
- P-values;
- Statistical power;
- Confidence intervals and margin of errors;
- Regression to the mean;
- Segmenting;
- Confounding variables and external factors.
And just in case you’re uncertain about why A/B testing statistics are so essential…
Why do I need to know A/B testing statistics?
Statistics aren’t necessarily fun to learn. It’s probably more fun to put up a test between a red and green button and wait until your testing tool tells you one of them has beaten the other.
If this is your strategy, you’re ripe for disappointment. This approach isn’t much better than guessing. Often, it ends with a year’s worth of testing but the exact same conversion rate as when you started.
Statistics help you interpret results and make practical business decisions. A lack of understanding of A/B testing statistics can lead to errors and unreliable outcomes.
As Matt Gershoff from Conductrics said, quoting his college math professor, “How can you make cheese if you don’t know where milk comes from?!”
Here’s an analogy from Matt:

Matt Gershoff:
“So, for example, say I have two cups of coffee, and I want to know which one is hotter and by how much. First, I would measure the temperature of each coffee. Next, I would see which one has the highest temp. Finally, I would subtract the lower temp coffee from the higher to get the difference in temperature. Obvious and super simple.
Now, let’s say you want to ask, “Which place in my town has the hotter coffee, McDonald’s or Starbucks?” Well, each place makes lots of cups of coffee, so I am going to have to compare a collection of cups of coffee. Any time we have to measure and compare collections of things, we need to use statistics.”
And so it is with conversion rates. Conversion optimization is a balancing act between exploration and exploitation. It’s about balancing risk, which is a fundamental problem solved by statistics. As Ton Wesseling put it:

Ton Wesseling:
“Within experimenting the trade off is always between exploration and exploitation. Do you want to know the real answer, or do you just want to make a profit?
If you are testing medicines that should stop someone from dying—and the A variant is not getting those medicines—when do you stop feeding Variant A with nothing when you see Variation B is working? During the test? After a couple of positive tests? How many people need to die before you decide to give everyone Variation B.
Of course running a business is less dramatic than the example, but still, you want to outgrow your competitors. You want to learn but not be fully 100% sure because that will make you too slow—not adjusting rapidly enough to user wishes.”
Knowing statistics will make you a better marketer. Learning these eight core aspects of A/B testing statistics will help you increase your conversion rates and revenue.
1. Mean, variance, and sampling
There are three terms you should know before we dive into the nitty-gritty of A/B testing statistics:
- Mean;
- Variance;
- Sampling.
Mean
The mean is the average. For conversion rates, it’s the number of events multiplied by the probability of success (n*p).
In our coffee example, this would be the process of measuring the temperature of each cup of coffee that we sample, then dividing by the total number of cups. The average temperate should be representative of the actual average.
In online experimentation, since we can’t know the “true” conversion rate, we’re measuring the mean conversion rate of each variation.
Variance
Variance is the average variability of our data. The higher the variability, the less precise the mean will be as a predictor of an individual data point.
It’s basically, on average, how far off individual cups of coffee are from the collection’s average temperature. In other words, how close will the mean be to each cup’s actual temperature? The smaller the variance, the more accurate the mean will be as a guess for each cup’s temperature.
Many things can cause variance (e.g. how long ago the coffee was poured, who made it, how hot the water was, etc.). In terms of conversion optimization, Marketing Experiments gives a great example of variance:

The two images above are the exact same—except that the treatment earned 15% more conversions. This is an A/A test.
A/A tests, which are often used to detect whether your testing software is working, are also used to detect natural variability. It splits traffic between two identical pages. If you discover a statistically significant lift on one variation, you need to investigate the cause.
Sampling
Since we can’t measure the “true conversion rate,” we have to select a sample that’s statistically representative of the whole.
In our coffee example, we don’t know the mean temperature of coffee from each restaurant. Therefore, we need to collect data on the temperature to estimate the average temperature. So, unlike comparing individual cups of coffee, we don’t measure all possible cups of coffee from McDonald’s and Starbucks. We use some of them to estimate the total.
The more cups we measure, the more likely it is that the sample is representative of the actual temperature. The variance shrinks with a larger sample size, and it’s more likely that our mean will be accurate.
Similarly, in conversion optimization, the larger the sample size, in general, the more accurate your test will be.
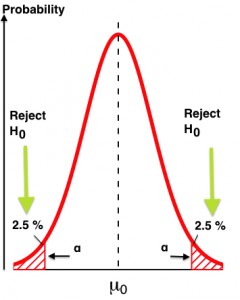
2. Statistical significance
Let’s start with the obvious question: What is statistical significance? As Evan Miller explains:
When an A/B testing dashboard says there is a “95% chance of beating original” or “90% probability of statistical significance,” it’s asking the following question: Assuming there is no underlying difference between A and B, how often will we see a difference like we do in the data just by chance?
Statistical significance is a major quantifier in null-hypothesis statistical testing. Simply put, a low significance level means that there’s a big chance that your “winner” is not a real winner. Insignificant results carry a larger risk of false positives (known as Type I errors).
If you don’t predetermine a sample size for your test and a stopping point (when the test will end), you’re likely get inaccurate results. Why? Because most A/B testing tools do not wait for a fixed horizon (a set point in time) to call statistical significance.
Most A/B tests oscillate between significant and insignificant at many points throughout the experiment:
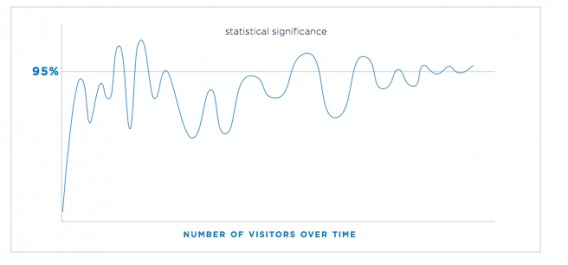
That’s one of the big reasons why statistical significance is not a stopping rule. The biggest mistake beginning optimizers make is calling their tests early.
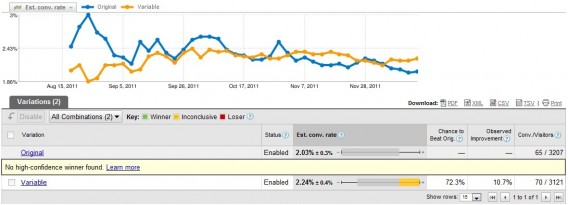
Here’s an example we’ve given before. Two days after a test started, here were the results:
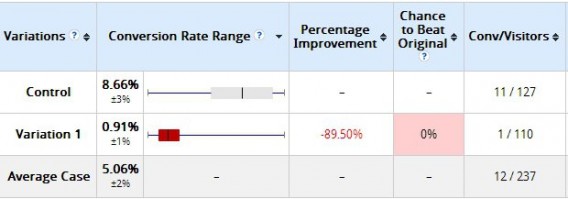
The variation clearly lost, right? It had a 0% chance to beat the original. Not so fast. Was it “statistically significant” according to the tool? Yes. But check out the results 10 days later:
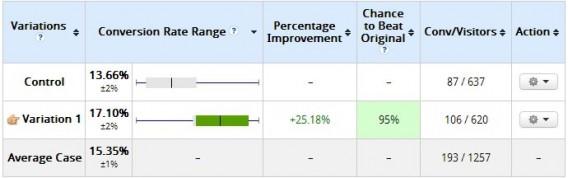
That’s why you shouldn’t peek at results. The more you peek at the results, the more you risk what’s called “alpha error inflation” (read about it here). Set a sample size and a fixed horizon, and don’t stop the test until then.
Also, be wary of case studies that claim statistical significance yet don’t publish full numbers. Many may be “statistically significant” but have a tiny sample size (e.g. 100 users).
3. P-values
If you do some follow-up reading on statistical significance, you’ll likely come across the term “p-value.” The p-value is a measure of evidence against the null hypothesis (the control in A/B testing parlance).
Matt Gershoff gave a great example and explanation in a previous article:
Matt Gershoff:
“If we go out and offer 50 prospects our ‘Analytics200’ promotion, we would expect, on average, to have 5 conference signups. However, we wouldn’t really be that surprised if we saw a few less or a few more.
But what is a few? Would we be surprised if we saw 4? What about 10, or 25, or zero? It turns out that the p-value answers the question, “How surprising is this result?”
Formally, the p-value is the probability of seeing a particular result (or greater one) from zero, assuming that the null hypothesis is true. If “null hypothesis is true” is confusing, replace it with, “assuming we had really run an A/A test.”
If our test statistic is in the “surprising” region, we reject the null (reject that it was really an A/A test). If the result is within the “not surprising” area, then we fail to reject the null. That’s it.
What you actually need to know about P-Values
The p-value does not tell you the probability that B is better than A. Similarly, it doesn’t tell you the probability that you’ll make a mistake if you implement B instead of A. These are common misconceptions.
Remember, the p-value is just the probability of seeing a result (or more extreme one) given that the null hypothesis is true. Or, “How surprising is this result?”
Small note: There’s a large debate in the scientific community about p-values. This comes primarily from the controversial practice of “p-hacking” to manipulate the results of an experiment until it reaches significance (so the author can get published).
4. Statistical Power
While statistical significance is the term you’ll hear most often, many people forget about statistical power. While significance is the probability of seeing an effect when none exists, power is the probability of seeing an effect when it does actually exist—the sensitivity of your test.
When you have low power levels, there’s a bigger chance that you’ll “miss” a real winner. Evan Miller put together a great chart to explain the differences:
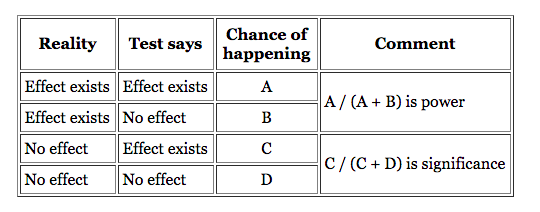
Effect Size FAQ summarizes it well:
Statistical power is the likelihood that a study will detect an effect when there is an effect there to be detected. If statistical power is high, the probability of making a Type II error, or concluding there is no effect when, in fact, there is one, goes down.
Four main factors affect the power of any test for statistical significance:
- Effect size;
- Sample size (n);
- Alpha significance criterion (α);
- Statistical power, or the chosen or implied beta (β).
For practical purposes, all you really need to know is that 80% power is the standard for testing tools. To reach that level, you need either a large sample size, a large effect size, or a longer duration test.
As Wesseling notes:
Ton Wesseling:
“You want to test as long as possible—at least one purchase cycle—the more data, the higher the statistical power of your test! More traffic means you have a higher chance of recognizing your winner on the significance level you’re testing on!
Because…small changes can make a big impact, but big impacts don’t happen too often. Most of the time, your variation is slightly better—so you need enough data to be able to notice a significant winner.”
One caveat: If your test lasts too long, you risk sample pollution. Read this post to learn more.
5. Confidence intervals and margin of errors
Confidence intervals are the amount of error allowed in an A/B test—a measure of the reliability of an estimate. Here’s an example from PRWD:
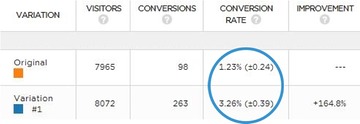
Since statistics is inferential, we use confidence intervals to mitigate the risk of sampling errors. In that sense, we’re managing the risk associated with implementing a new variation. So if your tool says something like, “We are 95% confident that the conversion rate is X% +/- Y%,” then you need to account for the +/- Y% as the margin of error.
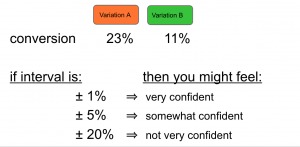
One practical application is to watch if confidence intervals overlap. As Michael Aagaard puts it:
So, the conversion range can be described as the margin of error you’re willing to accept. The smaller the conversion range, the more accurate your results will be. As a rule of thumb, if the two conversion ranges overlap, you’ll need to keep testing in order to get a valid result.
John Quarto has a great visual explaining confidence intervals:
Confidence intervals shrink as you collect more data, but at a certain point, there’s a law of diminishing returns.
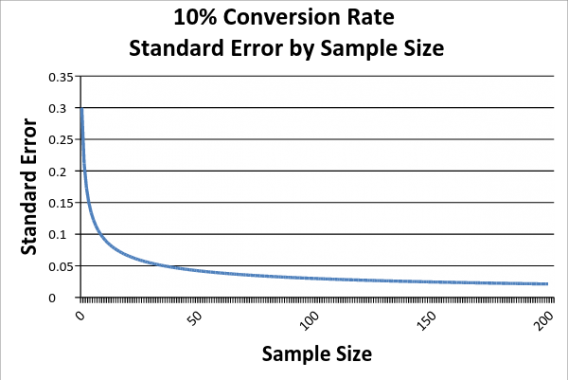
Reading right to left, as we increase our sample size, our sampling error falls. However, it falls at a decreasing rate, which means that we get less and less information from each addition to our sample.
Now, if you were to do further research on the subject, you might be confused by the interchangeability of the terms “confidence interval” and “margin of error”. For all practical purposes, here’s the difference: The confidence interval is what you see on your testing tool as “20% +/- 2%,” and the margin of error is “+/- 2%.”
Matt Gershoff gave an illustrative example:
Matt Gershoff:
“Say your buddy is coming to visit you from Round Rock and is taking TX-1 at 5 p.m. She wants to know how long it should take her. You say I have 95% confidence that it will take you about 60 minutes, plus or minus 20 minutes. So your margin of error is 20 minutes, or 33%.
If she is coming at 11 a.m., you might say, “It will take you 40 minutes, plus or minus 10 minutes,” so the margin of error is 10 minutes, or 25%. While both are at the 95% confidence level, the margin of error is different.”
6. Regression to the mean
A common question one might have when first testing is, “What is the reason for the wild fluctuations at the beginning of the test?” Here’s what I mean:
What’s happening is a regression to the mean. A regression to the mean is “the phenomenon that if a variable is extreme on its first measurement, it will tend to be closer to the average on its second measurement.”
A great example comes from Wikipedia:
Imagine you give a class of students a 100-item true/false test on a subject. Suppose all the students choose their answers randomly. Then, each student’s score would be a realization of independent and identically distributed random variables, with an expected mean of 50. Of course, some students would score much above 50 and some much below.
So say you take only the top 10% of students and give them a second test where they, again, guess randomly on all questions. Since the mean would still be expected to be near 50, it’s expected that the students’ scores would regress to the mean—their scores would go down and be closer to the mean.
In A/B testing, it can happen for a variety of reasons. If you’re calling a test early based only on reaching significance, it’s possible that you’re seeing a false positive. And it’s likely that your “winner” will regress to the mean.
A related topic is the novelty effect. That’s when the novelty of your changes (e.g. bigger blue button) brings more attention to the variation. With time, the lift disappears because the change is no longer novel.
Adobe outlined a method to distinguish the difference between a novelty effect and actual inferiority:
To determine if the new offer underperforms because of a novelty effect or because it’s truly inferior, you can segment your visitors into new and returning visitors and compare the conversion rates. If it’s just the novelty effect, the new offer will win with new visitors. Eventually, as returning visitors get accustomed to the new changes, the offer will win with them, too.
7. Segmenting
The key to learning in A/B testing is segmenting. Even though B might lose to A in the overall results, B might beat A in certain segments (e.g. organic, Facebook, mobile, etc). For segments, the same stopping rules apply.
Make sure that you have a large-enough sample size within each segment. Calculate it in advance; be wary if it’s less than 250–350 conversions per variation within each segment.
As André Morys said in a previous article, searching for lifts within segments that have no statistical validity is a big mistake:

Andre Morys, Web Arts
“We just ran a test for a big fashion retailer in the middle of the summer sale phase. It was very interesting to see how the results dramatically dropped during the ‘hard sale phase’ with 70% and more—but it recovered one week after the phase ended. We would never have learned this if the test hadn’t run for nearly four weeks.
Our ‘rule of thumb’ is this: 3,000–4,000 conversions per variation and a 3–4 week test duration. That is enough traffic so we can even talk about valid data if we drill down into segments.
Testing ‘sin’ no. 1: searching for uplifts within segments although you have no statistical validity—e.g. 85 vs. 97 conversions—that’s bullshit.”
You can learn a lot from segmenting your test data, but make sure you’re applying the same statistical rules to smaller data sets.
8. Confounding variables and external factors
There’s a challenge with running A/B tests: The data is “non-stationary.”
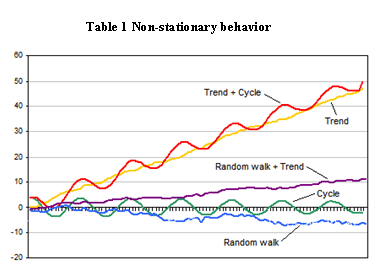
A stationary time series is one whose statistical properties (mean, variance, autocorrelation, etc.) are constant over time.
For many reasons, website data is non-stationary, which means we can’t make the same assumptions as with stationary data. Here are a few reasons data might fluctuate:
- Season;
- Day of the week;
- Holidays;
- Press (positive or negative);
- PPC/SEM;
- SEO;
- Word-of-mouth.
There are many more, most of which reinforce the importance of testing for full weeks. You can see this for yourself. Run a conversions per Day of Week report on your site to see how much fluctuation there is:
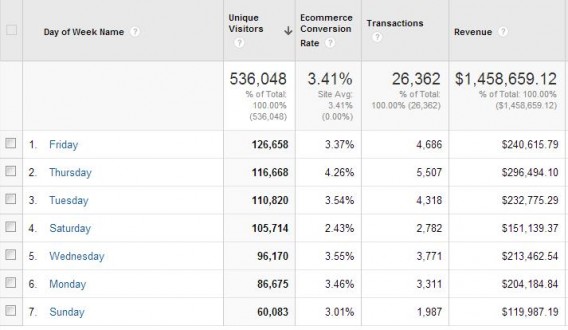
You can see that Saturday’s conversion rate is much lower than Thursday’s. So if you started the test on a Friday and ended on a Sunday, you’d skew your results.
If you’re running a test during Christmas, your winning test might not be a winner by the time February comes. Again, this is product of web data being nonstationary. The fix? If you have tests that win over the holidays (or during promotions), run repeat tests during “normal” times.
External factors definitely affect test results. When in doubt, run a follow-up test (or look into bandit tests for short promotions).
Conclusion
Learning the underlying A/B testing statistics allows you to avoid mistakes in test planning, execution, and interpretation. Here are some testing heuristics:
- Test for full weeks.
- Test for two business cycles.
- Make sure your sample size is large enough (use a calculator before you start the test).
- Keep in mind confounding variables and external factors (holidays, etc.).
- Set a fixed horizon and sample size for your test before you run it.
- You can’t “see a trend.” Regression to the mean will occur. Wait until the test ends to call it.
Working on something related to this? Post a comment in the CXL community!
Related Posts
-

A/B testing is highly useful, no question here. But a lot of businesses should not be…
-

Having a well-thought-out plan for A/B testing Facebook ad campaigns is essential if you want to…
-

Sometimes A/B testing is made to seem like some magical tool that will fix all…
-
Even if your A/B tests are well planned and strategized, when run, they can often lead to…


Hello Alex,
This reminds me of basic statistics in college. I can now see the applicability of the terms used back then ;)
Now, back to the topic at hand, statistical knowledge is important for predicting and making accurate decision online. If the right data are extracted and imposed into the right data then it becomes simpler to carryout proper A/B testing.
Every marketer should understand the basics of Testing so as to build on progressive changes in online marketing!
I left the above comment after reading this post in kingged.com
Great article Alex – a colleague linked it to me after I shared some sampling sizes for my A/B tests. I’d run an A/A test and with the first 200 leads, the “variation” was losing by -20%. After letting it run longer, at 2,000+ leads, it had evened out to a 0.59% difference. This helped clue me in that I might have been stopping some of my earlier tests too early and gave me a good mark to shoot for without going to the extreme of 4 weeks for a single test.
Love this, and so glad you guys wrote a clear write-up on these concepts.
It’s funny that confidence intervals and p-values have been set as the standard for reporting legit test results when so many research experts now openly state that p-values are like, the least interesting/useful thing to report in a study (the most interesting/useful thing being a properly calculated effect size).
I’ve often wondered: Do popular testing tools like Optimizely/VWO actually calculate effect size indices or are they just reporting the absolute difference between test means? Like, when a blog post about a recent test says something like “We got 120% increase in conversions with 99% significance”: is the 120% actually a legit calculation of effect size or just raw difference (and thus, in the latter case, bullshit)?
If anyone’s interested, another great jargon-free and comprehensive post on the statistical dos and don’ts of testing can be found here: http://www.optimizesmart.com/understanding-ab-testing-statistics-to-get-real-lift-in-conversions/
I won’t speak about Optimizely, but at VWO we calculate the effect size. (Disclaimer: I’m the statistician who helped build VWO SmartStats.)
In fact, we heavily de-emphasize the midpoint estimate in the UI in order to accurately communicate the uncertainty. Our test summary says something like: “V1 Blue Button has shown to have between a 0.4% and 6.7% better conversion rate than all other variants. Recommended action: Discard all other variants and go with V1 Blue Button.”
These numbers are calculated using Bayesian credible intervals at the 99% level.
Great post as always Alex!
Check out VWO’s SmartStats here – https://vwo.com/bayesian-ab-testing
Results and reports are much easier to understand. P value always used to confuse me too :)
Excellent post! I’ve been looking for something like this for a long time now.
Thanks, Jocelyn, glad you liked the article!