Statistical significance is only part of deciding whether an A/B test is trustworthy. A test can fail to detect a real improvement simply because it does not have enough statistical power.
Statistical power is the probability that a test will detect an effect of a specified size when that effect genuinely exists. It is usually expressed as 1 – β, where β is the probability of a Type II error, or false negative.
For A/B testing, power should be considered before the test starts alongside sample size, the minimum effect you want to detect, the significance level, and the underlying conversion rate. An underpowered test increases the risk of missing an effect that actually matters.
This guide explains what statistical power means, how it relates to statistical significance and error rates, what determines the power of an A/B test, and how to calculate the sample size you need before running one.
TL;DR
- Statistical power is the probability that a test detects an effect of a specified size when that effect actually exists.
- Power equals 1 – β, so lower power means a higher risk of Type II errors, or false negatives.
- Sample size, effect size, significance level, and the test design all influence statistical power.
- 80% power is a common starting point for A/B test planning, not a universal requirement.
- Calculate power and sample size before launching a test. Do not stop simply because statistical significance appears.
Table of contents
- What is statistical power?
- What is the difference between statistical power and statistical significance?
- What are Type I and Type II errors?
- What determines statistical power?
- How do you calculate statistical power for an A/B test?
- What should you remember about statistical power?
- Frequently asked questions about statistical power
- What should marketers do next?
What is statistical power?
Statistical power is the probability that a statistical test correctly detects an effect of a specified magnitude when that effect exists.
Power is expressed as 1 – β, where β represents the probability of making a Type II error. For example, a test designed for 80% power has a 20% probability of failing to detect the specified effect if that effect genuinely exists.
For A/B testing, higher power makes it less likely that a meaningful improvement will be missed because the experiment did not collect enough information.
Statistical power is the crowning achievement of the hard work you put into conversion research and properly prioritized treatment(s) against a control. This is why power is so important—it increases your ability to find and measure differences when they’re actually there.
Statistical power (1 – β) holds an inverse relationship with Type II errors (β). It’s also how to control for the possibility of false negatives. We want to lower the risk of Type I errors to an acceptable level while retaining sufficient power to detect improvements if test treatments are actually better.
Finding the right balance, as detailed later, is both art and science. If one of your variations is better, a properly powered test makes it likely that the improvement is detected. If your test is underpowered, you have an unacceptably high risk of failing to reject a false null.
Before we go into the components of statistical power, let’s review the errors we’re trying to account for.
What is the difference between statistical power and statistical significance?
Statistical significance asks whether the observed result would be sufficiently unusual if the null hypothesis were true.
Statistical power asks how likely the test is to detect an effect of a specified size when that effect actually exists.
A test can therefore be correctly designed for statistical significance but still have too little power to reliably detect the effect the business cares about.
What are Type I and Type II errors?
A Type I error is a false positive: the test concludes that an effect exists when it does not.
A Type II error is a false negative: the test fails to detect an effect that actually exists.
Statistical significance controls the Type I error rate, while statistical power is directly related to the Type II error rate.
Type I errors
A Type I error, or false positive, rejects a null hypothesis that is actually true. Your test measures a difference between variations that, in reality, does not exist. The observed difference—that the test treatment outperformed the control—is illusory and due to chance or error.
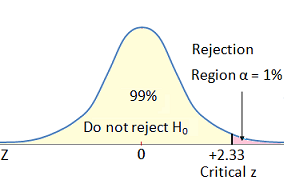
The probability of a Type I error, denoted by the Greek alpha (α), is the level of significance for your A/B test. If you test with a 95% confidence level, it means you have a 5% probability of a Type I error (1.0 – 0.95 = 0.05).
If 5% is too high, you can lower your probability of a false positive by increasing your confidence level from 95% to 99%—or even higher. This, in turn, would drop your alpha from 5% to 1%. But that reduction in the probability of a false positive comes at a cost.
By increasing your confidence level, the risk of a false negative (Type II error) increases. This is due to the inverse relationship between alpha and beta—lowering one increases the other.
Lowering your alpha (e.g. from 5% to 1%) reduces the statistical power of your test. As you lower your alpha, the critical region becomes smaller, and a smaller critical region means a lower probability of rejecting the null—hence a lower power level. Conversely, if you need more power, one option is to increase your alpha (e.g. from 5% to 10%).
Type II errors
A Type II error, or false negative, is a failure to reject a null hypothesis that is actually false. A Type II error occurs when your test does not find a significant improvement in your variation that does, in fact, exist.
Beta (β) is the probability of making a Type II error and has an inverse relationship with statistical power (1 – β). If 20% is the risk of committing a Type II error (β), then your power level is 80% (1.0 – 0.2 = 0.8). You can lower your risk of a false negative to 10% or 5%—for power levels of 90% or 95%, respectively.
Type II errors are controlled by your chosen power level: the higher the power level, the lower the probability of a Type II error. Because alpha and beta have an inverse relationship, running extremely low alphas (e.g. 0.001%) will, if all else is equal, vastly increase the risk of a Type II error.
When it comes to statistical power, which variables affect that balance? Let’s take a look.
What determines statistical power?
Four inputs are particularly important when planning the power of an A/B test:
- Sample size
- Minimum Effect of Interest (MEI, or Minimum Detectable Effect)
- Significance level (α)
- Desired power level (implied Type II error rate)
Changing one affects the others. Smaller effects require more data to detect reliably, while higher desired power generally requires a larger sample.
1. Sample Size
Larger samples generally increase statistical power because they give the test more information with which to distinguish a real effect from random variation.
You need enough visitors to each variation as well as to each segment you want to analyze. Pre-test planning for sample size helps avoid underpowered tests; otherwise, you may not realize that you’re running too many variants or segments until it’s too late, leaving you with post-test groups that have low visitor counts.
Do not use a fixed number of weeks as the statistical stopping rule for every experiment. Calculate the required sample size before launch and run the test until the planned stopping condition is reached.
Duration still matters operationally. Tests should cover relevant business cycles so that weekday, weekend, campaign, and other recurring behavioral patterns do not distort the sample.
For fixed-horizon tests, avoid repeatedly checking the results and stopping as soon as significance appears. If you use a sequential testing method, follow the stopping rules defined by that method.
Establishing a minimum sample size and a pre-set time horizon avoids the common error of simply running a test until it generates a statistically significant difference, then stopping it (peeking).
2. Minimum Effect of Interest (MEI)
The Minimum Effect of Interest (MEI) is the smallest improvement that would be valuable enough for the business to care about and that you want the experiment to detect reliably.
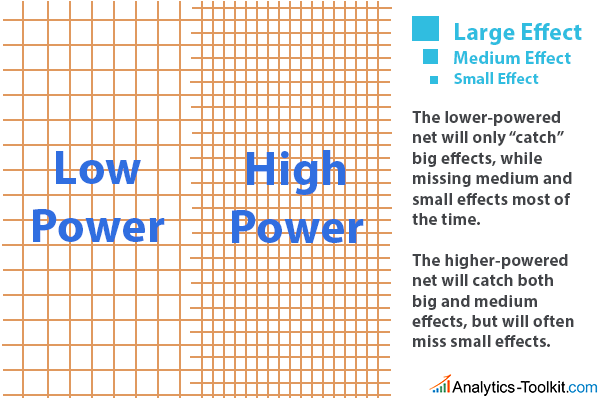
Smaller effects require larger samples. If a test needs enough power to detect a very small improvement, it will generally need considerably more observations.
MEI and minimum detectable effect (MDE) are related, but they are not exactly the same thing. MEI is a decision made when designing the experiment: the smallest effect worth detecting. MDE describes the sensitivity of a particular test design at a specified sample size, significance level, and power.
Large observed lifts from very small samples can also come with extremely wide confidence intervals. That makes the estimate too imprecise to support a strong business decision, even when the headline percentage looks impressive.
A great way to visualize the relationship between power and effect size is this illustration by Georgiev, where he likens power to a fishing net:
3. Statistical Significance
The significance level, or alpha (α), defines the threshold for rejecting the null hypothesis and controls the test’s Type I error rate.
A common significance level is α = 0.05. Under the assumptions of the test, that means the testing procedure accepts a 5% Type I error rate when the null hypothesis is true.
A p-value does not tell you the probability that the result happened “by chance,” nor does a 95% confidence level mean there is a 95% probability that the variation is genuinely better.
Instead, the p-value measures how compatible the observed result is with the null hypothesis under the assumptions of the statistical test.
Holding everything else constant, using a lower alpha makes the evidence threshold stricter but also reduces power. That usually means a larger sample is needed to maintain the same ability to detect the effect you care about.
4. Desired Power Level
There is no universal power level that is correct for every experiment.
80% power is a common starting point. It means the test has an 80% probability of detecting the specified effect when that effect actually exists, or a 20% Type II error rate.
Higher power reduces the risk of false negatives but requires more data for the same effect size and significance level.
Choose the power level based on the cost of missing a real improvement, the size of the effect you care about, and the amount of traffic available.
How do you calculate statistical power for an A/B test?
Calculate statistical power before launching the experiment by defining the baseline conversion rate, minimum effect of interest, significance level, desired power, and whether the hypothesis test is one-sided or two-sided.
A power or sample-size calculator can then determine the sample needed for each variation.
CXL’s A/B Test Calculator lets you specify the confidence level, power level, control conversion rate, MDE, number of variants, weekly traffic, and whether the test is one-sided or two-sided.
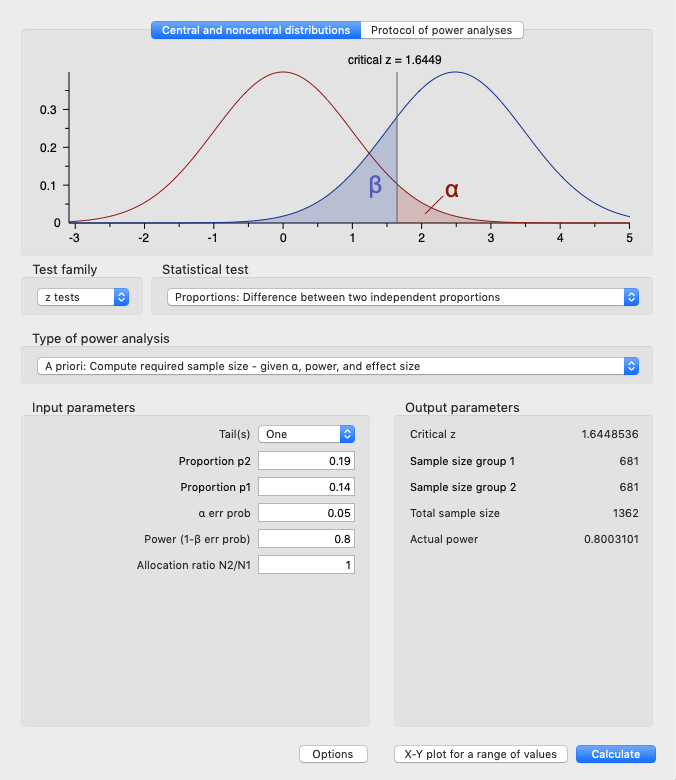
G*Power can also calculate statistical power and sample requirements for a range of statistical tests.
In this example, the test compares a 14% control conversion rate with an expected 19% conversion rate using 80% power and a 5% alpha. The required sample also depends on whether the hypothesis test is one-sided or two-sided, so that choice should always be specified when reporting the calculation.
What should you do if you can’t reach the required sample size?
If an A/B test cannot realistically reach the required sample size, reconsider the experiment design rather than changing statistical thresholds simply to make the test fit the available traffic.
For example, a sample-size calculation might show that an experiment needs more than 8,000 observations per variation.
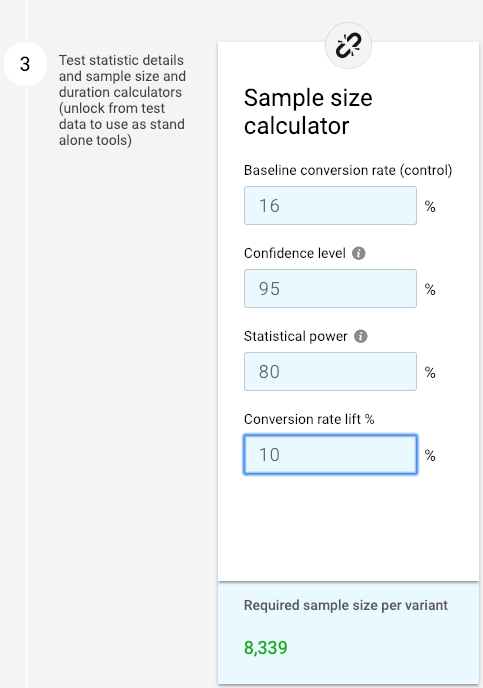
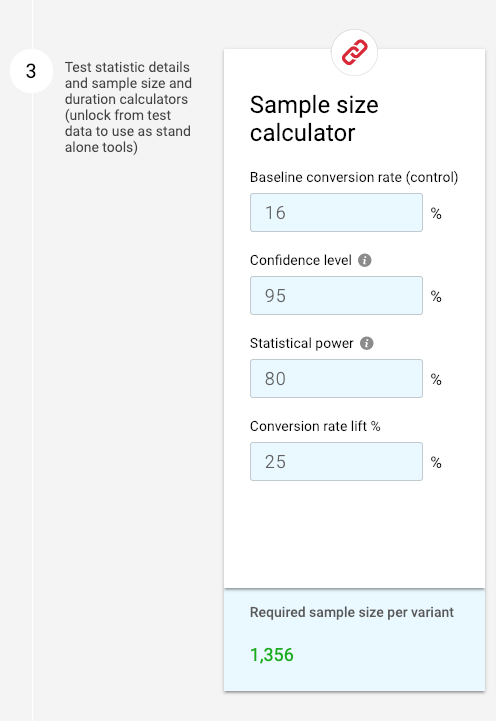
Testing for a larger effect can reduce the required sample, but only when that larger effect is commercially meaningful and realistic. Increasing the effect threshold purely to make the required sample smaller changes the question the experiment is designed to answer.
Other options include:
- Reduce the number of variants competing for the same traffic.
- Avoid analysing small segments that were not independently powered.
- Run the experiment on a higher-traffic population when the same hypothesis applies.
- Use a higher-frequency primary metric only when it still measures the outcome the experiment is intended to improve.
- Extend the test when additional runtime can realistically produce the required sample.
- Decide that the experiment is not feasible with the available traffic.
Changing alpha or the desired power is also possible, but those are risk decisions. They should be chosen before the experiment based on the relative cost of false positives and false negatives—not adjusted simply because the original sample requirement is inconvenient.
What should you remember about statistical power?
Statistical power determines how likely an A/B test is to detect an effect of the size you care about when that effect genuinely exists.
Before running an experiment:
- Define the business outcome and primary metric.
- Set the minimum effect worth detecting.
- Choose the significance and power levels.
- Calculate the required sample size before launch.
- Decide whether the test is one-sided or two-sided.
- Run the experiment according to the stopping rule you chose.
- Interpret statistical significance alongside effect size and confidence intervals.
More traffic does not automatically make an experiment good, and statistical significance alone does not make a result useful. The test design needs enough power to answer the question you actually care about.
Frequently asked questions about statistical power
What is statistical power in A/B testing?
Statistical power is the probability that an A/B test detects an effect of a specified size when that effect actually exists.
Is 80% statistical power enough?
80% is a common starting point, but the right level depends on the cost of missing a real effect and the sample available.
What is an underpowered A/B test?
An underpowered test does not have enough sensitivity to reliably detect the effect it was designed to find.
Does statistical significance mean a test has enough power?
No. Statistical significance and statistical power measure different aspects of an experiment.
How can you increase statistical power?
Increase sample size, target a larger meaningful effect, or change other design parameters before the experiment begins.
What is the difference between MEI and MDE?
MEI is the smallest effect worth detecting. MDE is the effect a specific test design can detect at a given power and significance level.
What should marketers do next?
Strong experimentation depends on more than reaching statistical significance. Build the statistical, experimentation, and measurement skills needed to design tests correctly before acting on the results.
Build stronger A/B testing statistics: CXL’s Statistics for A/B Testing course covers statistical significance, power, sample-size calculations, false positives, and interpreting experiment results.
Build a complete experimentation skillset: The Conversion Optimization Minidegree covers conversion research, experimentation, statistical hypothesis testing, testing strategy, and CRO program management.
Apply stronger measurement inside AI-enabled workflows: The AI Native Marketer program teaches marketers to build working AI systems around reporting, measurement, research, and marketing decision-making.
Related Posts
-

The correct answer is of course that you should start testing where you have the…
-

While running A/B tests on all your traffic at once is often tempting, it's best to…
-

You should split test the headline first! Bollocks. The images! What a load of crap. That's the…
-
A/B testing is fun. With so many easy-to-use tools, anyone can—and should—do it. However, there's…