
If you’re doing it right, you probably have a large list of A/B testing ideas in your pipeline. Some good ones (data-backed or result of a careful analysis), some mediocre ideas, some that you don’t know how to evaluate.
We can’t test everything at once, and we all have a limited amount of traffic.
You should have a way to prioritize all these ideas in a way that gets you to test the highest potential ideas first. And the stupid stuff should never get tested to begin with.
How do we do that?
There are a lot of models for prioritization, and while we found them helpful, we also found each one lacking in one way or another. So we developed our own.
Note: If you don’t know what to test, study the ResearchXL model to come up with data-informed test ideas. Come back to this post when you need a way to prioritize them in a smart way.
TL;DR
- PXL is CXL’s framework for prioritizing A/B test ideas using specific evidence and implementation criteria instead of broad subjective scores.
- PIE and ICE are useful frameworks, but categories such as “potential,” “impact,” and “confidence” can leave too much room for interpretation.
- PXL gives more weight to ideas supported by user research, qualitative feedback, analytics, heatmaps, or eye tracking.
- Noticeability, reach, and implementation effort also affect how an idea scores.
- PXL should be customized to reflect the constraints and priorities of your business.
Table of contents
What’s wrong with existing A/B test prioritization models?
The problem isn’t that frameworks like PIE and ICE are useless. It’s that broad criteria such as potential, impact, and confidence can leave too much room for subjective scoring.
“Essentially, all models are wrong, but some are useful” – George E. P. Box, a British statistician
If you’ve been in the optimization game for longer than a minute, you’ve probably heard of a few prioritization frameworks (we’ve written about them before). Two common prioritization frameworks are:
- PIE framework
- ICE framework
PIE
The PIE framework might be the most widely known in the conversion optimization space. It includes three variables:’
- Potential – How much improvement can be made on the pages?
- Importance – How valuable is the traffic to the pages? (amount of traffic, etc.)
- Ease – How complicated will the test be to implement on the page or template?
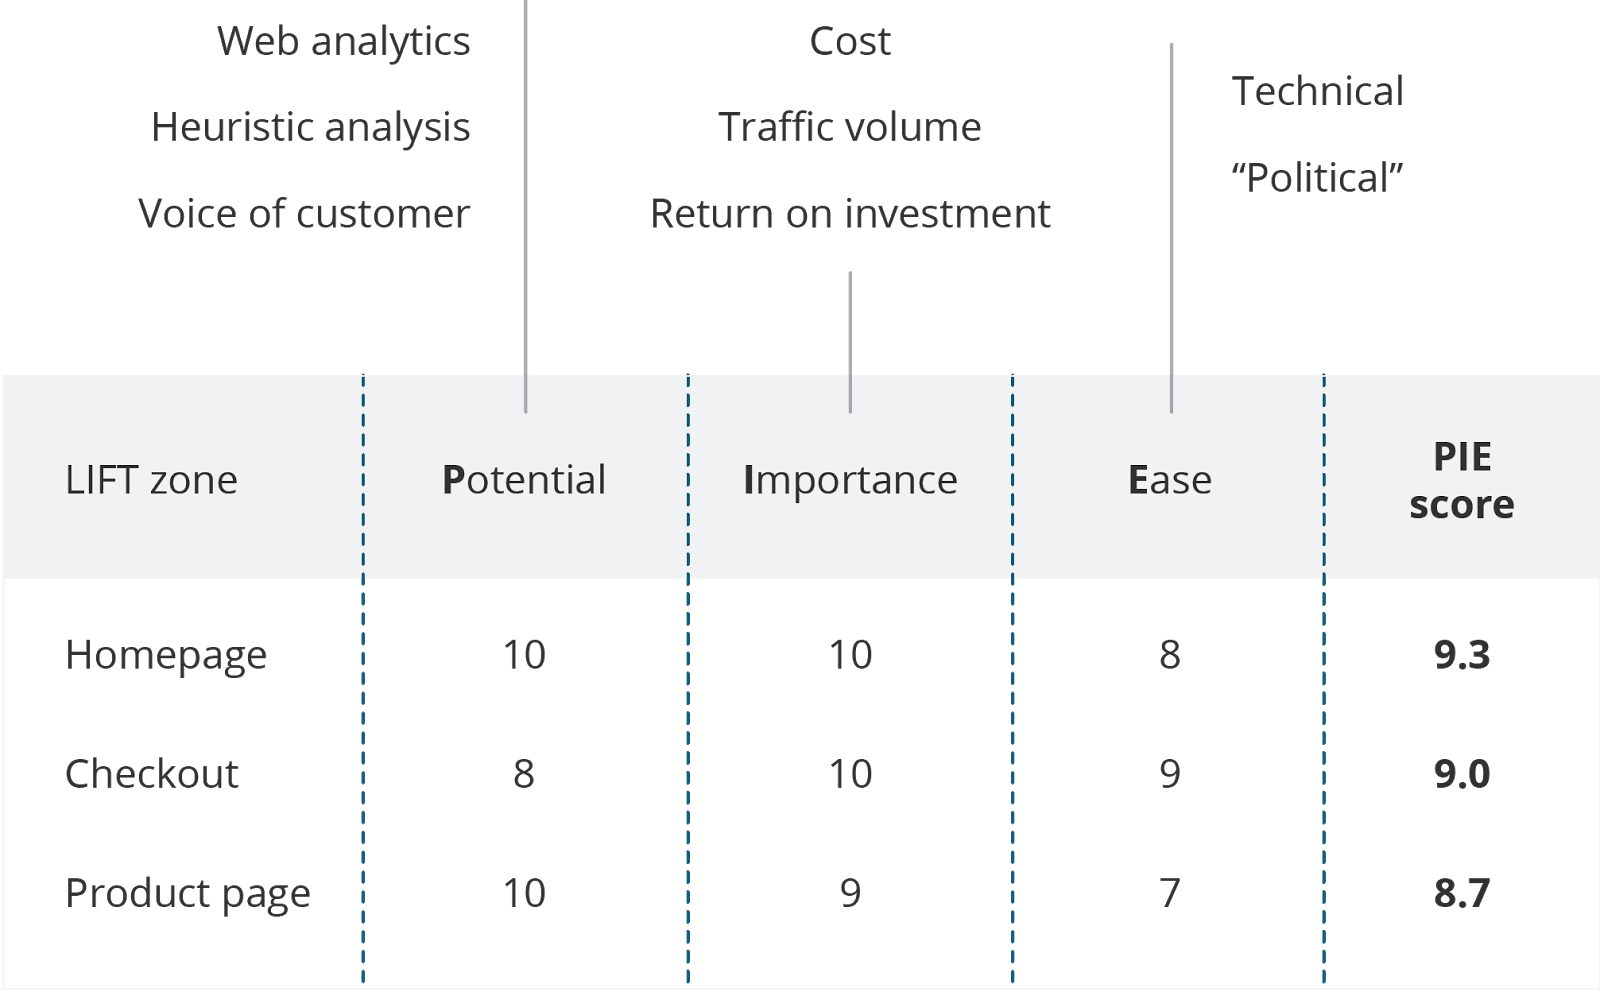
We’ve used this framework with clients. Only problem with it is the criteria of each variable leaves way too much open to interpretation. How do you objectively determine the potential of a test idea?
If we’d know in advance how much potential an idea has, we wouldn’t need prioritization models. Or for example, if you’re part of larger team, and you want to push your idea through, why not tack on a couple points to potential (since it’s a subjective number anyway)? In an ideal world, frameworks would remove subjectivity.
In addition, it’s hard to objectively place the importance of Ease, as well as Importance.
The wisdom of the crowd tends to be shockingly accurate, but still, we had similar feelings to this comment:

ICE Score
The ICE Score, popularized by GrowthHackers founder Sean Ellis, uses three variables:”
- Impact – What will the impact be if this works?
- Confidence – How confident am I that this will work?
- Ease – What is the ease of implementation?
But if I could guess what the impact would be, why would I even test it?
It’s got a similar problem to the PIE framework in that aspect, but in addition it’s also got the problem of “how confident am I in this idea?” Again, how could we know this in advance?
As objective and “experience-based” as you’d like this to be, it’s almost impossible to get a consistent and objective rating here. Again, it’s easy to skew, too, if you really want to pursue the idea. Or even if we really tried to score test ideas as accurately as we can, 2 scores out of the 3 are a lot about “gut feeling.”
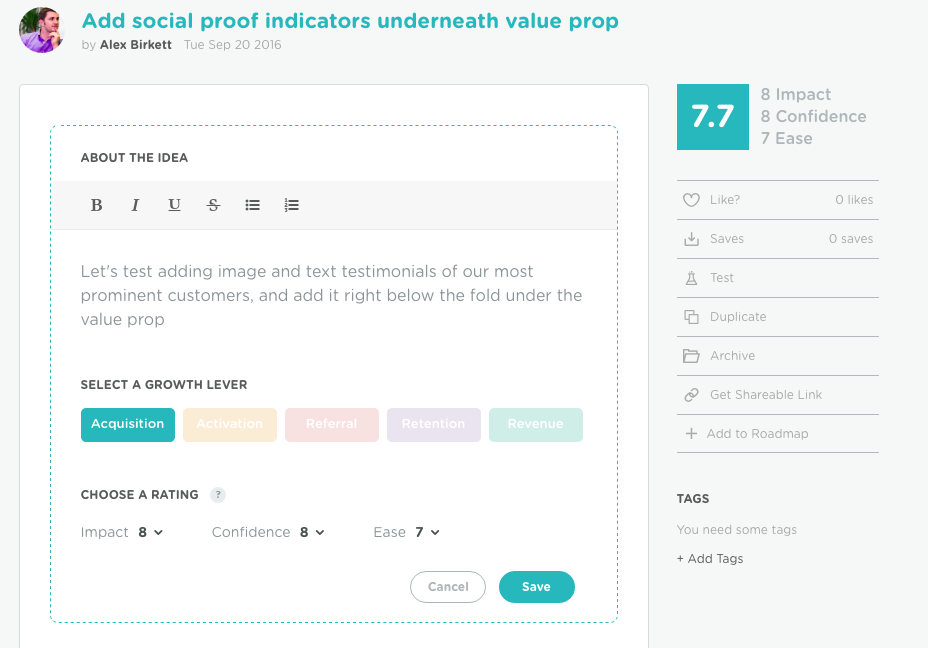
Again, a useful framework, but has its problems.
ICE (version two)
There’s another ICE framework built around a different set of criteria:
- Impact – could be measured in sales growth, cost savings, etc. Anything that benefits the company.
- Cost – straightforward, how much does this idea cost to implement?
- Effort – how many resources are available and how much time is required for this idea?
This ICE framework is a bit more specific on the criteria by which you rate things. It also makes the scale smaller: you can only score things 1 or 2, depending on whether you believe the opportunity is “high” or “low.” You then add up all the numbers and you have an aggregate score. You make decisions off that number.
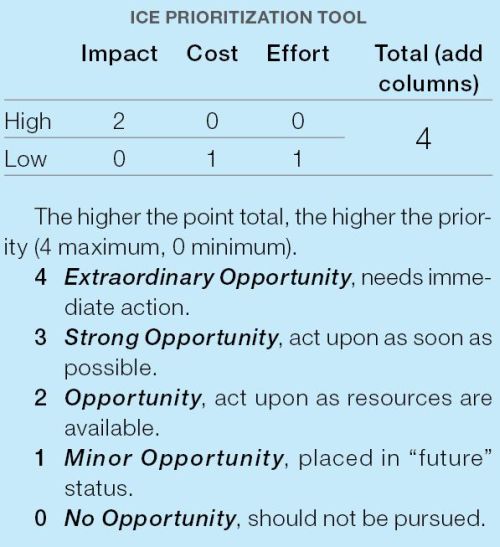
With binary scale like this, you avoid the error of central tendency. The smaller response scale tends to make things more accurate, too. As Jared Spool said, “anytime you’re enlarging the scale to see higher-resolution data it’s probably a flag that the data means nothing.”
This one is better but it’s still not perfect – the potential impact is still quite subjective. And you could have many ideas that all score a 3 or 4. Then how do you prioritize those?
HotWire’s Prioritization Model
At CXL Live 2016, Pauline Marol and Josephine Foucher from Hotwire shared their own prioritization framework. It also uses binary scoring:

As you can see, they expand to include many conversion specific variables, like mobile experience and targeting.
This, and the binary ICE Framework, were an inspiration when it came to creating our own robust framework.
We wanted something that eliminated equivocation – you have to make a yes or no, binary decision, when ranking items. We also wanted something with specific variables and specific criteria, so nothing that just said “impact” – rather, it would give specific and objective things to rate.
fter experimenting with various ideas while working with optimization clients, we finally came to a model that truly has helped us and our clients prioritize their tests.
What is the PXL framework?
PXL is CXL’s framework for prioritizing A/B test ideas. Instead of asking teams to broadly estimate things like ‘impact’ or ‘confidence,’ it uses specific criteria around evidence, noticeability, reach, and implementation effort.
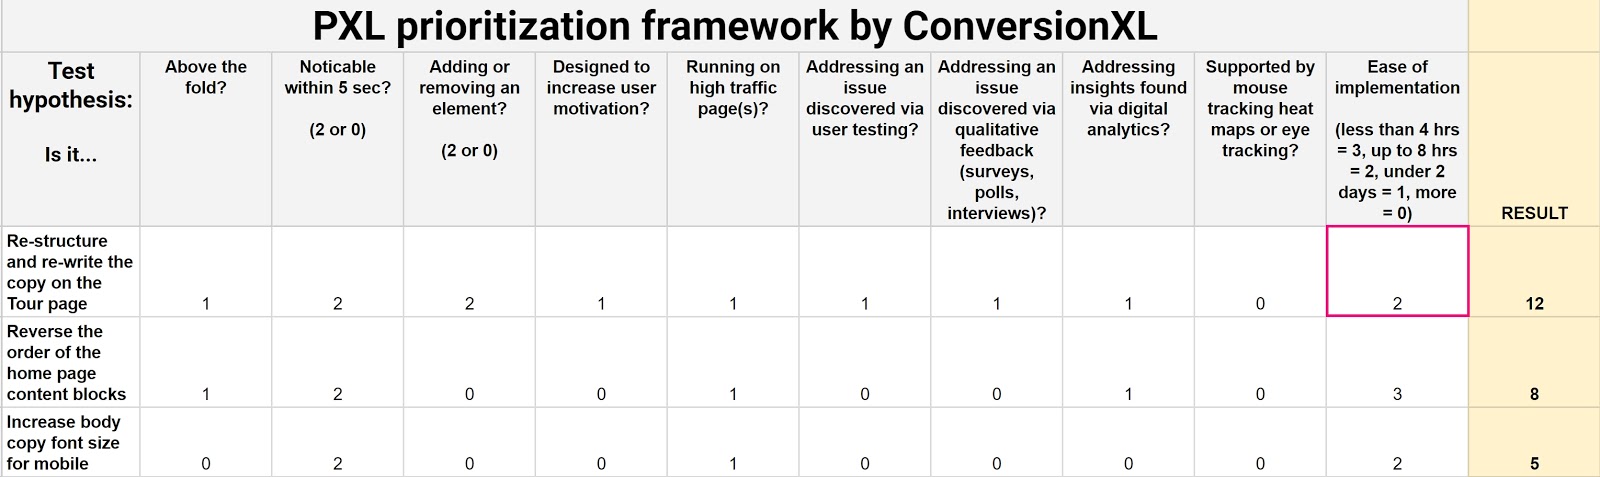
Grab your own copy of this spreadsheet template here. Just click File > Make a Copy to have your own customizable spreadsheet.
This framework brings these 3 benefits:
- It makes any “potential” or “impact” rating more objective
- It helps to foster a data-informed culture
- It makes “ease of implementation” rating more objective
A good test idea is one that can impact user behavior. So instead of guessing what the impact might be, this framework asks you a set of questions about it.
- Is the change above the fold? → Changes above the fold are noticed by more people, thus increasing the likelihood of the test having an impact
- Is the change noticeable in under 5 seconds? → Show a group of people control and then variation(s), can they tell the difference after seeing it for 5 seconds? If not, it’s likely to have less impact
- Does it add or remove anything? → Bigger changes like removing distractions or adding key information tend to have more impact
- Does the test run on high traffic pages? → Relative improvement on a high traffic page results in more absolute dollars.
If all we have is discussing opinions about what to test, prioritization becomes meaningless. At CXL, we’ve seen the power of solid conversion research, so many of the variables specifically require you to bring data to the table to prioritize your hypotheses. Ideas that come from opinions score lower.
The PXL model asks everyone to bring data:
- Is it addressing an issue discovered via user testing?
- Is it addressing an issue discovered via qualitative feedback (surveys, polls, interviews)?
- Is the hypothesis supported by mouse tracking heat maps or eye tracking?
- Is it addressing insights found via digital analytics?
Having weekly discussions on tests with these 4 questions asked from everyone will quickly make people stop relying on just opinions.
“Data is the antidote to delusion” – Alistar Croll & Benjamin Yoskovitz (authors of Lean Analytics)
Then we also put bounds on Ease of implementation by bracketing answers according to the estimated time. Ideally you’d have a test developer be part of prioritization discussions.
Even though developers tend to underestimate how long things will take, forcing a decision based on time here makes it more objective. Less of a “shot in the dark.”
How do you score A/B tests with PXL?
PXL scores most criteria as 0 or 1, with additional weighting for factors such as noticeability, adding or removing elements, and ease of implementation.
We made this under the assumption of a binary scale – you have to choose one or the other. So for most variables (unless otherwise noted), you choose either a 0 or a 1.
But we also wanted to weight certain variables because of their importance – how noticeable the change is, if something is added/removed, ease of implementation. So on these variables, we specifically say how things change. For instance, on the Noticeability of the Change variable, you either mark it a 2 or a 0.
Should you customize the PXL framework?
Yes. The PXL framework is designed to be adapted to the priorities, constraints, and risks that matter to your business.
All organizations operate differently, so it’s naive to think that the same prioritization model is equally effective for everyone.
We built this model with the belief that you can and should customize the variable based on what matters to your business.
For example, maybe you’re operating in tangent with a branding or user experience team, and it’s very important that the hypothesis conforms to brand guidelines. Add it as a variable.
Maybe you’re at a startup whose acquisition engine is fueled primarily by SEO. Maybe your funding depends on that stream of customers. So you could add a category like, “doesn’t interfere with SEO,” which might alter some headline or copy tests.
Point is, all organizations operate under different assumptions, but by customizing the template, you can account for them, and optimize your optimization program.
Frequently asked questions about the PXL framework
What does PXL do?
PXL ranks A/B test ideas using specific evidence, impact proxies, and implementation criteria.
How is PXL different from ICE?
ICE scores Impact, Confidence, and Ease. PXL replaces broad subjective ratings with more specific criteria tied to research, noticeability, traffic, and implementation effort.
How is PXL different from PIE?
PIE scores Potential, Importance, and Ease. PXL uses more granular questions intended to reduce subjectivity when assigning scores.
Does a high PXL score mean a test will win?
No. PXL prioritizes which hypotheses are stronger candidates to test; it does not predict the result of the experiment.
Does PXL replace conversion research?
No. Research generates and supports test hypotheses; PXL helps decide which of those hypotheses to test first.
Can you customize the PXL framework?
Yes. Add or change criteria when specific business priorities or constraints need to affect test priority.
Improve your A/B tests
If you have lots of test ideas, you need a way to prioritize them. How you prioritize them is important, both for the quality of your tests and optimization as well as the organizational efficiency.
Our PXL model was made to eliminate as much subjectivity as possible while maintaining customizability. Many A/B testing tools come with built-in prioritization features that can help streamline your testing workflow. Check out our guide on the best A/B Testing Tools here.
What should marketers do next?
Prioritization is only one part of a strong experimentation process. You still need good research, sound hypotheses, valid test design, and reliable analysis.
Learn PXL directly from Peep: CXL’s A/B Testing Foundations course covers what to test, the PXL prioritization framework, A/B testing statistics, and testing strategy.
Build a complete experimentation skillset: The Conversion Optimization Minidegree covers conversion research, hypothesis development, experimentation, testing strategy, and CRO program management.
Build AI into your wider marketing systems: The AI Native Marketer program teaches marketers to build working systems around research, analysis, reporting, and measurement.
Related Posts
-

Lots of people on the internet are running a/b tests, can I just copy their winning…
-

As a marketer and optimizer it's only natural to want to speed up your testing…
-

A/B testing is great and very easy to do these days. Tools are getting better…
-

So you ran a test - and you ran it correctly, following A/B testing best…





the new bible; awesome job! a great follow-up blog would be 3 actual implementations of the framework.
Absolutely value-stuffed article. Actually learned 20 new things. thanks!
Only comment is that we know that A/B tests aren’t HUGE revenue drivers… going to try to see if Dynamic Yield clients can use this framework for onsite experiences, instead of just tests
A/B tests CAN be huge revenue drivers, no doubt about it.
I am missing the money-column. Listening to Peep he always gets back to the importance of talking about money. So one column should say something like “can you calculate potential highest/lowest $ ROI on suggested change”?
Because that forces all ideas to be calculated against how we make more money by making this change. And that is often overlooked.
And no, you can’t calculate exact money on anything that is hypothesis, but you should be able to say “these and these KPI:s will be affected and if it is increased by a mere 5% it will give us $XXk”.
Awesome stuff! Some of our customers are now testing the PXL framework in Effective Experiments
Great. I think this could be improved by asking project stakeholders to predict how likely an idea is to lead to a win and incorporating the collective prediction of the crowd. Expert opinion is data and is often part of Bayesian predictive models. You might also take account of any tests out there that have explored something exactly like it or something related. Again, incorporating relevant data – weighted appropriately – from related (not necessarily same) situations has a long history. Also, check out @jlinowski’s framework https://twitter.com/jlinowski/status/778943096406933505 which is predominantly focused on test evidence and crowd opinion.