A/B testing is great and very easy to do these days. Tools are getting better and better. As a result, people rely more and more on the tools. As a result, critical thinking is much less common.
It’s not fair to just blame the tools of course. It’s very human to try to (over)simplify everything. Now the internet is flooded with A/B testing posts and case studies full of bullshit data, imaginary wins. Be wary when you read any testing case study, or whenever you hear someone say “we tested that”.
We’re all learning about A/B testing. It’s like anything else – the more you do it, the better you get at it. So it’s only natural that every optimizer (including myself) has made a ton of testing mistakes in the past. Many mistakes are more common than others, but there’s one that is the most prevalent: ending the test too soon.
Table of contents
- Don’t stop the test just when you reach 95% confidence (or higher)
- Magic numbers don’t exist
- How representative is the traffic in the test?
- Be wary of statistical significance numbers (even if it’s 99%) when the sample size is small
- With low traffic, you need bigger wins to run a test per month, but…
- Without seeing absolute numbers, be very suspicious
- Conclusion
Don’t stop the test just when you reach 95% confidence (or higher)
This is the first rule, and very important. It’s human to scream “yeah!” and want to stop the test, and roll the treatment out live. Many who do discover later (if they bother to check) that even though their test got like +20% uplift, it didn’t have any impact on the business. Because there was no actual lift – it was imaginary.
Consider this: One thousand A/A tests (two identical pages tested against each other) were run.
- 771 experiments out of 1.000 reached 90% significance at some point
- 531 experiments out of 1.000 reached 95% significance at some point
Quote from the experimenter:
This means if you’ve run 1.000 experiments and didn’t control for repeat testing error in any way, a rate of successful positive experiments up to 25% might be explained by a false positive rate. But you’ll see a temporary significant effect in around half of your experiments!
So if you stop your test as soon as you see significance, there’s a 50% chance it’s a complete fluke. A coin toss. Totally kills the idea of testing in the first place.
Once he altered the experiment so that he would pre-determine the needed sample size in advance, only 51 experiments out of 1.000 were significant at 95%. So by checking the sample size, we went from 531 winning tests to 51 winning tests.
How to pre-determine the needed sample size?
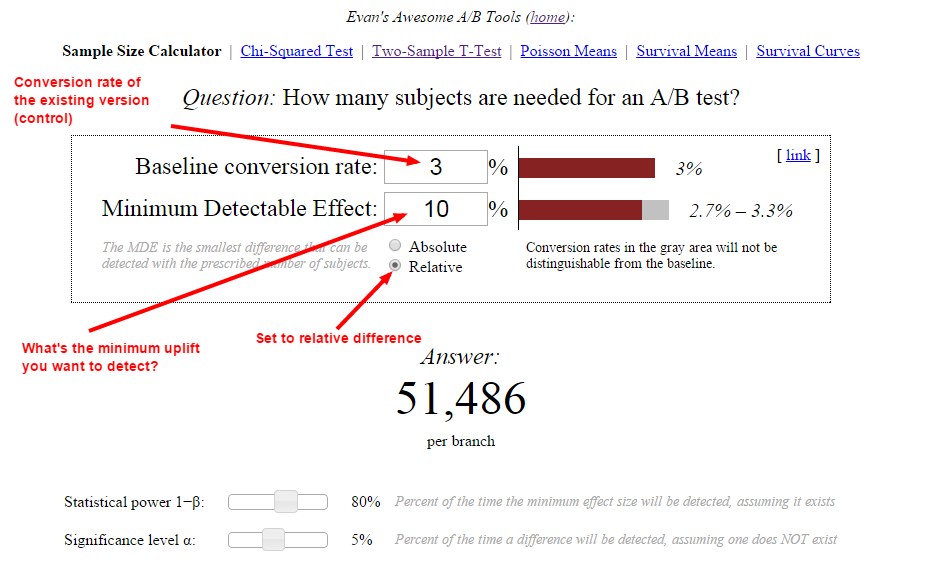
There are many great tools out there for that, like this one. Or here’s how you would do it with Evan Miller’s tool:
In this case, we told the tool that we have a 3% conversion rate, and want to detect at least 10% uplift. The tool tells us that we need 51,486 visitors per variation before can look at the statistical significance levels and statistical power.
Magic numbers don’t exist
What about the rules like X amount of conversions per variation?
Even though you might come across statements like “you need 100 conversions per variation to end the test” – there is no magical traffic or conversion number. It’s slightly more complex than that.

Andrew Anderson, Head of Optimization at Malwarebytes
It is never about how many conversions, it is about having enough data to validate based on representative samples and representative behavior.
100 conversions is possible in only the most remote cases and with an incredibly high delta in behavior, but only if other requirements like behavior over time, consistency, and normal distribution take place. Even then it is has a really high chance of a type I error, false positive.
Anytime you see X number of conversions it is a pretty glaring sign that the person talking doesn’t understand the statistics at all.
And – if 100 conversions was the magic number, then big sites could end their tests just in minutes! That’s silly.
If you have a site that does 100,000 transactions per day, then 100 conversions can’t possibly be a representative of overall traffic.
So this leads to the next thing you need to take into account – representativeness of your sample size.
How representative is the traffic in the test?
By running tests you include a sample of visitors in an experiment. You need to make sure that the sample is representative of your overall, regular traffic. So that the sample would behave just as your real buyers behave.
Some want to suddenly increase the sample size by sending a bunch of atypical traffic to the experiment. If your traffic is low, should you blast your email list, or temporarily buy traffic to get large enough sample size for the test?
No.
In most cases you’d be falling victim to selection effect – you wrongly assume some portion of the traffic represents the totality of the traffic. You might increase conversion for that segment, but don’t confuse that with an increase across segments.
Your test should run for 1 or better yet 2 business cycles, so it includes everything that goes on:
- every day of the week (and tested one week at a time as your daily traffic can vary a lot),
- various different traffic sources (unless you want to personalize the experience for a dedicated source),
- your blog post and newsletter publishing schedule,
- people who visited your site, thought about it, and then came back 10 days later to buy it,
- any external event that might affect purchasing (e.g. payday)
and so on.

Lukas Vermeer, Data Scientist at Booking.com
What matters much, much more than the exact number of visitors in your experiment is the representativeness of the sample, the size of the effect and your initial test intent.
If your sample is not a good representation of your overall traffic, then your results are not either. If your effect size is very large, then you need only a few visitors to detect. If you intended to run your test for a month, and you ran it for a month, and the difference is significant, then it’s frikkin’ significant.
Don’t waste your time looking for magic numbers: this is Science, not magic.
Be wary of statistical significance numbers (even if it’s 99%) when the sample size is small
So you ran a test where B beat A, and it was an impressive lift – perhaps +30%, +50% or even +100%. And then you look at the absolute numbers – and see that the sample size was something like 425 visitors. If B was 100% better, it could be 21 vs 42 conversions.
So when we punch the numbers into a calculator, we can definitely see how this could be significant.
BUT – hold your horses. Calculating statistical significance is an exercise is algebra, it’s not telling you what the reality is.
The thing is that since the sample size is so tiny (only 425 visitors), it’s prone to change dramatically if you keep the experiment going and increase the sample (the lift either vanishes or becomes much smaller, regression toward the mean). I typically ignore test results that have less than 250-350 conversions per variation since I’ve seen time and again that those numbers will change if you keep the test running, and the sample size gets bigger.
Anyone who has experience of running hundreds of tests can tell you that. A lot of the “early wins”disappear as you test longer, and increase the sample size.
I run most of my tests for at least 4 full weeks (even if needed sample size reached much earlier) – unless I get proof first that the numbers stabilize sooner (2 or 3 weeks) for a given site.
With low traffic, you need bigger wins to run a test per month, but…
Many sites have low traffic and low total monthly transaction count. So in order to call a test within 30 days, you need a big lift. Kyle Rush from Optimizely explains it eloquently here.
If you have bigger wins (e.g. +50%), you definitely can get by with smaller sample sizes. But it would be naive to think that smaller sites somehow can get bigger wins more easily than large sites. Everyone wants big wins. So saying “I’m going to swing big” is quite meaningless.
The only true tidbit here is that in order to get a more radical lift, you also need to test a more radical change. You can’t expect a large win when you just change the call to action.
Also, keep in mind: testing is not a must-have, mandatory component of optimization. You can also improve without testing.
Without seeing absolute numbers, be very suspicious
Most A/B testing case studies only publish relative increases. We got a 20% lift! 30% more signups! That’s very good, we want to know the relative difference. But can we trust these claims? Without knowing the absolute numbers, we can’t.
There are many reasons why someone doesn’t want to publish absolute numbers (fear of humiliation, fear of competition, overzealous legal department etc). I get it. There are a lot of case studies I’d like to publish, but my clients won’t allow it.
But the point remains – unless you can see test the duration, total sample size and conversion count per variation, you should remain skeptical. There’s a high chance they didn’t do it right, and the lift is imaginary.
Conclusion
Before you can declare a test “cooked”, you need to make sure there’s adequate sample size and test duration (to ensure good representativeness) before looking at confidence levels.


Ah – nice article and lines up a number of useful and sensible things.
Only thing I would add is that all the figures we look at are median points – the 9.1% vs. 8.2% conversion rate is in fact a range of possibilities. It could be 9.1% but it could also be 9.2% and possibly 9.3%. That’s another reason why you don’t see the promised lift – because it’s a prediction of the range of the lift and the median value is the one people focus on, not the +/- size…
There are loads of similar claims from so called PPC experts when it comes to ad testing… LOOK we increased CTR by 70% and conversions by 100%! We are amazing copy writers!
No. No you aren’t.
I think people would be so much better off if they just ignored all case studies. Saying 90% of them are fake or based on flawed data is probably setting the bar way too low. In most cases I would be shocked if it was even 1% are real.
PPC, Agencies, social, vendors, etc all… are incentived to make their clients think they achieved results, while also incentived to avoid making them go past their comfort zone, leading to so much garbage it is best to just avoid all of that noise. If you can find one that is honest hold on to them forever but assume that they are all lying through their teeth.
Which makes also sites that aggregate those results or people who pretend that awards from those groups mean anything even more hilarious:
http://testingdiscipline.com/2012/05/21/rant-why-whichtestwon-makes-you-a-worse-tester/
Great article… this is a common issue with my clients when it comes to testing.
Everyone wants to call a winner once they see that “95%” stat sig. But, obviously, you can’t do that.
I work with smaller clients, so I try to start with big changes to test (innovative followed by iterative). I don’t even look at stat sig until a campaign meets 3 test minimums:
1500 uniques per variation
100 conversions per variation
2 weeks + a day duration
Once ALL of those are met, then we can LOOK at stat sig and start thinking about what’s happening. Without those minimums, there’s just too many factors, so I don’t even want to share the data with my clients until then.
Of course, I like to see those big wins happen fast so we can move on to the next test, but patience is a big factor in successful testing.
Would be interested to learn what others think.
Great post. A similar article related to testing for price/revenue would be excellent!
Very nice article. It often reminds me of a company I worked in where the marketing expect had 30 conversions as the magic number. I remember telling him that he is basing his conclusions on random changes and it was hard to believe anything said after that statement. I couldn’t agree less with this.
Forgot to ask, what software do you use for your A/B tests?
Do you ever run multivariate tests?
Thank you for your help.
Optimizely or VWO.
Yes.
Hi,
Great article, lot of insights.
How do we calculate sample size if our target is to improve a continuous variable? I understand in the case of conversion but if my variable is the average height of students those who take a protein shake vs. those who don’t.
Thanks,
Suri
Here is my favourite tool for A/B testing. This is the most user friendly tool on the web.
http://www.coreminer.com/calculators/ab-test
Hi Daniel,
Thanks for the response. The core miner tool is helpful to calculate stat sig.
I am looking for a sample size calculator for testing continuous variables (comparing means). I know how to use a t-test for stat sig but I am not sure how to calculate the sample size.
Hi Peep,
Thanks for this super-helpful post!
We are constantly running AB tests to optimize our site and you’ve really helped address some of the questions that come up all the time.
I need a clarification about something you wrote here:
“Be wary of statistical significance numbers (even if it’s 99%) when the sample size is small”.
The way I understand this is that whenever your sample size is small, you have to suspect that you do not have a true representation of the overall traffic. So even though you have reached “statistical significance”, your conclusion does not address the entire audience that your test is relevant for and you might just be seeing outliers.
Is this what you meant? If not, please explain how you could reach statistical significance with a representative group and still not have accurate results?
I also would like to know what the solution to this problem is in your opinion. At what point can you be sure that your sample size is not too small?
The way we approach this is by looking at our traffic and subjectively deciding “what is the smallest group of users that we can be confident includes an accurate representation of the cross-section of all our users?”. But an important caveat here is that this question is always asked in the context of the feature that we are testing. In other words, if we know that only on the weekends we have users whose name starts with the letter “W”, that does not mean that we have to include weekend traffic in the sample, unless we are testing a feature that would appeal differently to users whose name starts with a “W”.
Do you agree with this approach?
Thanks so much,
Yair