A very common scenario: A business runs tens and tens of A/B tests over the course of a year, and many of them “win.” Some tests get you 25% uplift in revenue, or even higher.
Yet when you roll out the change, the revenue doesn’t increase 25%. And 12 months after running all those tests, the conversion rate is still pretty much the same. How come?
The answer is this: Your uplifts were imaginary. There was no uplift to begin with.
Yes, your testing tool said you had a 95% statistical significance level (or higher). Well, that doesn’t mean much. Statistical significance and validity are not the same.
Table of contents
Statistical significance is not a stopping rule.
When your testing says that you’ve reached a 95% or even 99% confidence level, that doesn’t mean that you have a winning variation.
Here’s an example I’ve used before. Two days after starting a test, these were the results:

The variation I built was losing badly—by more than 89% (and no overlap in the margin of error). It says here that Variation 1 has a 0% chance to beat the Control.
Is this a statistically significant result? Yes it is. Punch the same numbers into any A/B test calculator, and they will say the same. Here are the results using this significance calculator:
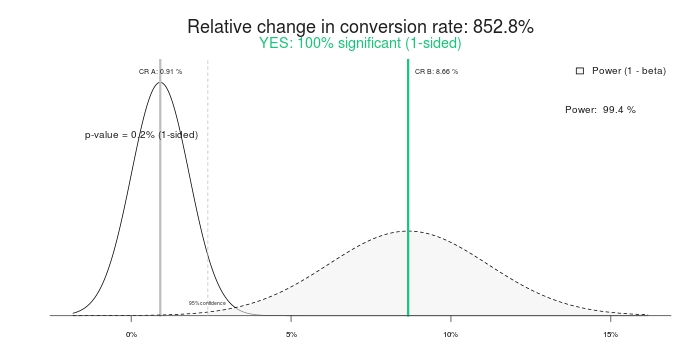
So a 100% significant test, and 852.8% percent uplift (or, rather, the Control is over >800% better that the treatment). Let’s end the test, shall we? Control wins! Or how about we give it some more time instead?
This is what it looked like 10 days later:

That’s right, the variation that had a 0% chance of beating control was now winning with 95% confidence. What’s up with that? How come “100% signficance” and “0% chance of winning” became meaningless? Because they are.
If you end the test early, there’s a great chance that you’ll pick the wrong winner. In this scenario, many (most?) businesses still go ahead and implement the change (i.e. roll out the winning variation to 100% of traffic), while, in fact, the 800% lift becomes zero, or even negative (losing).
Even worse than the imaginary lift is the false confidence that you now have. You think you learned something and go on applying that learning elsewhere on the site. But the learning is actually invalid, thus rendering all your efforts and time a complete waste.
It’s the same with the second test screenshot (10 days in)—even though it says 95% significance, it’s still not “cooked.” The sample is too small; the absolute difference in conversions is just 19 transactions. That can change in a day.

Ton Wesseling has this to say about it:
You should know that stopping a test once it’s significant is deadly sin number 1 in A/B-testing land. Seventy-seven percent of A/A-tests (same page against same page) will reach significance at a certain point.
Learn what significance really is.
Statistical significance alone shouldn’t determine whether you end a test or not. It’s not a stopping rule.
Statistical significance doesn’t tell us the probability that B is better than A. Nor does it tell us the probability that we will make a mistake in selecting B over A.
These are both extraordinarily commons misconceptions, but they’re false. To learn what p-values are really about, read this post.
Run your tests longer.
If you stop your tests after a few days, you’re doing it wrong. It doesn’t matter if you get 10,000 transaction per day. The absolute number of transactions matters, but you also need pure time.

Matt Gershoff from Conductrics explains why:
One of the difficulties with running tests online is that we are not in control of our user cohorts. This can be an issue if the users distribute differently by time and day of week, and even by season. Because of this, we probably want to make sure that we collect our data over any relevant data cycles. That way, our treatments are exposed to a more representative sample of the average user population.
Notice that segmentation doesn’t really get us out of this, since we will need to still sample over the weekdays, weekends, etc., and we probably want to hit each day or day part a couple of times to average out and external events that could be affecting traffic flow/conversion in order to get good estimates of impact time based features/segments on conversion.
I see the following scenario all the time:
- First couple of days: B is winning big. Typically due to the novelty factor.
- After week #1: B winning strong.
- After week #2: B still winning, but the relative difference is smaller.
- After week #4: Regression to the mean—the uplift has disappeared.
So, if you stop the test before four weeks (maybe even after a few days), you think you have a winning variation, but you don’t. If you roll it out live, you have what I call an “imaginary lift.” You think you have a lift because your testing tool showed >25% growth, but you don’t see growth in your bank account.
Run your tests longer. Make sure they include two business cycles, have enough absolute conversions/transactions, and have had enough duration timewise.
Example of an imaginary lift
Here’s a test that we ran for an ecommerce client. The test duration was 35 days, targeted desktop visitors only, and had close to 3,000 transactions per variation.
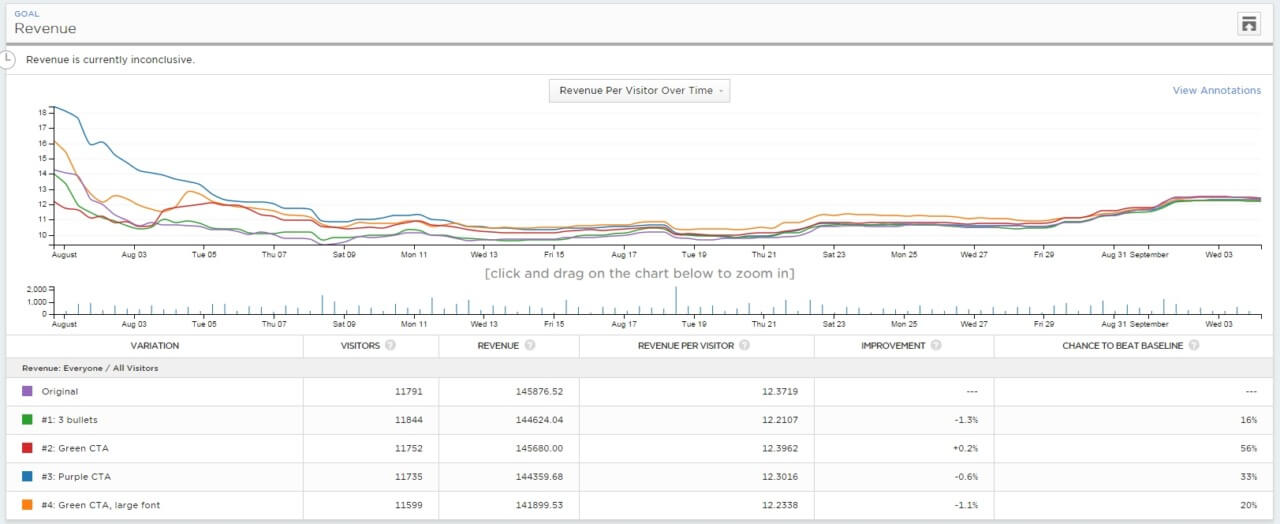
Spoiler: The test ended with “no difference.” Here’s the Optimizely overview for revenue (click to enlarge):
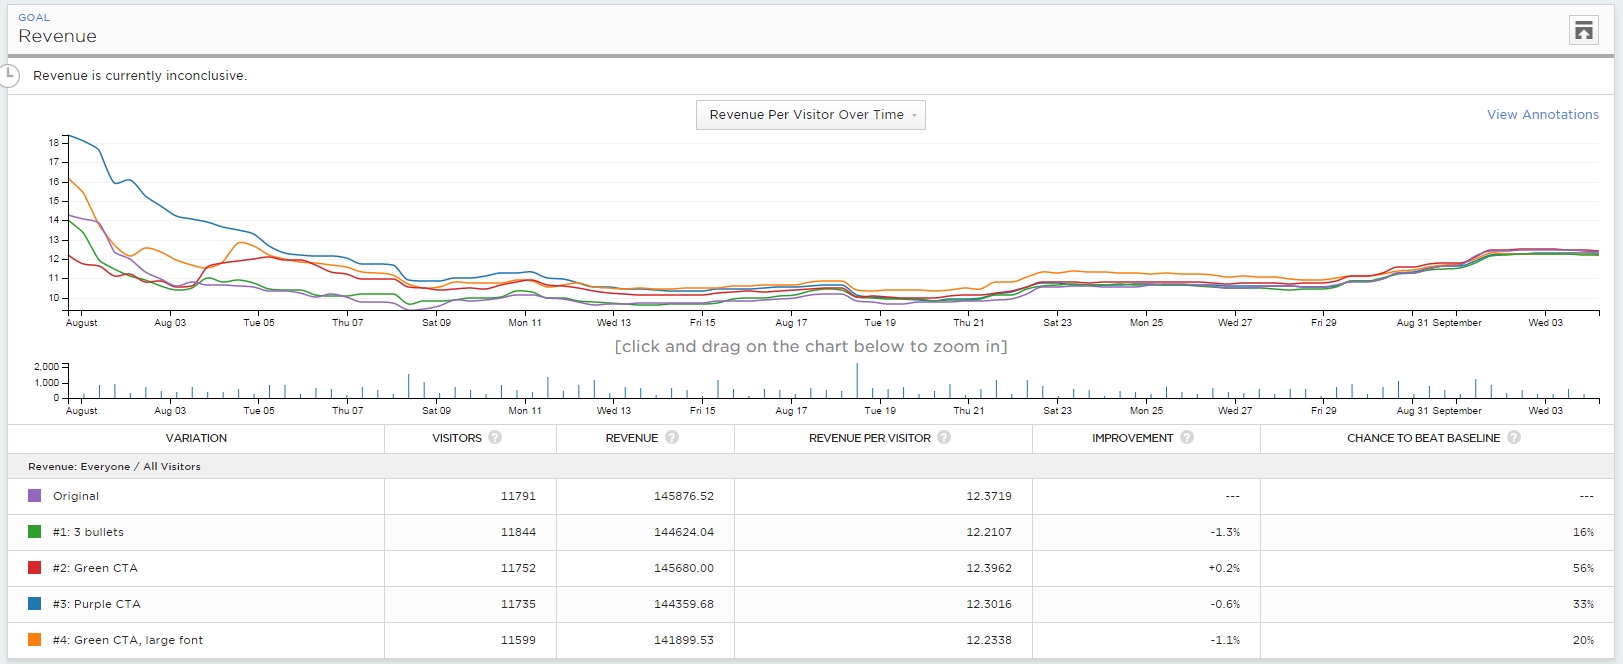
Let’s see now:
- First couple of days: Blue (variation #3) is winning big—like $16 per visitor vs. $12.5 for Control (#Winning!). Many people end the test here (#Fail!).
- After 7 days: Blue still winning, and the relative difference is big.
- After 14 days: Orange (#4) is winning!
- After 21 days: Orange still winning!
- End: No difference.
So, had you run the test for less than four weeks, you would’ve called the winner wrong.
The stopping rules
So, when is a test cooked?
Alas, there is no universal heavenly answer out there, and there are a lot of “it depends” factors. That said, you can have some pretty good stopping rules for most cases.
Here are my stopping rules:
- Test duration of at least 3 weeks (better if 4).
- Minimum pre-calculated sample size reached (using different tools). I will not believe any test that has fewer than 250–400 conversions per variation.
- Statistical significance of at least 95%.
It might be different for some tests because of peculiarities, but in most cases, I adhere to those rules.
Here’s Wesseling chiming in again:
You want to test as long as possible—at least one purchase cycle—the more data, the higher the statistical power of your test!
More traffic means you have a higher chance of recognizing your winner on the significance level you’re testing on! Small changes can make a big impact, but big impacts don’t happen too often—most of the time, your variation is slightly better, so you need a lot of data to notice a significant winner.
But if your tests last and last, people tend to delete their cookies (10% in two weeks). When they return in your test, they can end up in the wrong variation—so, when the weeks pass, your samples pollute more and more and end up with the same conversion rates.
Test for a maximum of 4 weeks.
What if—after three or four weeks—the sample size is less than 400 conversions per variation?
I let the test run longer. If, by 4 weeks time, the sample size isn’t achieved, I add another week.
Always test full weeks. If you start the test on a Monday, it should end on a Sunday. If you don’t test a full week at a time, you might skew your results.
Run a conversions-per-day-of-the-week report on your site. See how much fluctuation there is.
What do you see below? Thursdays make 2X more money than Saturdays and Sundays, and the conversion rate on Thursdays is almost 2X better than on a Saturday.
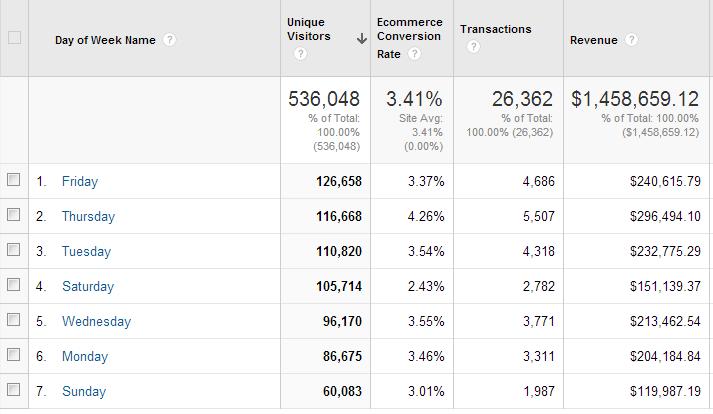
If we didn’t test for full weeks, the results would be inaccurate. Test full weeks at a time.
The same stopping rules apply for each segment.
Segmenting is key to learning from A/B tests. It’s common for B to lose to A in overall results but beat A in certain segments (e.g., Facebook traffic, mobile device users, etc.).
Before you can analyze any segmented data, make sure that you have a large-enough sample size within each segment. So, you need 250–400 conversions per variation within each segment you’re looking at.
I even recommend that you create targeted tests (set target audience/segment in the test configuration) instead of analyzing the results across segments after a test. This ensures that tests aren’t called early, and each segment has adequate sample size.
My friend André Morys said this about his stopping rules:

I always tell people that you need a represantative sample if your data should be valid.
What does “representative” mean? First of all, you need to include all the weekdays and weekends. You need different weather because it impacts buyer behavior. But most importantly, your traffic needs to have all traffic sources, especially newsletter, special campaigns, TV…everything! The longer the test runs, the more insights you get.
We just ran a test for a big fashion retailer in the middle of the summer sale phase. It was very interesting to see how the results dramatically dropped during the “hard sale phase” with 70% and more—but recovered one week after the phase ended. We would never have learned this if the test hadn’t run for nearly four weeks.
Our “rule of thumb” is this: 3,000–4,000 conversions per variation and 3–4 week test duration. That is enough traffic so we can even talk about valid data if we drill down into segments.
Testing “sin” number 1: Searching for uplifts within segments when you have no statistical validity (e.g., 85 vs. 97 conversions). That’s bullshit.
Learning from tests is super important—even more than getting wins. And segmenting your test data is one of the better ways to learn. Just make sure your segments have enough data before you jump to conclusions.
Conclusion
Just because your test hits 95% significance level or higher, don’t stop the test. Pay attention to the absolute number of conversions per variation and test duration as well.
Related Posts
-

I wrote this short rant. Isn't it fun? It's totally cool! Yes, it's that easy!…
-

Don't design your own website. No, really. It will suck. You might think that since…
-

While running A/B tests on all your traffic at once is often tempting, it's best to…
-
As optimizers and business owners, you're striving to better understand your audience. Who visits your site?…


Hi Pepe, similar experience here, when our test was winning on the following day by 87% at 100% validity, as the site had tons of visitors, but after 4 weeks of running it dropped to 10.49% ‘only’, i.e -731.74% drop. http://www.proimpact7.com/ecommerce-blog/consequences-of-ending-your-test-too-soon/
I am very surprised at the difference in conversion rates between Thursday, Saturday and Sunday. That is a very significant difference in change. As always I read your post and find it extremely informative. Snatched the conversion per day and week report. Appreciate it.
Hi Peep –
I’m usually a fan of your posts but I am honestly puzzled at this one.
Determining how long to run a test for to get statistically valid results is easy and certainly not a “gut-feel” type of decision: you have to run it until you achieve the minimum sample size for the results you are actually getting during the test.
This sample size depends on the traffic tested, the number of variations tested, baseline conversion rate and performance differential between your variations and the control: there are no correct rules such as wait 3 weeks, 4000 conversions or whatever else criteria you want to use. You have to calculate it for each test.
All the testing platforms provide simple sample size calculators and Evan Miller’s one is a very easy one to use: http://www.evanmiller.org/ab-testing/sample-size.html
In my CRO practice, I provide each client with a test report before each test that show them how long, in days and according to their traffic, a test will need to run for according to a range of performance targets. That’s also part of my test planning: if a test on a low-traffic landing page needs to run for 3 months to complete with a performance improvement of 20%, then there are most probably better tests to run!
– Julien
Hey Julien
Sample size – this is what the calculators give you – is really just a bit of algebra around the t-test.
It’s not a heavenly rule created by Buddha, Jesus or Allah. It’s a formula – and that’s how we should approach it. It doesn’t really account for the fact that you don’t control your user cohorts.
For some high-traffic sites you would get the needed sample size in a day or two. But that is not a representative sample – it does not include a full business cycle, all week days, weekends, phase of the moon, various traffic sources, your blog publishing and email newsletter schedule and all other variables.
So for a valid test both conditions – adequate sample size + long enough time to include all factors (full business cycle, better yet 2 cycles) – should be met. There’s no penalty for collecting more data, so if you end up with a larger sample size than what the calculator told you, so be it.
And then there’s the issue of segmentation – if you want to conduct post-test analysis and segmentation, you need to make sure there’s enough data in each segment as well.
Hi Peep –
I didn’t say you should ignore the business cycles!
Yes, you should absolutely continue the tests so that they cover a full business cycle at a minimum and often 2 full business cycles. If you reach the required minimum sample size but haven’t covered 1 or 2 full business cycles, then you should continue testing.
But you should only stop a test when you have both:
1) tested over 1 or 2 full business cycles
2) reached the minimum sample size for statistical validity
The shortcuts like wait until x weeks or y number of conversions, even if you test over a ful business cycle, are wildly innacurate shortcuts that undermine the reliability of the test results.
Statistical validity of numerous split tests can be called into questions on several dimensions, no need to take shortcuts with the basic rules of statistics to undermine these tests even more :-)
– Julien
You are saying exactly what I said in my comment!:)
Now, as experience shows, typical business cycle is 1-2 weeks, so a 3-4 week test period is ideal in most cases, and less than 2 weeks is not.
When it comes to sample sizes, 250-400 conversions per variation is the typical ballpark you get on most sites when you calculate the needed sample size. Of course this depends on the size of the impact, and so forth.
If I see a test with less total conversions than that, it’s highly likely that it’s not valid.
So the numbers quoted are ballparks for the mindset. Better have too much data than too little. Always beware of small sample size.
Sometimes it’s worth being brave and retesting past successes in order to sanity check the numbers, of course they may fluctuate due to seasonal trends and differences but well worth it – you should learn something whatever the results.
For one particular client we matched departmental sales trends on their ecommerce site against wind direction, temperature and precipitation which can take you one step further down the testing process instead of trying to wait for differences in weather during the test.
Rob
I agree about re-testing stuff.
Great post Peep. Loved it.
I will keep the 3 weeks rule in mind for future tests. Great point also about users deleting their cookies resulting in cross-over in the sample over time.
Keep rocking,
Etienne
Hi, great article. Can you explain what a business cycle / purchase cycle is? How do you determine what they are for a site?
Thanks all
Xx
It’s how long it takes for someone to see your offer, and to buy it.
The more expensive and/or complicated the product, the longer it is. If you have no data on your actual purchase cycle, assume 1 or 2 weeks.
So, can we say that if we try new variations regularly, we can take the advantage of “novelty factor” and increase conversion rates in total? :)
Not really. That’s a stupid approach. Figure out actual problems on your site, and fix them.
Is there a certain amount of traffic *per day* which is viewed viewed as a necessary minimum for validity? This is an extreme example: If a known current conversion rate is 2%, but a test is getting less than 50 visits per day due to it being very narrow in scope, then 2% of less than 50 is still 0…
Per day is the wrong way to look at it, you need to look at the whole test.
What matters much, much more than the exact number of visitors in your experiment is the representativeness of the sample, the size of the effect and your initial test intent.
If your sample is not a good representation of your overall traffic, then your results are not either. If your effect size is very large (+30% uplift), then you need only a few visitors to detect.
With a representative sample, a large effect size and a predetermined experiment runtime (e.g. 4 weeks), you can run experiments at small scale just fine.
Excellent article. I will be going through a feew
of these issxues as well..
But ‘why’? I get that running it for a longer period of time will make it more reliable, and I have seen many experiments get 99% significance early on. But WHY is this not trustworthy? Doesn’t confidence say exactly that with the given sample size (which will be very small in the beginning), and normally distributed data, 99% of observations should fall within this particular range (which will be very wide with a small sample size) if the null hypothesis true (i.e. the new variation has the same conversion rate as the original). The sample size will be factored in in the size of the confidence interval, so why isn’t 99% significance reliable in the beginning? If even with few observations I’m seeing a difference that is so enormously extreme that I only have a 1% of observing it if the conversion rates were the same, doesn’t that mean by definition that it’s 99% valid?? Thanks…
It doesn’t take the sample size into calculation. So you calculate the needed sample size ahead of time yourself, and ignore significance numbers until the sample is reached. Only then the p-value will be useful.
Hello from sunny Wroclaw Peep ☕️
Would you say it’s time to update the quote “But if your tests last and last, people tend to delete their cookies (10% in two weeks)” since ITP2 is messing with cookies after day 7 impacting variants overlap?
I’ve been fighting this battle. While working with another CRO agency for a leading niche US Shopify Plus, they already do not recommend running a test for more than 7 days.
This is nuts and contradicts a lot all we talk about when it comes to sample size definition, but in that eComm we had ~46% iOS traffic.
I’ve been asking around people’s thoughts about it. Is it time to fully move to Bayesian models and deal with 7 day testing or moving cookies to server side in this uphill cookie battle?
All the best and keep safe,
PJ :)