You may have heard that Google recently announced that Universal Analytics was officially out of beta.
But what does that mean & more importantly, how can you take advantage of Universal Analytics to improve your business?
Let’s start with the basics.
You don’t need to run out and upgrade to Universal Analytics right now, but it should be on your roadmap.
Universal Analytics is Google Analytics. This means that all new features will be developed for Universal Analytics. If you love cool new features you’ll want to upgrade.
The rollout of Universal Analytics means that all features previously available in Google Analytics are now available in Universal Analytics.
This includes
- Content experiments
- Audience data (ie demographic data)
- Remarketing
- and others
What makes these features so exciting is that they are fully compatible with each other, across multiple sites (useful if you run a network of related sites) and on multiple devices.
At the heart of Universal Analytics is one very unique feature – the User-ID.
There has been a lot of discussion around this feature, so let’s discuss it in a bit more detail.
Table of contents
How User-ID works
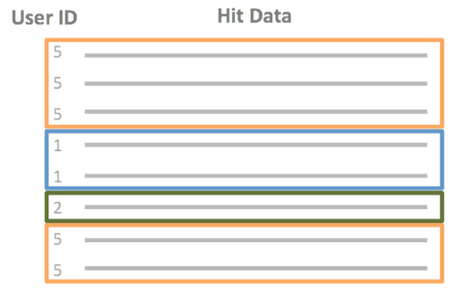
The User-ID features allows a business to use their own user identifier in Google Analytics.
The User-ID can be sent to Google Analytics from any digital experience – a website, a mobile app (iOS or Android) or some other digital experience. As long as you can send the data to Google Analytics, you can include your own User-ID.
When Google Analytics processes the data it will use your User-ID to identify unique users across all of the platforms that generate data and de-duplicate user data from multiple devices that have the same User-ID value.
The result is a more accurate measure of the actual number of users that engage with your business regardless of where the interaction occurs.
To implement the User-ID feature you must provide your own customer or User-ID value – this is typically done with a Client Relationship Management system.
A typical authentication system will then produce a value that can be sent to Google Analytics.
But to implement the User-ID it might be best to work with your development team (if you have one). You can read all about the implementation process in the Google Analytics Developer docs.
But how will Universal Analytics – and the User-ID – help generate actionable data for your business?
It’s all about understanding user behavior.
The Value of Cross Device Measurement
Analytics is about understanding how people behave.
The idea is that if we understand good (or profitable) behavior we can promote it. Likewise, if we understand negative (or not profitable) behavior we can try to reduce or eliminate them.
In today’s digital environment users can interact with a business in many, many different ways due to the large number of devices.
This means their behavior, and subsequent digital data, is split into silos (ie different measurement tools) or is inaccurate due to the complexities of measuring users across devices. But, using the User-ID feature you can more accurately measure the behavior of a user as they span multiple devices.
You may be saying, “We’re only measuring users that have authenticated with my business. What about all of the other users of my site?” But this is a valuable segment of users that is critical to study.
For one reason or another they’ve decided to create an account with your business.
Understand these users will help you create new tactics to create more users that fit the profile.
When used intelligently, this can be used on every level of your marketing strategy from acquisition to retention to referrals.
Remember, because cross device reporting provides data for users that have authenticated with your company, you’re able to see how people’s behavior changes from device to device, which can help you optimize the overall customer experience, not just on a page by page basis.
An Example – Image-O
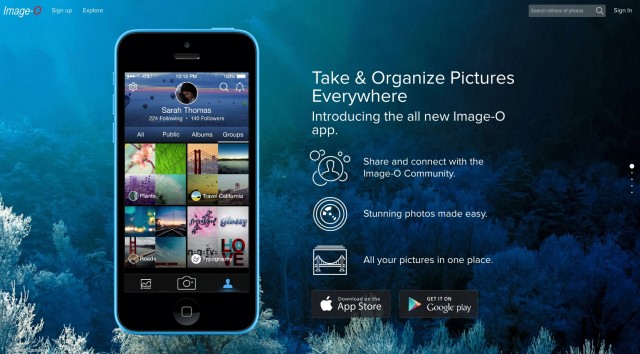
To make this all a bit more real let’s discuss an analytics implementation for a fictional SaaS (Software as a Service) company called Image-O.
This company let’s users take and organize pictures. They can use the service on any device, including desktops, laptops, mobile phones and tablets. The service runs on the desktop in the browser but also as an app on mobile devices.
To help drive more downloads of the app the company has been running a number of marketing campaigns on different platforms including:
- Paid Search
- Display ads
- In-app ads
Again, all marketing on multiple platforms.
To drive subscriptions the company offers a one-month free trial.
Users can create an account, free of charge, and then use the service for 30 days. At the end of the 30 days (and hopefully after a good email onboarding process) their trial will end unless they choose a new paid plan.
The company has been using Google Analytics to measure the performance of their service on the website. They’re using ecommerce tracking to measure revenue and sales, and they’re using Goals to measure a number of macro and micro conversions.
But now they want to simplify their data collection in one platform that supports user-centric measurement. Plus they want to give more employees access to the data.
Ultimately they want to gain a better understanding of how the user experience on each devices changes the behavior of their users on other devices.
- Do users perform certain activities on one device?
- Do they start a task on one device and then complete the task on another device?
- What percentage of their overall user-base signs in across multiple devices
- What devices are they using?
They also want a simple way to combine all of the data in one system that anyone can use (sales, marketing, analysts, etc.)
Let’s look at three ways that our fictional company can use cross device data to gain insights:
Finding Insights
User-ID Coverage
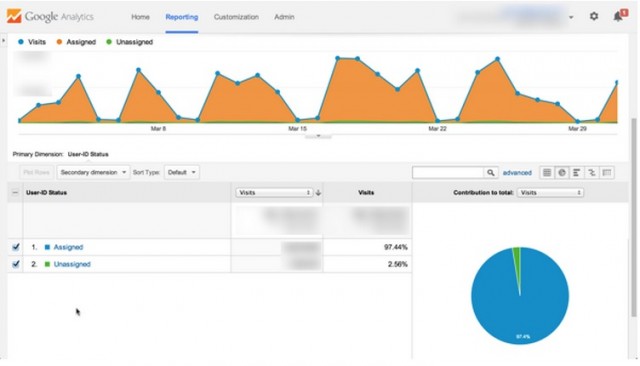
The first insight you can draw from using the User-ID feature is what percentage of users are authenticated?
This simple report helps you understand what percentage of sessions are generated from users that have logged in.
Insight: When looking at this report, Image-O sees the orange shaded area which represents “No User-ID” and can very quickly grasp how few website users and app users are actually signed in to their service.
While they got a healthy number of trial signups, and have a strong user-base, they were surprised to see such a small percentage of website users signed in.
From here, Image-O might build a campaign that explains the benefits of logging-in to a registered user OR if they find there’s little incentive for logging in, use basic customer development techniques to find better reasons for registered users to want to sign into their account.
This report is also useful when diving deeper into cross-device analysis.
You want to know if you are analyzing 10% of users or 60% of users. Keep in mind that the amount of authenticated users can, and will, vary greatly depending on your business model and your different digital experiences. But this is still important information to understand.
Device Overlap Report
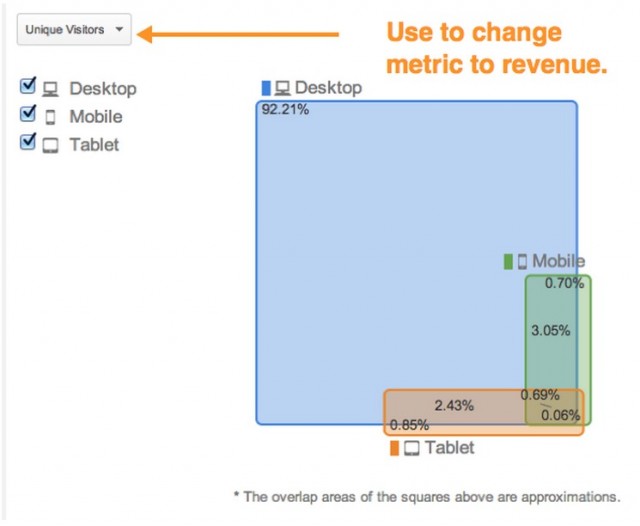
While the User-ID coverage report shows what percentage of users are authenticated, the Device overlap report shows the device combinations for these users.
Not only does it show a the absolute number of users for each device combination, but it can also help you understand the impact on revenue.
Insight: Now that Image-O has all of their data in a single system, they want to understand which devices users prefer.
While this data was previously available in different analytics systems before, they had difficulty de-duplicating users. Now they can see that most users are on XXXXX and YYYYY.
Remember, one of the most important pieces of context is the user experience on each device. That’s something that is completely unique to your business.
In the case of Image-O, they know that users take a lot of photos on their mobile devices. But they can also see that users spend a lot of time on desktop – presumably due to the ease of organizing and editing in the desktop app.
But this report can also help Image-O understand the breakdown of revenue rather than just the count of users. This is really handy as it helps them better understand which combination of devices lead to more profitable customers.
But how can they use that data?
Well, let’s say Image-O’s most profitable segment are the users who use all three devices, but that segment isn’t particularly large… yet.
They might:
1. Run a broad email campaign that alerts users of the benefits of using the device on multiple platforms.
2. Send periodic triggered emails to users who haven’t used multiple devices within a certain time period
3. Experiment with an “in-app” message campaign that shows the benefits of cross device usage.
This is just a small sampling of what they might do, but without digging deeper to understand _why_ it’s happening, these marketing plans would be pretty uninformed.
Device Paths Report
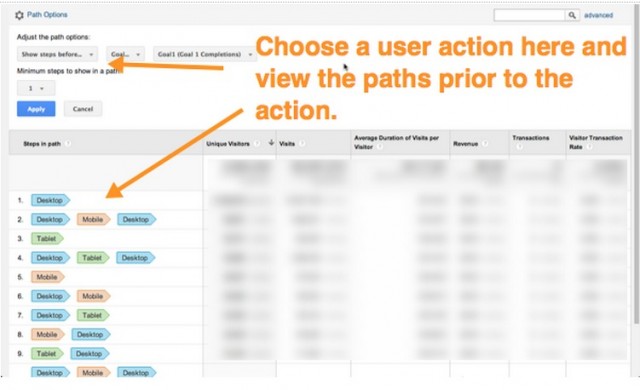
Finally we have information about device paths. This report can help you analyze the devices used before, or after, almost any user event. This includes transactions, goal conversion, pageview or any other event.
I like to use this report to understand the user behavior before and after some type of activity. For example, do they spend a significant amount of time on one device and then switch before performing an activity? If so, why?
Again, it’s important to keep in mind what you expect to happen vs. what you actually see in the report.
Image-O wants to understand what happens before and after a user creates a trial account.
They can customize the Device path report to show the steps prior to signing up for a free trial. They might want to understand if the user is solely using a tablet, but then choosing to use the desktop to choose an account.
Perhaps Image-O can work on the account upgrade flow to optimize the experience on a single device.
Likewise I can look at the steps after a goal conversion (or transaction) – like signing up for a paid-account after my trial ends. Is there a certain device that drives more signups and revenue? Again, these reports do not explain why things happen, they explain what happened. But by using the context of your specific business you can better understand what the data means.
I hope this post helps everyone understand the business side of Universal Analytics and how it can help you evolve your digital measurement strategy.






Not surprised that this has not got more comments Justin.
Whilst people are more concerned with easy to do ways of getting more traffic and converting, data analysing is laborious and difficult to grasp for the average Joe.
I certainly see the merit in User-ID and maybe Google sees that the benefit in the future is to ‘get people registered’ one way or another to be able to achieve better conversion.
Thanks for the explanation and I look for to seeing where this best fits for our business.
Just saw the video on your website. This clears up if a unique ID is assigned to individual users without the need for a ‘sign in’
Azzam
Hi Justin,
I’ve been across Universal Analytics for a while and am excited by the new functionality being offered by Google.
Thanks for a practical explanation into some of the reports, it’s a great starting point.
Regards,
Kevin
Hi Justin good reading but do business people have time for all these lengthy set-ups? We here in New Zealand have developed analytics which is much more user friendly and cost effective. It’s plug and play.
Love your work and would greatly appreciate your input once you have had a chance to go through our video and info.
Justin
excellent. I love the idea of userIds. But I have to say, some things seem missing in my GA views. I don’t see the userID coverage view. And I don’t see how I can filter accesses by userID so I can see exactly what page user 1 looked at! Help…
Hi,
Can anybody help me?
How to create userid for an user without authentication?