A/B testing is a controlled experiment that compares a control with one or more variations to determine how a change affects a defined outcome. Traffic is randomly allocated between variations, often evenly, although a 50/50 split is not required.
A reliable A/B test starts with a clear hypothesis, sufficient sample size, predefined success metrics, and a valid stopping rule. The goal is not simply to find a “winner,” but to reduce uncertainty and learn which changes improve customer and business outcomes.
This guide covers how to research and prioritize test ideas, determine how long a test should run, set up experiments correctly, interpret results, and build those learnings into an ongoing experimentation program.
TL;DR
- A/B testing compares a control with one or more variations to measure whether a change affects a defined outcome.
- Start with research, not random test ideas. Use analytics, user research, qualitative feedback, and behavioral data to identify genuine problems.
- Define your hypothesis, primary metric, sample size, and stopping rule before launching.
- Do not stop a fixed-horizon experiment simply because it briefly reaches statistical significance.
- Statistical significance is not the same as business significance. Consider effect size, uncertainty, guardrail metrics, and the cost of implementing the change.
- Segment results carefully. Segment-level findings require enough data and can create false positives when you examine too many groups after the test.
- Archive every experiment. Wins, losses, and inconclusive tests all create knowledge that can improve future decisions.
Table of contents
- What is A/B testing?
- How to improve A/B test results
- How to prioritize A/B test hypotheses
- How long should you run A/B tests?
- How to set up A/B tests
- How to analyze A/B test results
- How to archive past A/B tests
- A/B testing statistics
- How to do A/B testing: tools and resources
What is A/B testing?
A/B testing, also known as split testing, is an experimentation process where two variants (A and B) are compared to determine which variable performs better. This allows businesses to make informed decisions about changes that lead to outcomes like improved conversion rates and user experience.
When researchers test the efficacy of new drugs, they use a “split test.” In fact, most research experiments could be considered a “split test,” complete with a hypothesis, a control, a variation, and a statistically calculated result.
In a simple A/B test, users are randomly assigned to the original experience or a variation. Traffic is often divided 50/50, but other allocations can be used depending on the experiment design:
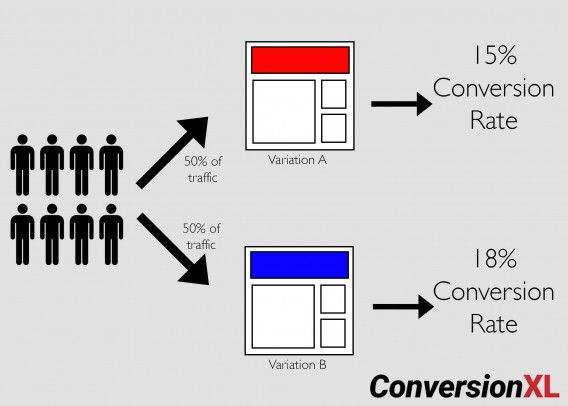
This example uses an equal 50/50 traffic split between the control and variation.
For conversion optimization, the main difference is the variability of internet traffic. In a lab, it’s easier to control for external variables. Online, you can mitigate them, but it’s difficult to create a purely controlled test.
In addition, testing new drugs, for example, requires an almost certain degree of accuracy. Lives are on the line. In technical terms, your period of “exploration” can be much longer, as you want to be 100% sure that you don’t commit a Type I error (false positive).
Online, the process for A/B split-testing considers business goals. It weighs risk vs. reward, exploration vs. exploitation, and science vs. business. Therefore, we view results through a different lens and make decisions differently than those running tests in a lab.
You can, of course, create more than two variations. Tests with more than two variations are known as A/B/n tests. If you have enough traffic, you can test as many variations as you like. Here’s an example of an A/B/C/D test and how much traffic each variation is allocated:
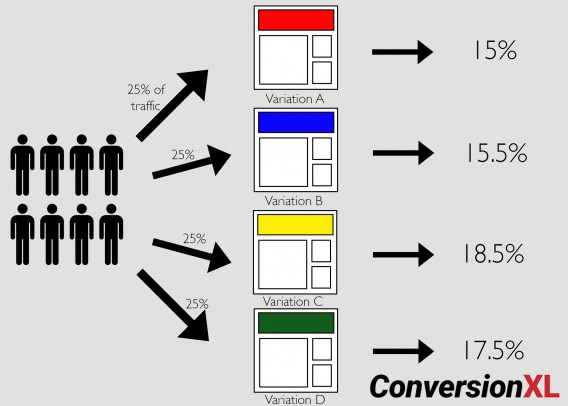
An A/B/n test compares a control with multiple variations. Traffic can be divided equally between them or allocated differently according to the experiment design.
A/B/n tests are great for implementing more variations of the same hypothesis, but they require more traffic because they split it among more pages.
A/B tests, while the most popular, are just one type of online experiment. You can also run multivariate and bandit tests.
A/B testing, multivariate testing, and bandit algorithms: What’s the difference?
A/B/n tests are controlled experiments that run one or more variations against the original page. Results compare conversion rates among the variations based on a single change.
Multivariate tests test multiple versions of a page to isolate which attributes cause the largest impact. In other words, multivariate tests are like A/B/n tests in that they test an original against variations, but each variation contains different design elements. For example:
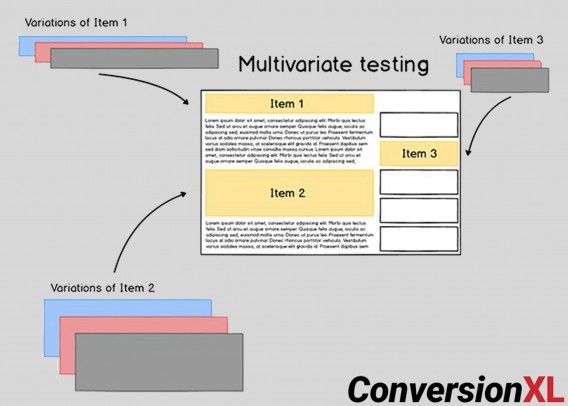
Each element has a specific impact and use case to help you get the most out of your site. Here’s how:
- Use A/B testing to determine the best layouts.
- Use multivariate tests to polish layouts and ensure all elements interact well together.
You need to drive a ton of traffic to the page you’re testing before even considering multivariate testing. But if you have enough traffic, you should use both types of tests in your optimization program.
Simple A/B testing remains the dominant experiment format. Optimizely’s 2026 analysis of 173,000 production experiments found that around three-quarters were still simple A/B tests. However, multi-variation experiments generated up to 1.7× more average test impact, showing that additional variations can be valuable when traffic and experiment design support them.
Bandit algorithms are A/B/n tests that update in real time based on the performance of each variation.
In essence, a bandit algorithm starts by sending traffic to two (or more) pages: the original and the variation(s). Then, to “pull the winning slot machine arm more often,” the algorithm updates based on which variation is “winning.” Eventually, the algorithm fully exploits the best option:

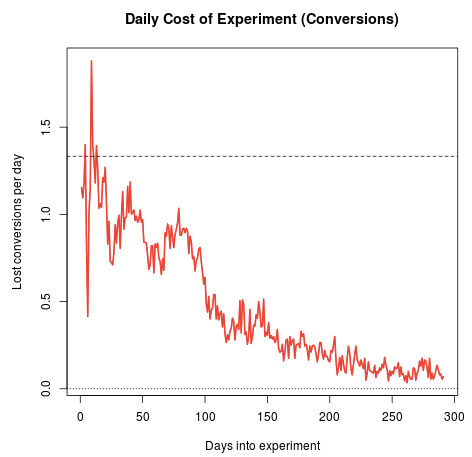
One benefit of bandit testing is that bandits mitigate “regret,” which is the lost conversion opportunity you experience while testing a potentially worse variation. This chart from Google explains that very well:
Bandits and A/B/n tests each have a purpose. In general, bandits are great for:
- Headlines and short-term campaigns;
- Automation for scale;
- Targeting;
- Blending optimization with attribution.
No matter what type of test you run, it’s important to have a process that improves your chances of success. This means running more tests, winning more tests, and making bigger lifts.
How to improve A/B test results
Improving A/B test results starts with better research and experiment design: test meaningful hypotheses, choose appropriate metrics, define the analysis and stopping rule in advance, and make sure the experiment has enough traffic to detect the effect you care about.
Recent data reinforces the importance of experiment quality over simply running more tests. Optimizely’s 2026 analysis found that well-designed experiments produced a 58% win rate compared with 35% for poorly configured experiments.
The same analysis found that audience-targeted experiments generated 17.4% higher average test impact within their targeted audiences, while 43% of experiments still focused on the bottom of the funnel despite some less commonly tested metrics producing greater impact.
These figures come from Optimizely customers, so they should not be treated as universal benchmarks. They do show why experiment setup, targeting, metric selection, and hypothesis quality matter as much as test volume.
Those without a structured approach stay in what Gartner calls the “Trough of Disillusionment.” (Unless their results are littered with false positives, which we’ll get into later.)
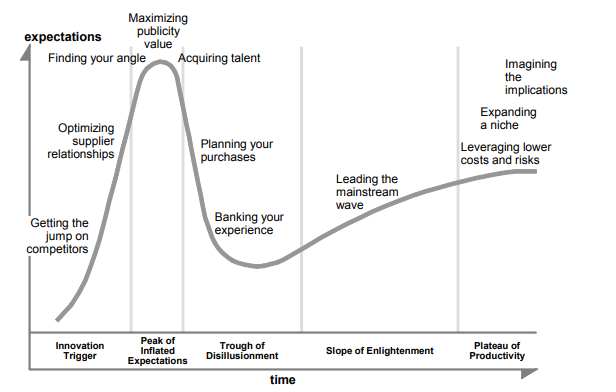
Below is an example of how this can be applied to emerging technologies.

Craig Sullivan has a humorous take on Gartner’s Hype Cycle as it relates to experimentation in business.
To simplify a winning process, the structure goes something like this:
- Research;
- Prioritization;
- Experimentation;
- Analyze, learn, repeat.
Research: Getting data-driven insights
To begin optimization, you need to know what your users are doing and why.
Before you think about optimization and testing, however, solidify your high-level strategy and move down from there. So, think in this order:
- Define your business objectives.
- Define your website goals.
- Define your Key Performance Indicators.
- Define your target metrics.

Once you know where you want to go, you can collect the data necessary to get there. To do this, we recommend the ResearchXL Framework.
Here’s the executive summary of the process we use at CXL:
- Heuristic analysis;
- Technical analysis;
- Web analytics analysis;
- Mouse-tracking analysis;
- Qualitative surveys;
- User testing and copy testing.
Heuristic analysis is about as close as we get to “best practices.” Even after years of experience, you still can’t tell exactly what will work. But you can identify opportunity areas. As Craig Sullivan puts it:
My experience in observing and fixing things: These patterns do make me a better diagnostician, but they don’t function as truths—they guide and inform my work, but they don’t provide guarantees.
Craig Sullivan
Humility is crucial. It also helps to have a framework. When doing heuristic analysis, we assess each page based on the following:
- Relevancy;
- Clarity;
- Value;
- Friction;
- Distraction.
Technical analysis is an often-overlooked area. Bugs—if they’re around—are a conversion killer. You may think your site works perfectly in terms of user experience and functionality. But does it work equally well with every browser and device? Probably not.
This is a low-hanging—and highly profitable—fruit. So, start by:
- Conducting cross-browser and cross-device testing;
- Doing a speed analysis.
Web analytics analysis is next. First thing’s first: Make sure everything is working. (You’d be surprised by how many analytics setups are broken.)
Google Analytics 4 is a course in itself, so I’ll leave you with some helpful links:
- All You Need to Know About Google Analytics 4 (A Complete Guide to GA4);
- Introduction to Google Analytics 4;
- Become a Google Analytics 4 expert;
- Become Great at GA4 Implementation;
- Become great at GA4 audits;
- Master tracking and attribution in Google Analytics 4..
Next is mouse-tracking analysis, which includes heat maps, scroll maps, click maps, form analytics, and user session replays. Don’t get carried away with pretty visualizations of click maps. Make sure you’re informing your larger goals with this step.
Qualitative research tells you why quantitative analysis fails. Many people think that qualitative analysis is “softer” or easier than quantitative analysis, but it should be just as rigorous and can provide insights as important as those from analytics.
For qualitative research, use things like:
- On-site surveys;
- Customer surveys;
- Customer interviews and focus groups.
Finally, there’s user testing. The premise is simple: Observe how actual people use and interact with your website while they narrate their thought processes aloud. Pay attention to what they say and what they experience.
With copy testing, you learn how your actual target audience perceives the copy, what is clear or unclear, and what arguments they care about or not. Wynter is a great tool for this.
After thorough conversion research, you’ll have lots of data. The next step is to prioritize that data for testing.
How to prioritize A/B test hypotheses
Prioritize A/B test hypotheses using evidence, potential business impact, and implementation effort. Research-backed opportunities with meaningful upside should generally rank above speculative changes that are easy to build but weakly supported.
There are many frameworks to prioritize your A/B tests, and you could even innovate with your own formula. Here’s a way to prioritize work shared by Craig Sullivan.
Once you go through all six steps, you will find issues—some severe, some minor. Allocate every finding into one of five buckets:
- Test. This bucket is where you place stuff for testing.
- Instrument. This can involve fixing, adding, or improving tag/event handling in analytics.
- Hypothesize. This is where you’ve found a page, widget, or process that’s not working well but doesn’t reveal a clear solution.
- Just Do It. Here’s the bucket for no-brainers. Just do it.
- Investigate. If an item is in this bucket, you need to ask questions or dig deeper.
Rank each issue from 1 to 5 stars (1 = minor, 5 = critical). There are two criteria that are more important than others when giving a score:
- Ease of implementation (time/complexity/risk). Sometimes, data tells you to build a feature that will take months to develop. Don’t start there.
- Opportunity. Score issues subjectively based on how big a lift or change they may generate.
Create a spreadsheet with all of your data. You’ll have a prioritized testing roadmap.
We created our own prioritization model to weed out subjectivity (as possible). It’s predicated on the need to bring data to the table. It’s called PXL and looks like this:
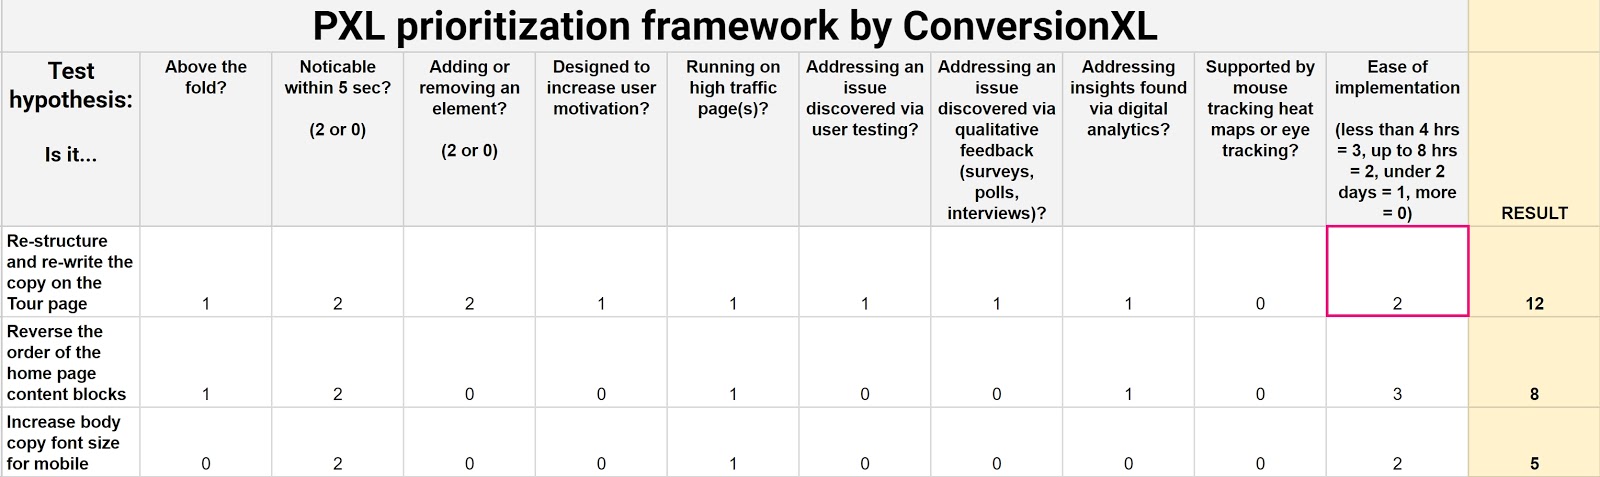
Grab your own copy of this spreadsheet template here. Just click File > Make a Copy to make it your own.
Instead of guessing what the impact might be, this framework asks you a set of questions about it:
- Is the change above the fold? More people notice above-the-fold changes. Therefore, those changes are more likely to have an impact.
- Is the change noticeable in under 5 seconds? Show a group of people the control and then the variation(s). Can they tell the difference after 5 seconds? If not, it’s likely to have less of an impact.
- Does it add or remove anything? Bigger changes like removing distractions or adding key information tend to have more of an impact.
- Does the test run on high-traffic pages? An improvement to a high-traffic page generates bigger returns.
Many potential test variables require data to prioritize your hypotheses. Weekly discussions that ask these four questions will help you prioritize testing based on data, not opinions:
- Is it addressing an issue discovered via user testing?
- Is it addressing an issue discovered via qualitative feedback (surveys, polls, interviews)?
- Is the hypothesis supported by mouse tracking, heat maps, or eye tracking?
- Is it addressing insights found via digital analytics?
We also put bounds on ease of implementation by bracketing answers according to the estimated time. Ideally, a test developer is part of prioritization discussions.
Grading PXL
We assume a binary scale: You have to choose one or the other. So, for most variables (unless otherwise noted), you choose either a 0 or a 1.
But we also want to weigh variables based on importance—how noticeable the change is, if something is added/removed, ease of implementation. For these variables, we specifically say how things change. For instance, on the Noticeability of the Change variable, you either mark it a 2 or a 0.
Customizability
We built this model with the belief that you can and should customize variables based on what matters to your business.
For example, maybe you’re working with a branding or user experience team, and hypotheses must conform to brand guidelines. Add it as a variable.
Maybe you’re at a startup whose acquisition engine is fueled by SEO. Maybe your funding depends on that stream of customers. Add a category like “doesn’t interfere with SEO,” which might alter some headline or copy tests.
All organizations operate under different assumptions. Customizing the template can account for them and optimize your optimization program.
Whichever framework you use, make it systematic and understandable to anyone on the team, as well as stakeholders.
How long should you run A/B tests?
Run an A/B test until it meets the sample-size, duration, and stopping criteria defined before the experiment begins. The correct duration depends on baseline performance, minimum detectable effect, traffic, statistical power, and the statistical method your experimentation platform uses.
Do not stop a fixed-horizon test simply because the result crosses a significance threshold. Repeatedly checking a conventional fixed-horizon test and stopping when the result looks significant increases the risk of false positives.
Instead, define your sample size, minimum detectable effect, statistical power, and stopping rule before launch.
Modern experimentation platforms may use sequential statistical methods that are specifically designed to support repeated analysis while controlling error rates. If your platform does, follow its statistical model rather than applying fixed-horizon stopping rules on top of it.
Test duration should also capture representative behavior. Running across complete business cycles can help account for differences between weekdays, traffic sources, campaign schedules, returning visitors, and other time-based effects.
How do you predetermine sample size? There are lots of great tools. Here’s how you’d calculate your sample size with CXL’s Free A/B Test Calculator:
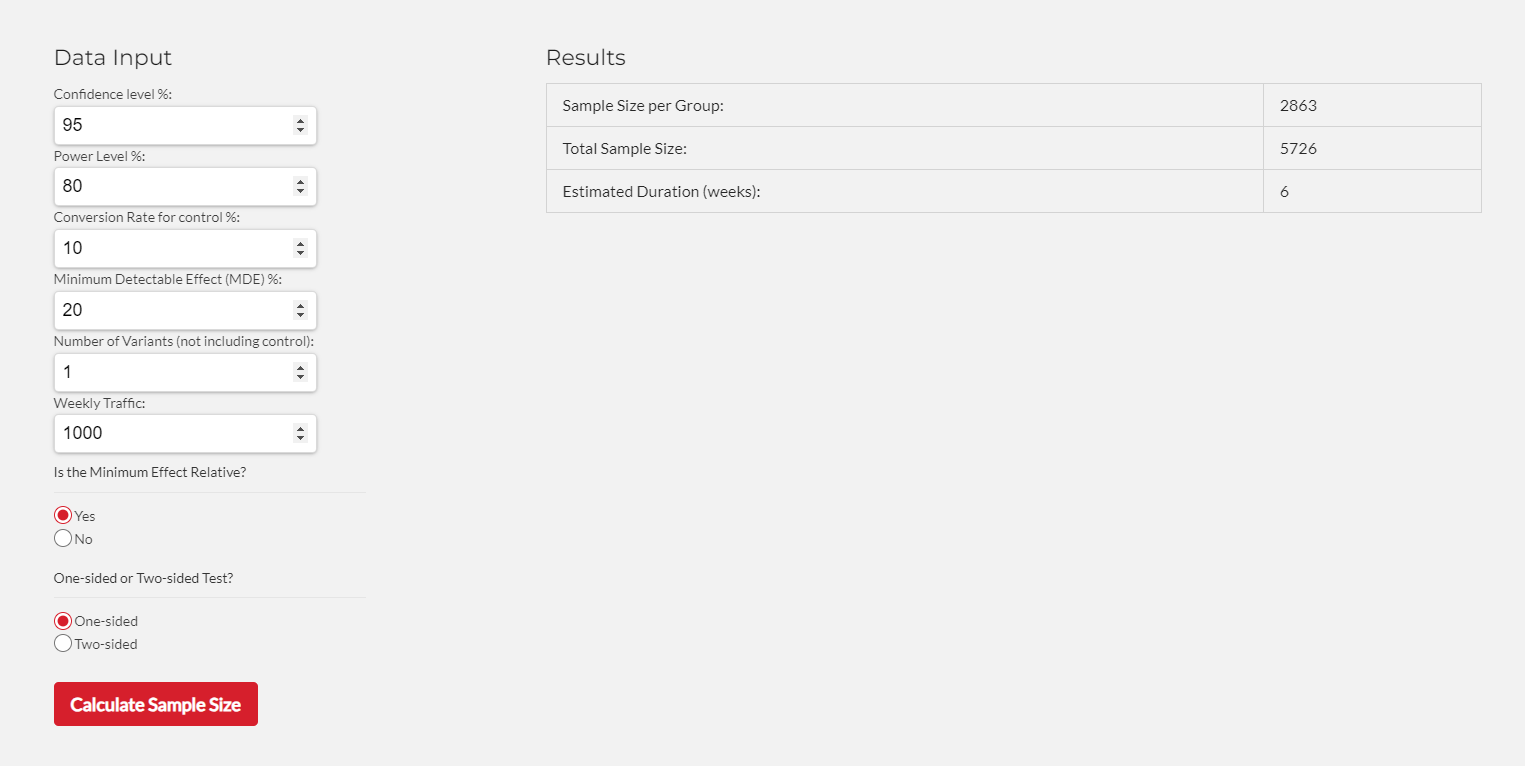
In this example, we told the tool that we have a 10% conversion rate and want to detect at least 20% uplift. The tool tells us that we need a 2863 sample size per group before we can look at statistical significance levels.
In addition to significance level, there’s something called statistical power. Statistical power attempts to avoid Type II errors (false negatives). In other words, it makes it more likely that you’ll detect an effect if there actually was one.
For practical purposes, know that 80% power is the standard for A/B testing tools. To reach such a level, you need either a large sample size, a large effect size, or a longer duration test.
There are no magic numbers
A lot of blog posts tout magic numbers like “100 conversions” or “1,000 visitors” as stopping points. Math is not magic. Math is math, and what we’re dealing with is slightly more complex than simplistic heuristics like those figures. Andrew Anderson from Malwarebytes put it well:
“It is never about how many conversions. It is about having enough data to validate based on representative samples and representative behavior.
One hundred conversions is possible in only the most remote cases and with an incredibly high delta in behavior, but only if other requirements like behavior over time, consistency, and normal distribution take place. Even then, it is has a really high chance of a Type I error, false positive.”
Andrew Anderson
We want a representative sample. How can we get that? Test for two business cycles to mitigate external factors:
- Day of the week. Your daily traffic can vary a lot;
- Traffic sources. Unless you want to personalize the experience for a dedicated source;
- Blog post and newsletter publishing schedule;
- Return visitors. People may visit your site, think about a purchase, and then come back 10 days later to buy it;
- External events. A mid-month payday may affect purchasing, for example.
Be careful with small sample sizes. The Internet is full of case studies steeped in terrible math. Most studies (if they ever released full numbers) would reveal that publishers judged test variations on 100 visitors or a lift from 12 to 22 conversions.
Once you’ve set up everything correctly, avoid peeking (or letting your boss peek) at test results before the test finishes. This can result in calling a result early due to “spotting a trend” (impossible). What you’ll find is that many test results regress to the mean.
Regression to the mean
Often, you’ll see results vary wildly in the first few days of the test. Sure enough, they tend to converge as the test continues for the next few weeks. Here’s an example from an ecommerce site:
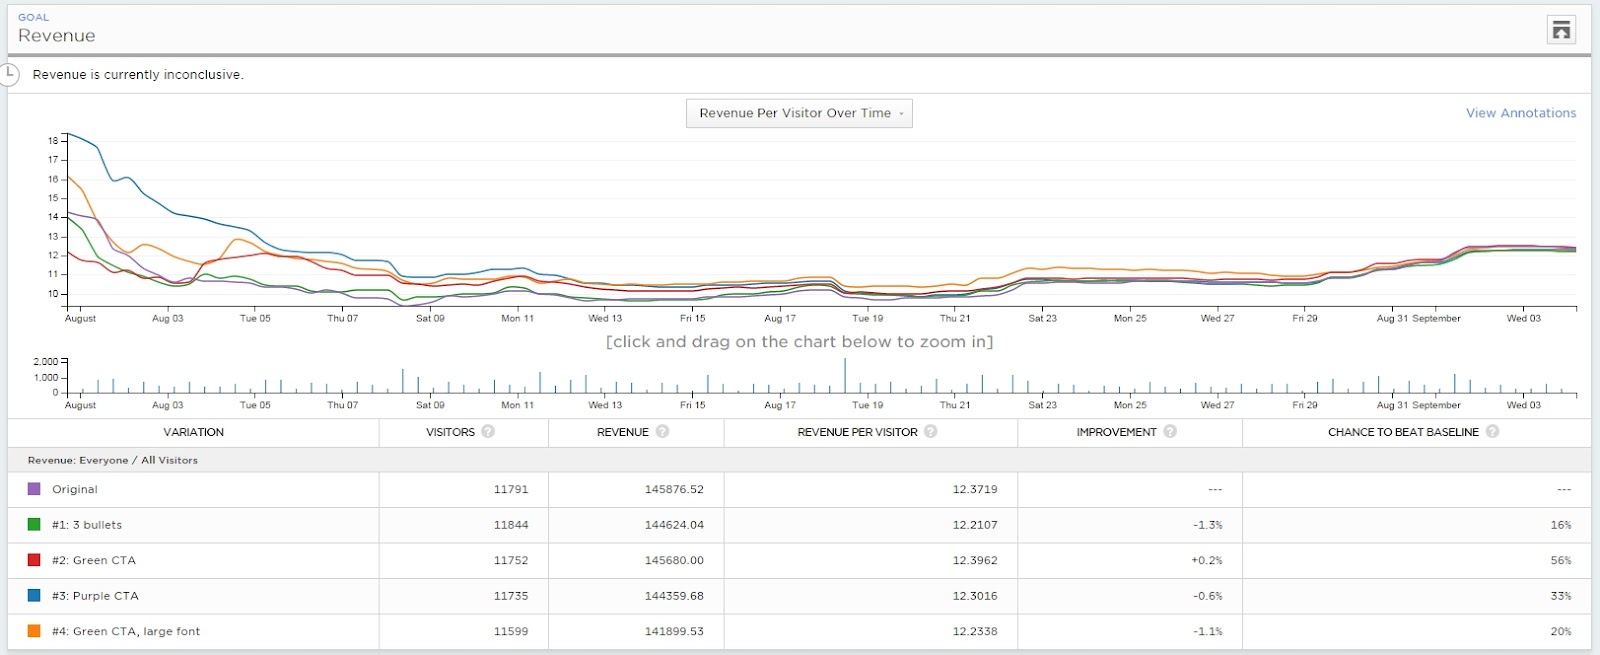
- First couple of days: Blue (variation #3) is winning big—like $16 per visitor vs. $12.50 for Control. Lots of people would (mistakenly) end the test here.
- After 7 days: Blue still winning, and the relative difference is big.
- After 14 days: Orange (#4) is winning!
- After 21 days: Orange still winning!
- End: No difference.
If you’d called the test at less than four weeks, you would have made an erroneous conclusion.
There’s a related issue: the novelty effect. The novelty of your changes (e.g., bigger blue button) brings more attention to the variation. With time, the lift disappears because the change is no longer novel.
It’s one of many complexities related to A/B testing. We have a bunch of blog posts devoted to such topics:
- Stopping A/B Tests: How Many Conversions Do I Need?
- Statistical Significance Does Not Equal Validity (or Why You Get Imaginary Lifts)
Can you run multiple A/B tests simultaneously?
Yes. Multiple experiments can run simultaneously when their treatments are unlikely to interact materially, but overlapping tests should be monitored when they affect the same users, pages, features, or metrics.
You want to speed up your testing program and run more tests—high-tempo testing. But can you run more than one A/B test at the same time? Will it increase your growth potential or pollute your data?
Some experts say you shouldn’t do multiple tests simultaneously. Some say it’s fine. In most cases, you will be fine running multiple simultaneous tests; extreme interactions are unlikely.
Unless you’re testing really important stuff (e.g., something that impacts your business model or, the future of the company), the benefits of testing volume will likely outweigh the noise in your data and occasional false positives.
If there is a high risk of interaction between multiple tests, reduce the number of simultaneous tests and/or let the tests run longer for improved accuracy.
If you want to learn more, read these posts:
- Embrace Overlapping A/B Tests and Avoid the Dangers of Isolating Experiments;
- Can You Run Multiple A/B Tests at the Same Time?
How to set up A/B tests
To set up an A/B test, define the problem and hypothesis, create the control and variation, choose the primary and guardrail metrics, determine traffic allocation and sample requirements, configure the experiment, and QA the experience and tracking before launch.
Once you’ve got a prioritized list of test ideas, it’s time to form a hypothesis and run an experiment. A hypothesis defines why you believe a problem occurs. Furthermore, a good hypothesis:
- Is testable. It is measurable, so it can be tested.
- Solves a conversion problem. Split-testing solves conversion problems.
- Provides market insights. With a well-articulated hypothesis, your split-testing results give you information about your customers, whether the test “wins” or “loses.”
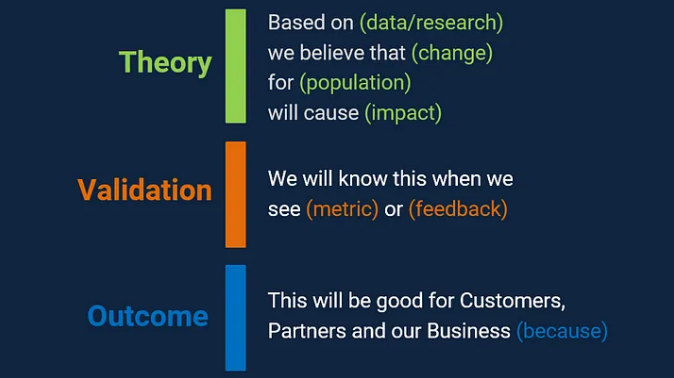
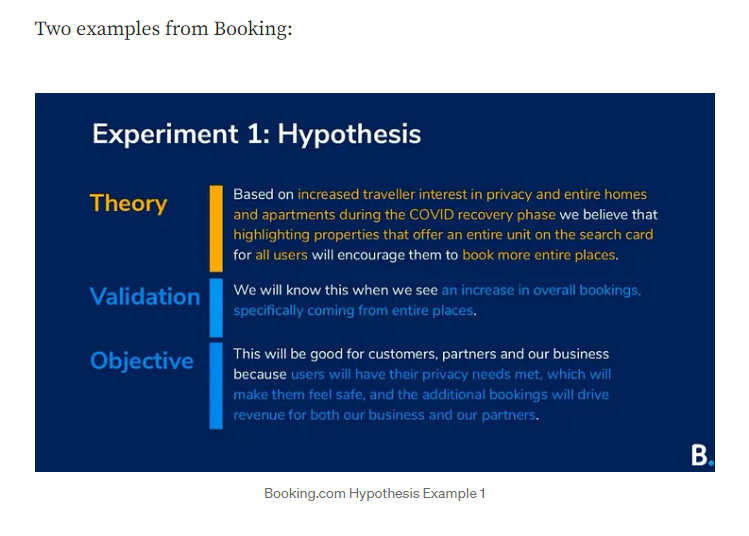
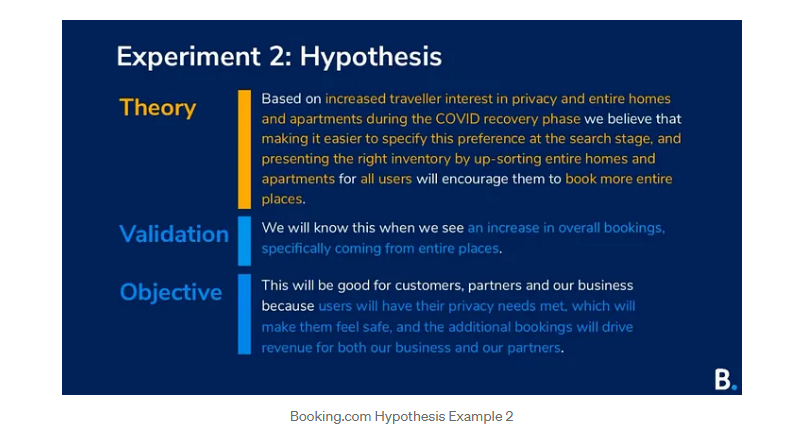
Craig Sullivan has a hypothesis kit to simplify the process:
- Theory: The reason for running the test;
- Validation: Proof showing your theory should or shouldn’t change your default based on metrics or feedback you may or may not expect to see;
- Outcome: Reasons the experiment goal will be beneficial.
Technical stuff
Here’s the fun part: You can finally think about picking a tool.
While this is the first thing many people think about, it’s not the most important. Strategy and statistical knowledge come first.
That said, there are a few differences to bear in mind. One major categorization in tools is whether they are server-side or client-side testing tools.
Server-side tools render code on the server level. They send a randomized version of the page to the viewer with no modification on the visitor’s browser. Client-side tools send the same page, but JavaScript on the client’s browser manipulates the appearance of the original and the variation.
Modern experimentation platforms increasingly support multiple approaches rather than fitting neatly into one category. Optimizely, Wingify, Adobe Target, and Conductrics support web experimentation, while product-focused platforms such as Statsig and GrowthBook combine experimentation with feature flags and server-side implementation.
Client-side testing is often faster for marketing teams to deploy because visual editors can change front-end experiences without a full application release. Server-side experimentation requires more engineering involvement but can test product logic, algorithms, pricing, APIs, and other changes that cannot reliably be implemented in the browser.
While setting up tests is slightly different depending on which tool you use, it’s often as simple as signing up for your favorite tool and following its instructions, like putting a JavaScript snippet on your website.
Before launching, define the primary outcome and any secondary or guardrail metrics your experiment will measure.
In GA4, user interactions are measured as events. Actions that are especially important to the business can be marked as key events. For example, a form submission or visit to a confirmation page can trigger an event that is then marked as a key event in GA4.
Your experimentation platform should also receive the metrics required to compare the control and variation reliably.
A confirmation-page view can trigger an event that is marked as a key event in GA4.
Skills that come in handy when setting up A/B tests are HTML, CSS, and JavaScript/JQuery, as well as design and copywriting skills to craft variations. Some tools allow use of a visual editor, but that limits your flexibility and control.
How to analyze A/B test results
Analyze an A/B test by checking data quality first, then evaluate the predefined primary metric, effect size, uncertainty, guardrail metrics, and any planned segment analyses. A statistically significant result is not automatically large or valuable enough to implement.
Alright. You’ve done your research, set up your test correctly, and the test is finally cooked. Now, on to analysis. It’s not as simple as a glimpse at the graph from your testing tool.
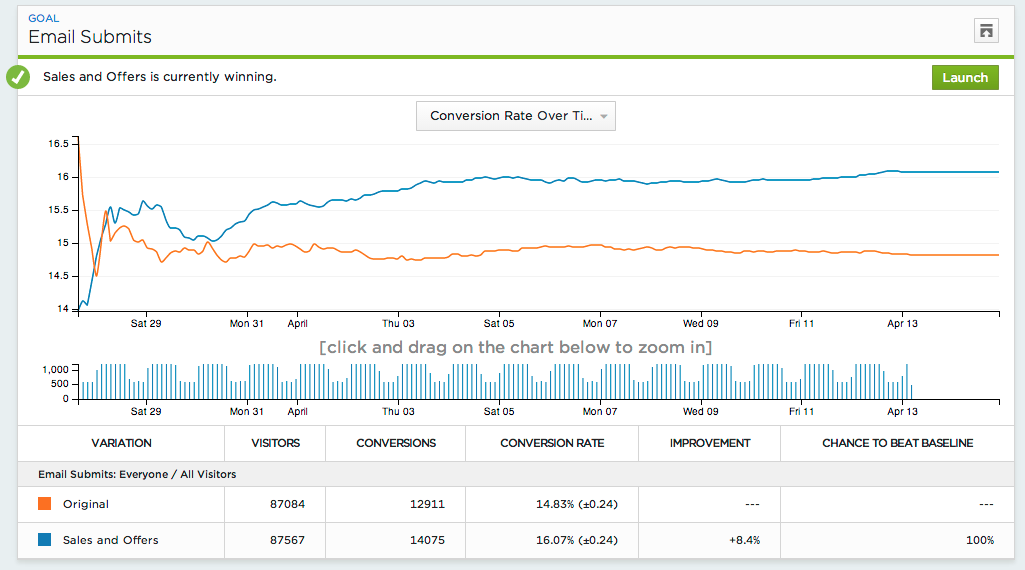
One thing you should always do: Analyze your test results in Google Analytics. It doesn’t just enhance your analysis capabilities; it also allows you to be more confident in your data and decision-making.
Your testing tool could be recording data incorrectly. If you have no other source for your test data, you can never be sure whether to trust it. Create multiple sources of data.
What happens if there’s no difference between variations? Don’t move on too quickly. First, realize two things:
1. Your hypothesis might have been right, but the implementation was wrong.
Let’s say your qualitative research says that concern about security is an issue. How many ways can you beef up the perception of security? Unlimited.
The name of the game is iterative testing, so if you were on to something, try a few iterations.
2. Even if there was no difference overall, the variation might beat the control in a segment or two.
If you got a lift for returning visitors and mobile visitors—but a drop for new visitors and desktop users—those segments might cancel each other out, making it seem like there’s “no difference.” Analyze your test across key segments to investigate that possibility.
Data segmentation for A/B tests
The key to learning in A/B testing is segmenting. Even though B might lose to A in the overall results, B might beat A in certain segments (organic, Facebook, mobile, etc).
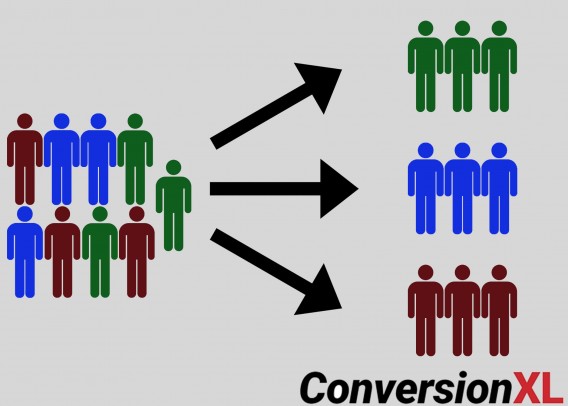
There are a ton of segments you can analyze. Optimizely lists the following possibilities:
- Browser type;
- Source type;
- Mobile vs. desktop, or by device;
- Logged-in vs. logged-out visitors;
- PPC/SEM campaign;
- Geographical regions (city, state/province, country);
- New vs. returning visitors;
- New vs. repeat purchasers;
- Power users vs. casual visitors;
- Men vs. women;
- Age range;
- New vs. already-submitted leads;
- Plan types or loyalty program levels;
- Current, prospective, and former subscribers;
- Roles (if your site has, for instance, both a buyer and seller role).
At the very least—assuming you have an adequate sample size—look at these segments:
- Desktop vs. tablet/mobile;
- New vs. returning;
- Traffic that lands on the page vs. traffic from internal links.
Make sure each segment has enough data to support the analysis. Segment-level comparisons have less statistical power than the full experiment, and examining many segments after the test also increases the risk of finding apparently meaningful differences by chance.
Where possible, define important segment analyses before launch and calculate the required sample size for those comparisons rather than relying on a fixed conversion threshold.
If your treatment performed well for a specific segment, it’s time to consider a personalized approach for those users.
How to archive past A/B tests
Archive the hypothesis, variations, dates, audience, traffic allocation, metrics, screenshots, statistical results, final decision, and key learning from every experiment. A searchable experiment history prevents repeated tests and helps teams identify patterns across multiple experiments.
A/B testing isn’t just about lifts, wins, losses, and testing random shit. As Matt Gershoff said, optimization is about “gathering information to inform decisions,” and the learnings from statistically valid A/B tests contribute to the greater goals of growth and optimization.
Smart organizations archive their test results and plan their approach to testing systematically. A structured approach to optimization yields greater growth and is less-often limited by local maxima.
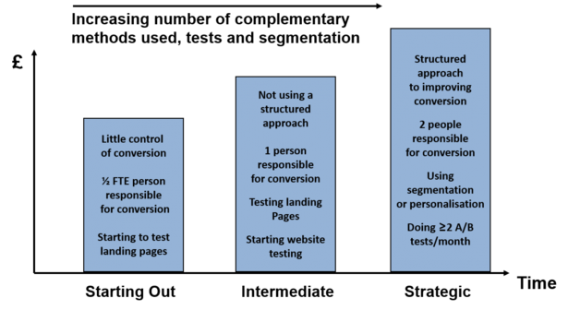
So here’s the tough part: There’s no single best way to structure your knowledge management. Some companies use sophisticated, internally built tools; some use third-party tools; and some use Excel and Trello.
If it helps, here are three tools built specifically for conversion optimization project management:
- Iridion;
- Effective Experiments;
- Growth Hackers’ Projects.
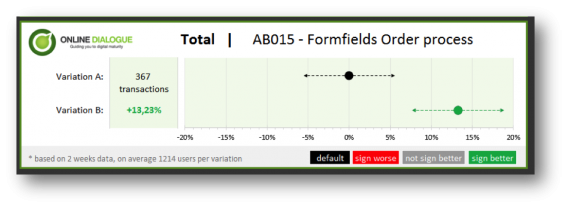
It’s important to communicate across departments and to executives. Often, A/B test results aren’t intuitive to a layperson. Visualization helps.
Annemarie Klaassen and Ton Wesseling wrote an awesome post on visualizing A/B test results. Here’s what they came up with:
A/B testing statistics
Statistical knowledge is handy when analyzing A/B test results. We went over some of it in the section above, but there’s more to cover.
Why do you need to know statistics? Matt Gershoff likes to quote his college math professor: “How can you make cheese if you don’t know where milk comes from?!”
There are three terms you should know before we dive into the nitty gritty of A/B testing statistics:
- Mean. We’re not measuring all conversion rates, just a sample. The average is representative of the whole.
- Variance. What is the natural variability of a population? That affects our results and how we use them.
- Sampling. We can’t measure the true conversion rate, so we select a sample that is (hopefully) representative.
What is a p-value?
Many use the term “statistical significance” inaccurately. Statistical significance by itself is not a stopping rule, so what is it and why is it important?
To start with, let’s go over p-values, which are also very misunderstood.A p-value is the measure of evidence against the null hypothesis (the control, in A/B testing parlance). A p-value does not tell us the probability that B is better than A.
Similarly, it doesn’t tell us the probability that we will make a mistake in selecting B over A. These are common misconceptions.
The p-value is the probability of seeing the current result or a more extreme one given that the null hypothesis is true. Or, “How surprising is this result?”
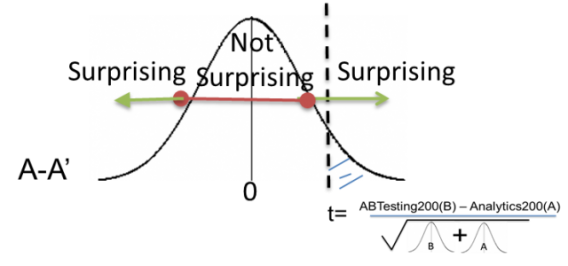
To sum it up, statistical significance (or a statistically significant result) is attained when a p-value is less than the significance level (which is usually set at 0.05).
Significance in regard to statistical hypothesis testing is also where the whole “one-tail vs. two-tail” issue comes up.
One-tail vs. two-tail A/B tests
One-tailed tests allow for an effect in one direction. Two-tailed tests look for an effect in two directions—positive or negative.
“No need to get very worked up about this. Gershoff from Conductrics summed it up well:
If your testing software only does one type or the other, don’t sweat it. It is super simple to convert one type to the other (but you need to do this BEFORE you run the test) since all of the math is exactly the same in both tests.
All that is different is the significance threshold level. If your software uses a one-tail test, just divide the p-value associated with the confidence level you are looking to run the test by two.
So, if you want your two-tail test to be at the 95% confidence level, then you would actually input a confidence level of 97.5%, or if at a 99%, then you need to input 99.5%. You can then just read the test as if it was two-tailed.”
Matt Gershoff
Confidence intervals and margin of error
A conversion-rate estimate has uncertainty. A confidence interval expresses that uncertainty as a range of plausible values around the estimate under the statistical method being used.
If a result is reported as X% ± Y, Y is the margin of error. The confidence interval is the range from X − Y to X + Y.
Narrower intervals indicate greater precision; wider intervals indicate greater uncertainty. Sample size, variability, and the chosen confidence level all affect the width of the interval.
Do not determine whether two variations differ simply by checking whether their individual confidence intervals overlap. Use the statistical comparison and decision rule appropriate to the experiment design and testing platform.
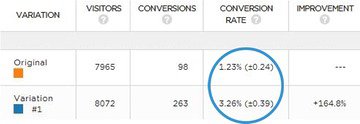
An example of confidence intervals. (Image source)
Matt Gershoff gave a great illustration of how margin of error works:
“Say your buddy is coming to visit you from Round Rock and is taking TX-1 at 5 p.m. She wants to know how long it should take her. You say I have a 95% confidence that it will take you about 60 minutes plus or minus 20 minutes. So your margin of error is 20 minutes, or 33%.
If she is coming at 11 a.m. you might say, “It will take you 40 min, plus or minus 10 min,” so the margin of error is 10 minutes, or 25%. So while both are at the 95% confidence level, the margin of error is different.”
Matt Gershoff
External validity threats
There’s a challenge with running A/B tests: Data isn’t stationary.
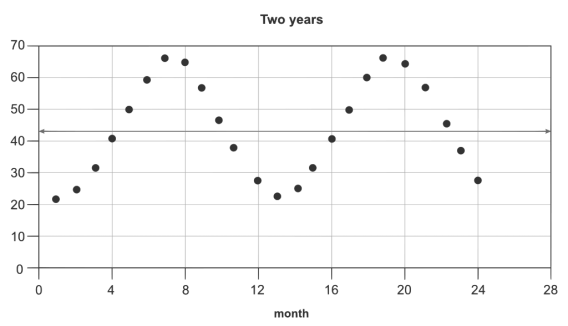
Sinusoidal data
A stationary time series is one whose statistical properties (mean, variance, autocorrelation, etc.) are constant over time. For many reasons, website data is non-stationary, which means we can’t make the same assumptions as with stationary data. Here are a few reasons that data might fluctuate:
- Season;
- Day of the week;
- Holidays;
- Positive or negative press mentions;
- Other marketing campaigns;
- PPC/SEM;
- SEO;
- Word-of-mouth.
Others include sample pollution, the flicker effect, revenue tracking errors, selection bias, and more. (Read here.) These are things to keep in mind when planning and analyzing your A/B tests.
Bayesian or frequentist Stats
Bayesian or Frequentist A/B testing is another hot topic. Many popular tools have rebuilt their stats engines to feature a Bayesian methodology.
Here’s the difference (very much simplified): In the Bayesian view, a probability is assigned to a hypothesis. In the Frequentist view, a hypothesis is tested without being assigned a probability.
Rob Balon, who carries a PhD in statistics and market research, says the debate is mostly esoteric tail wagging from the ivory tower. “In truth,” he says, “most analysts out of the ivory tower don’t care that much, if at all, about Bayesian vs. Frequentist.”
Don’t get me wrong, there are practical business implications to each methodology. But if you’re new to A/B testing, there are much more important things to worry about.
How to do A/B testing: tools and resources
Now, how do you start running A/B tests?
Littered throughout this guide are tons of links to external resources: articles, tools, books, and books. We’ve tried to compile all the most valuable knowledge in our A/B Testing course.
On top of that, here are some of the best resources (divided by categories).
A/B testing tools
There are a lot of tools for online experimentation. Here’s a list of 21 conversion optimization tools, all reviewed by experts. Some of the most popular A/B testing tools include:
A/B testing calculators
- AB Test Calculator by CXL;
- A/B Split Test Significance Calculator by VWO;
- A/B Split and Multivariate Test Duration Calculator by VWO;
- Evan Miller’s Sample Size Calculator.
A/B testing statistics resources
- A/B Testing Statistics: An Easy-to-Understand Guide;
- Understanding A/B testing statistics to get REAL Lift in Conversions;
- One-Tailed vs Two-Tailed Tests (Does It Matter?);
- Bayesian vs Frequentist A/B Testing – What’s the Difference?;
- Sample Pollution.
A/B testing/CRO strategy resources
- 4 Frameworks To Help Prioritize & Conduct Your Conversion Testing;
- What you have to know about conversion optimization;
- Conversion Optimization Guide.
FAQs about A/B testing
What is A/B testing?
A/B testing is a controlled experiment that compares a control with one or more variations to determine whether a change affects a predefined metric. Users are randomly assigned to the different experiences so their outcomes can be compared.
How long should an A/B test run?
An A/B test should run until it satisfies the sample-size, duration, and stopping criteria defined before launch. There is no universal number of days or conversions because the requirement depends on traffic, baseline performance, minimum detectable effect, statistical power, and the statistical method used.
How much traffic do you need for A/B testing?
There is no fixed traffic threshold for A/B testing. Calculate the required sample size from your baseline rate, minimum detectable effect, statistical power, significance level, and number of variations.
Low-traffic businesses can still experiment, but they may need to test larger changes, use higher-volume metrics, or run experiments for longer.
What is the difference between A/B testing and multivariate testing?
A/B testing compares complete variations of an experience, while multivariate testing changes multiple elements simultaneously to estimate how individual elements and combinations affect performance.
Multivariate tests generally require substantially more traffic because the audience is divided across more combinations.
Can you run multiple A/B tests at the same time?
Yes. Multiple tests can run at the same time when their treatments are unlikely to interact materially. If experiments affect the same page, feature, audience, or key metric, assess whether one treatment could influence the outcome of another.
What does statistical significance mean in A/B testing?
Statistical significance indicates that the observed result would be sufficiently unusual under the null hypothesis according to a predefined significance threshold. It does not tell you the probability that the variation is better, nor does it tell you whether the effect is large enough to matter commercially.
Build stronger experimentation skills
A/B testing is most useful when it becomes part of a repeatable decision-making process: research problems, form evidence-backed hypotheses, design valid experiments, analyze the results correctly, and preserve what you learn.
Running more tests is not the objective. Running better experiments that reduce uncertainty and improve business decisions is.
To build those skills further, CXL has three relevant courses:
Advanced Experimentation Masterclass: Learn how to build experimentation roadmaps, improve test velocity, manage programs, and scale experimentation across an organization.
A/B Testing Foundations: Learn how to design, prioritize, and interpret statistically valid A/B tests.
A/B Testing Mastery: Go deeper into hypotheses, KPIs, experiment configuration, QA, analysis, and client-side versus server-side testing.
Related Posts
-

A/B testing is highly useful, no question here. But a lot of businesses should not be…
-

A/B testing is fun. With so many easy-to-use tools, anyone can—and should—do it. However, there's…
-

Sometimes A/B testing is made to seem like some magical tool that will fix all…
-

So you ran a test - and you ran it correctly, following A/B testing best…






Hi, great article!
I have a question about the Evan Miller’s tool. I’m using Monetate as A/B testing tool and some of the KPIs/metrics, such as Revenue Per Session, are measured in dollars.
So for example, I can have a campaign that says experiment performs at $4.52 and control at $3.98. What can I consider as a Baseline Conversion Rate?
Hey! You would still use Evan Miller’s tool to calculate how many people you need in the test, but you can’t use the same A/B test calculator for deciding which one is the winner. There’s an excellent answer to this in the CXL Facebook group by Chad Sanderson:
T Test or proportion tests don’t work when measuring Revenue Per Visitor because it violates the underlying assumptions of the test. (For T Test, the assumption is your data is spread evenly around a mean, whereas proportion or binomial tests measure successes or failures only) RPV data is not spread normally around the mean (The vast majority of visitors will purchase nothing) and we’re not looking at a proportion (Because we need to find the average revenue per visitor). So the best way to conduct a test on RPV is to use a Mann-Whitney U or Wilcoxon test, which are both rank based sum tests that is designed exactly for cases like this.