For a web analytics analyst or a data-driven marketer, these are words to live by: “Without data, you’re just another person with an opinion.”
Optimization isn’t about educated guesses and hunches, no matter how many years you’ve been in the industry. It’s about doing the research, asking the right questions, digging for clues in problem areas, paying attention to the signs when they appear, and running smart A/B tests.
Web analytics analysis is a big part of that. It helps separate the optimizers from just another person with an opinion.
Table of contents
- Why web analytics analysis is important
- Questions that need answers
- Conduct a Google Analytics health check
- Remember that context is king
- Step 1: Start with the highest value
- Step 2: Web analytics quality assurance
- Step 3: Broken links
- Step 4: Site speed
- Step 5: The funnel
- Step 6: Internal search
- Web analytics segmentation is the real secret
- Conclusion
Why web analytics analysis is important
Web analytics analysis is a key part of the ResearchXL model. In case you’re unfamiliar with our conversion research framework, here’s a visual summary:
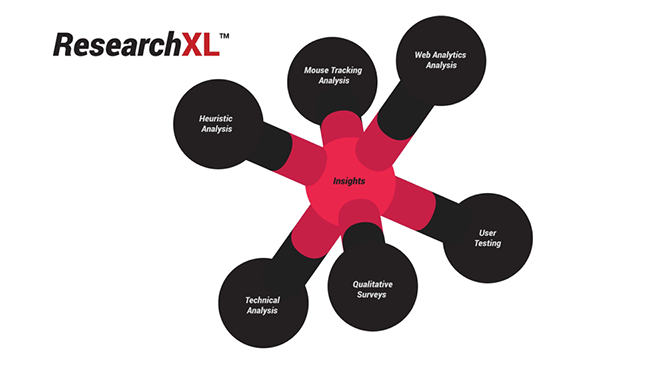
Typically, when explaining web analytics analysis, I say it’s when you “conduct an analytics health check, set up your KPIs, and identify leaks in your funnel.”
In practice, it’s a little more complex. I’m willing to bet quite a few people skip this step altogether. And those who don’t? They’re likely missing out on a lot of hidden opportunities.
Now, there are four main reasons you want to include web analytics analysis in your conversion research process:
- Ensure your data is reliable and accurate.
- Answer questions that arose during heuristic analysis.
- Uncover new, hidden problem areas/areas of interest, which generate more questions.
- Find quick wins/fixes and future A/B test ideas.
Questions that need answers
Before you can properly complete your web analytics analysis, you should have a list of questions that need answers. For example:
- Is anyone actually using the text size or print buttons?
- When they’re browsing, are they using search?
- What do our most valuable users do differently on our site? Does that matter?
- Are there broken devices or browsers?
- Where are the leaks in the funnel? How can we fix them?
- Which promotions are most effective?
- When they do X, is an event being fired?
- Are error messages being recorded?
- How often are items removed from the cart?
That’s why asking intelligent business questions is such an important skill. (Sorry, but stupid questions do exist.) As Peep explains, asking intelligent questions means the answer you uncover will be actionable:
Always approach analytics with a problem: You need to know in advance what you want to know, and what you’re going to change/do based on the answer.
If nothing, then you don’t need it.
While working with Peep on a conversion research project, for example, I wrote down multiple questions during a walkthrough. At the end, he asked, “What are you going to change/do based on the answer to this question?” If I couldn’t answer, the question was deleted.
You have a ton of data at your fingertips, so if you don’t know what you’re looking for, you won’t find it. And when you do find it, you need to know what you’re going to do with it. There’s a big difference between data and useful data.
So, before you start web analytics analysis, do the following:
- A simple site walkthrough.
- Look for suspicious/”bad” parts of the site.
- Look for signs of poor tracking (e.g., each flow can’t be measured separately because the URLs are the same).
- Develop a list of questions you need answers to.
- Go through the list of questions and ask yourself, “What are you going to change/do based on the answer to this question?” If you don’t have an answer, remove it.
Chris Mercer of MeasurementMarketing.io adds that asking intelligent questions isn’t quite enough:
Google Analytics can often act like your best friend. Ask it a question, and it’ll give you an answer. Sometimes, though, it’s like trying to get information from a fortune teller who speaks in riddles! The trick in either case is to go slow, be specific, and pay attention to the clues you’re being given.
Conduct a Google Analytics health check
I’ve written an entire article on how to conduct a Google Analytics health check, so I’ll keep this brief. The goal of the health check is to help you answer these three questions:
- Am I collecting all of the data I need?
- Can I trust the data I’m collecting?
- Is anything broken or tracking/reporting incorrectly? Why?
You might look into:
- Is enhanced link attribution turned on?
- Do you have your “Virgin View” and “Working Views” configured properly?
- Have you configured your custom and default channel groupings?
- Is internal site search set up and working correctly?
- Does the site use a third-party cart? If so, do they have cross-domain tracking in place?
Essentially, you want to have a look around and ensure you’re collecting all of the data you can, and that the data is accurate.
As you grow and over time, your web analytics setup risks becoming overly complicated and, therefore, will continually require debugging. This isn’t a one-time job. As you continue to grow your business and your web analytics maturity, watch our for issues of data integrity, data maturity, and data governance.
You’ll begin asking questions like:
- Should we set up filters and views for this particular team?
- Who should have access and control to set up new event tracking?
- What’s our event-tracking taxonomy? What’s our UTM campaign-tagging taxonomy? Can we clean it up?
- Are there strategic events that we’re currently not tracking? What’s a proper roadmap to improve tracking?
- How can we streamline certain reporting for stakeholders and executives? How can we improve the process of business questions and answers?
Remember that context is king
Before you dive in, know that context is king when it comes to web analytics analysis. Jeff Sauer of Data Driven U uses bounce rate as an example:
It’s been around for as long as there was Google Analytics. When it comes to bounce rate, I have been asked hundreds of variations of the same question:
To which I always say, “It depends.”
You see, bounce rate counts the number of people who came to your website and only recorded one pageview. They could have left your site in a huff or their browser could have crashed. Or they could have spent 10 minutes on your site.
Whether a high bounce rate is bad or not depends on what you want the person to do. Do you want someone to view your site, find their answer, and leave? Or do you want them to stick around for a long time and window-shop all day long?
Are you focused on converting the people who can be converted? Then your bounce rate will probably be very high. And so will your conversion rate.
There are online millionaires with 95% bounce rates. There are websites with 5% bounce rates that are going out of business.
Bounce rate is almost completely meaningless without business context. This is why I find a much better indicator of success is the “Page Value” metric in Google Analytics.
Like bounce rate, page value attempts to estimate the value of your landing pages. The biggest difference is that this metric is tied to website outcomes. Bounce rate just means that no more pages were viewed. Page Value shows you how much value this page contributes to your goals.
Page Value is set up automatically when you set up Goals in Google Analytics and assign them a value.
Is bounce rate a useless indicator? Of course not. Should you exclusively use page value to indicate success? Also no. What’s important is that you’re hyperaware of context at all times.
Use this same critical mindset when viewing any sort of metric, including click-through rate and even conversion rate. There are no absolutes in this case, and an analyst’s best strength is a curious, humble, and inquisitive mind.
Remember, you’re looking for anything that’s unusual for your site. Just as there is no “good” conversion rate, there’s no “good” bounce rate or “good” page value.
You’re like a detective digging for clues when you’re conducting a web analytics analysis. If you don’t know the history of the case/crime/suspects, you’ll probably put the wrong person behind bars.
Step 1: Start with the highest value
There are two high-value places you can look into right away:
- High-volume, low-value pages. For example, an old blog post that gets a lot of organic traffic because it ranks well for a popular keyword.
- Low-volume, high-value pages. For example, your checkout page.
Optimizing either type would likely result in big value for your business, right? Sauer likes to start with those high-volume, low-value pages:
One of my favorite methods for generating optimization ideas are looking at high volume / low value pages and discovering ways to optimize them. In fact, I published a case study about how you can use this decision making process to influence decisions.
The basic premise is easy. If your page gets a lot of traffic and no conversions, it should be the focus of your next optimization. From here, you can go to this page and discover what might be wrong. Are your visitors finding what they need? Do you offer a content upgrade or email opt in? Are there technical errors? Would you take the action you want users to take? Are you even asking them to take action?
There are millions of conversion questions you can ask once you discover the holes in your strategy. And there are all kinds of tools that help you get at the answers.
Bounce rate tells you what people didn’t do, but is largely dependent on your website design. Page Value tells you what people didn’t buy, and gives you a clear path to discovering why.
When it comes to analytics, we all want the same thing: to increase our chances of future success by learning from the past. Focusing on the actions you want users to take will get you there, more quickly.
So, for example, here’s a list of top pages (by pageviews) and their bounce rates (by comparison to the average):
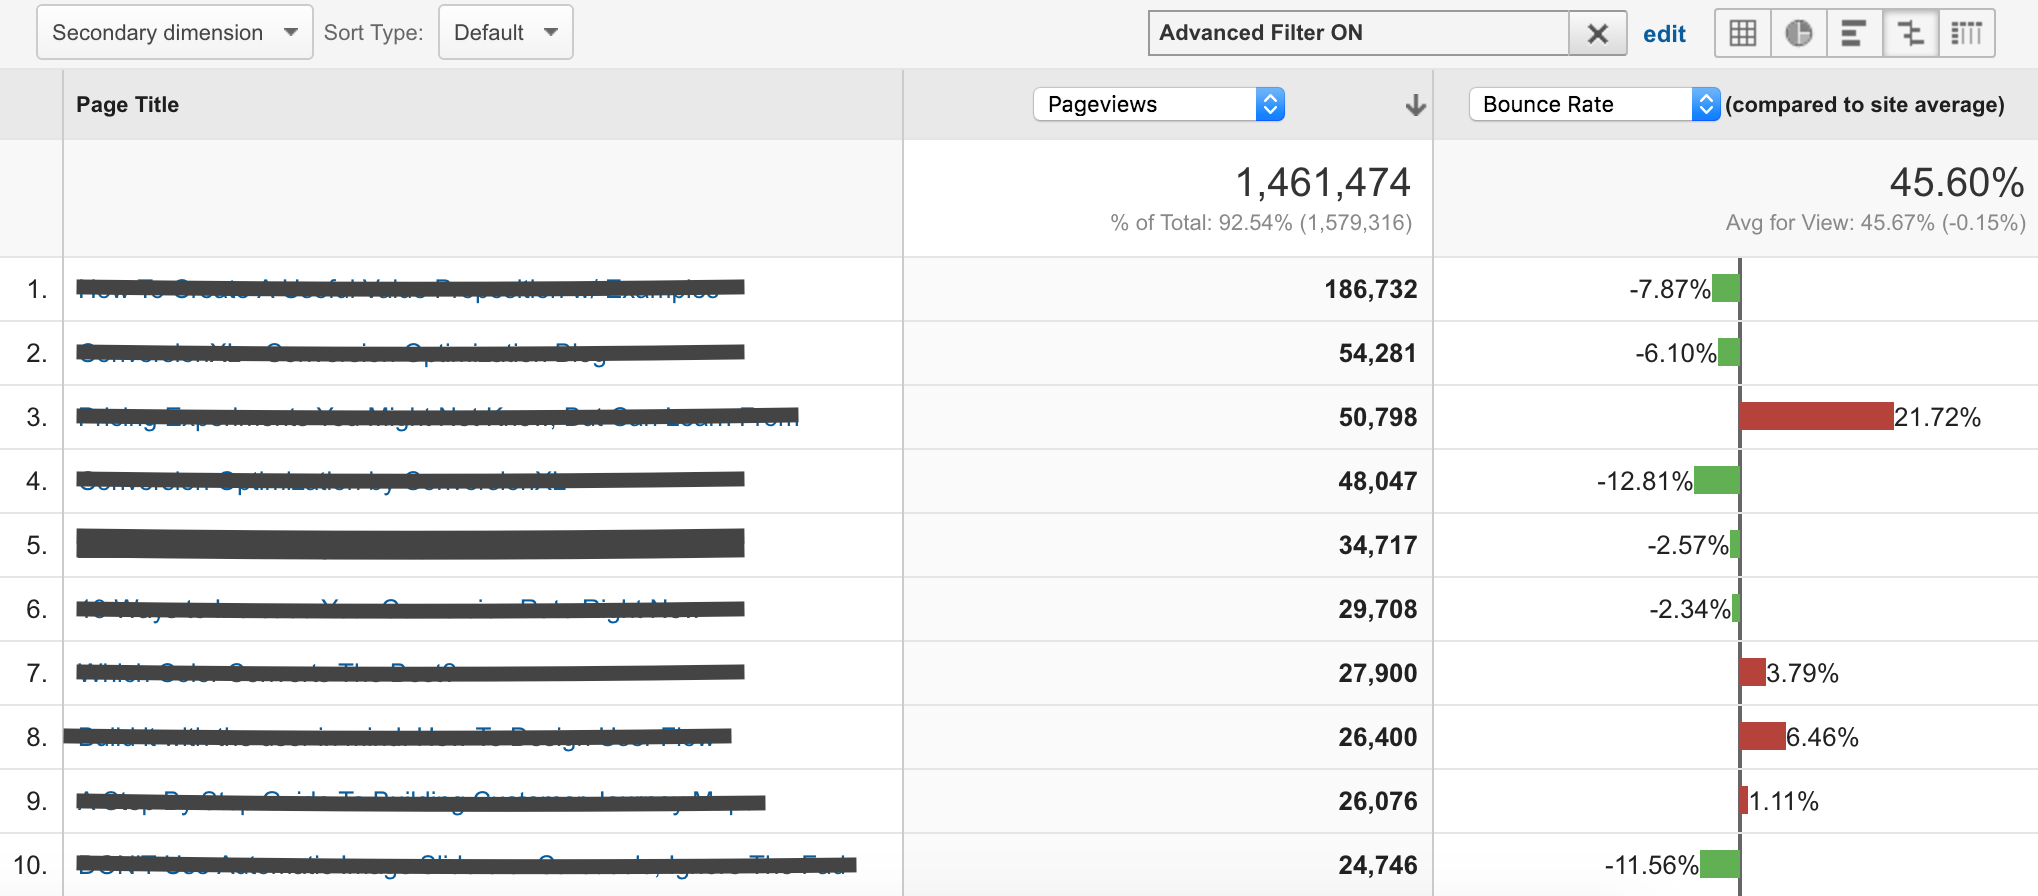
If I were going to go after high-volume, low-value pages, I’d start with pages 3, 7, 8, and 9. You can change bounce rate to whatever success indicator you’d like, of course.
You might’ve noticed that I’m using an advanced filter. Why? To filter out pages with too small of a sample size. If not enough people have seen the page, the success indicator isn’t reliable.
Pages 3, 7, 8, and 9 should be added to a list of suspicious/”bad” parts of the site. From there, we can examine the pages in-depth.
Is something technically wrong? Is the copy boring or unclear? Is the UX awful? Take a look at similar pages that are doing well. What can the bad pages learn from the good ones?
Tip: The navigation summary is an awesome, lesser-known resource. You can use it to find out where people are going when they leave key pages, which could indicate what’s missing from those pages. You can also identify rarely used links that distract from your most-wanted action.
Here’s an example from a blog:

Some 9.7% of people leave the blog (Page 1) to visit Page 2. Another 8.5% leave to return to the main site. Obviously, this is 10x more helpful for SaaS and ecommerce sites.
Step 2: Web analytics quality assurance
I’ve said it before and I’ll say it again, website quality assurance is vital. Pages and flows that are technically broken are a conversion killer—there’s no way around it.
As Peep explains, cross-browser and cross-device issues are low-hanging fruit for optimizers:
You won’t believe how many conversions are lost due to poor cross-browser and cross-device compatibility issues.
While some might consider this a technical issue and not a conversion issue, I say otherwise. Anything that we, as optimizers, can do to boost conversions is an optimization issue. And these are low-hanging fruits.Questions we’re trying to answer here:
– Does the site work with every major browser?
– Does the site work with every device?
– What’s the user experience like with every device?Technical issues and poor user experience will kill conversions.
You did a simple walkthrough above, but you should also do an in-depth technical walkthrough where you explore your site (starting, first, with your funnels) using all of the devices and browsers that are even remotely relevant today.
A tool like BrowserStack can help you with browser and device testing, but it’s time-consuming. So, while you’re working through all of them, focus on the handful that will provide the most value.
Mercer explains how to identify the biggest opportunities:
If you’re planning on using Google Analytics as a tool to figure out what might be killing your conversions, the easiest place to start first is a technical audit.
Which browsers are your visitors using? Which versions? Which devices? Pull these Audience reports and compare them against each other.
Is there a particular browser that isn’t converting as well as others? Or maybe a particular version? What about comparing Android vs. Apple devices? While you would expect some difference in conversions rates, if you find one particular category isn’t producing as expected, you might have a technical glitch that’s ready for a developer to take a look.”
Here’s an example of the browser report:
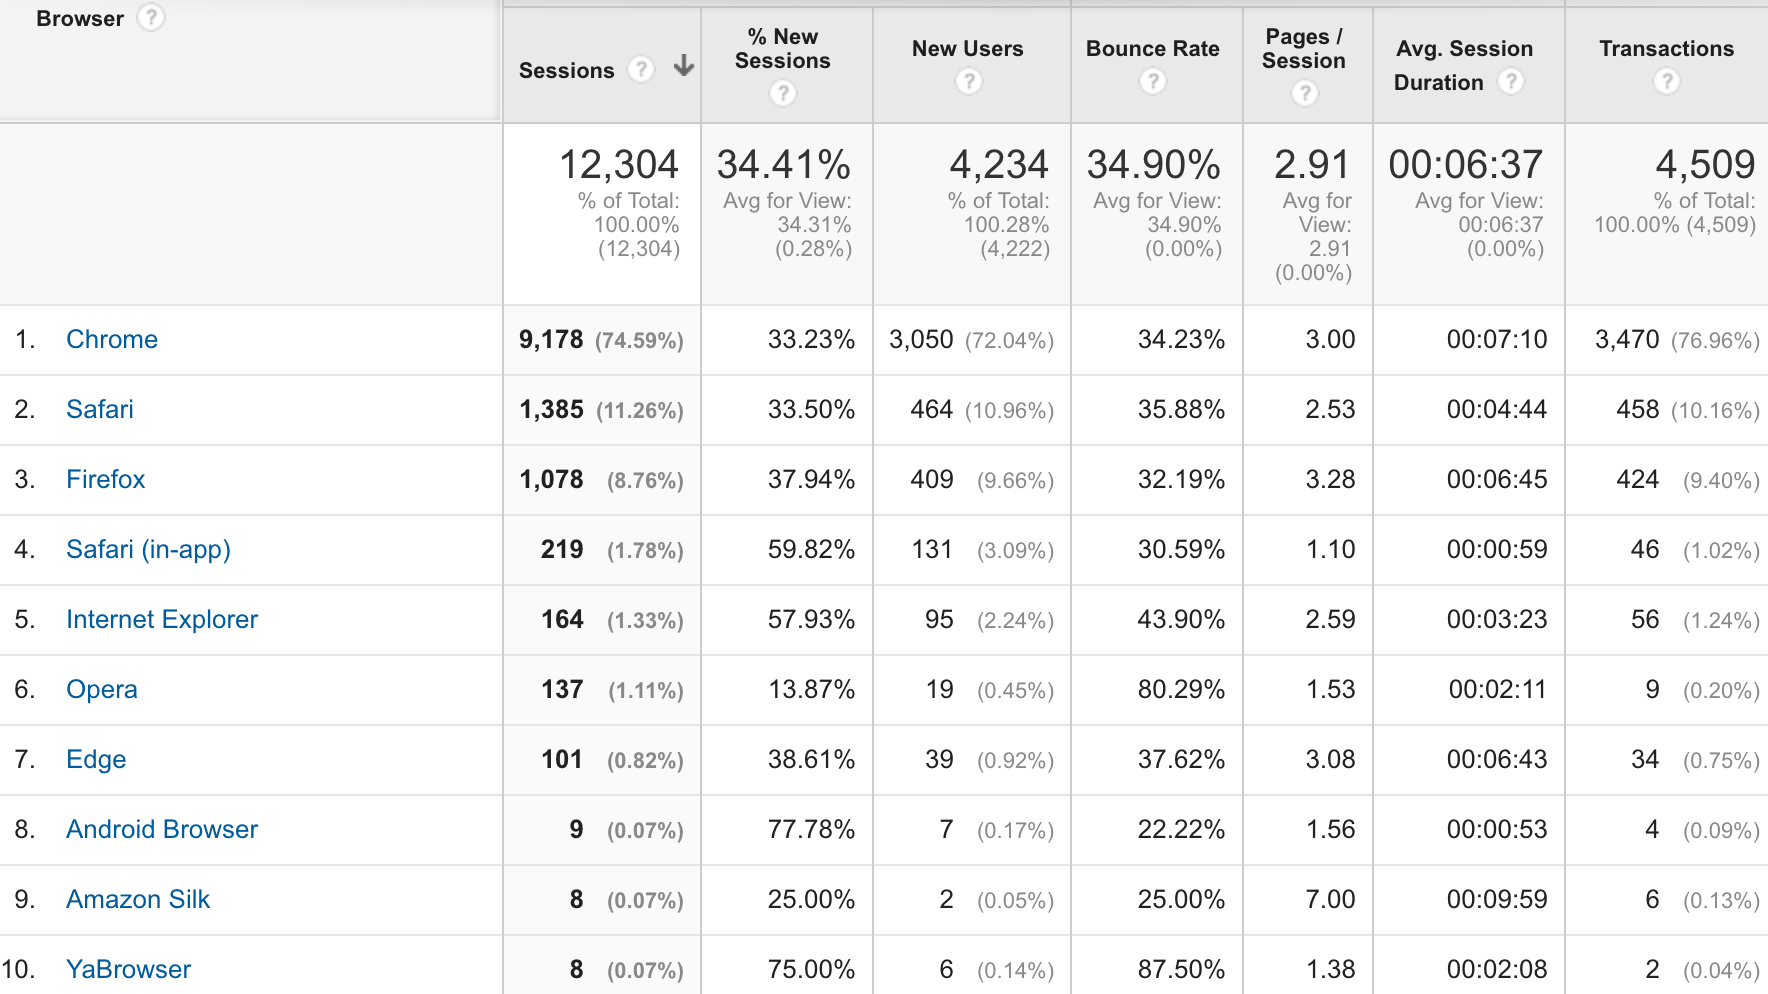
Approximately 37.8% of Chrome sessions result in a transaction. Safari (33%) and Firefox (39%) are about the same. If they were drastically different, you might have uncovered an issue.
You can also drill down and see which browser versions are most important, which can help you spot issues below the surface:
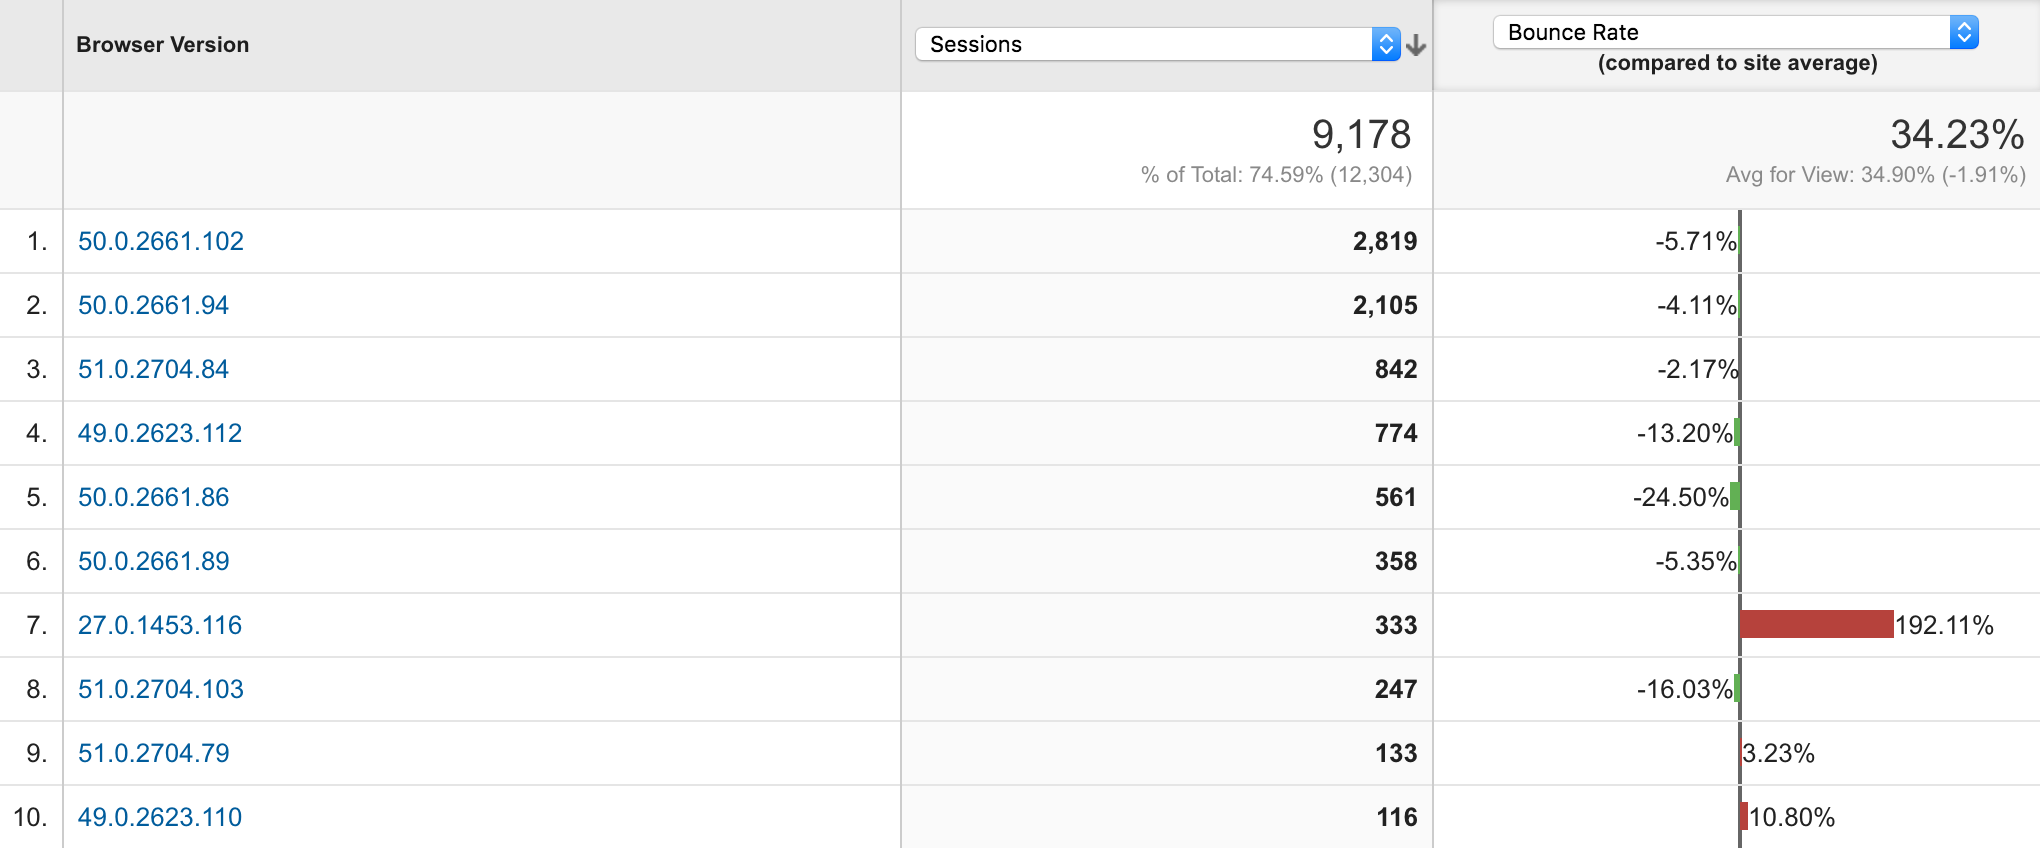
Take a look at Number 7. The bounce rate is through the roof compared to the average. That definitely calls for a closer look, so you’d want to add it to your list.
Don’t leave this quality assurance to your tech team. They will miss things. Check and re-check. Go through every browser, every browser version, every device. In the meantime, you can spot high-value problems based on your current audience.
Step 3: Broken links
A broken link is friction. A visitor linked a link because they wanted X, but instead they got a 404. Disappointing, right?
That’s a big part of the reason you should look for and fix your broken links. Sounds pretty simple, but:
- How many people have landed on a 404 in the last 30 days?
- Are your 404 errors more often the result of an old list or a link that’s never existed?
Many people won’t be able to answer. That’s because while it’s a well-known fact that broken links are bad, most people don’t know how to/want to do much about it.
Mercer suggests one way to get started…
You can find these in your “Behavior” reports (search for page titles that contain “Page Not Found”). Once you have a list of these, you’ll find that some of them aren’t a big deal; others could be an old sales page link that was accidentally deleted and in need of a redirect so that the traffic hits its intended spot.”
Before you begin, ensure that the Google Analytics code is, in fact, on your 404 page. If so, when you search for “Page Not Found” (or whatever the title of your 404 page might be), you’ll see something like this:

When you click through, you’ll see what is, essentially, a prioritized list of 404s to fix:
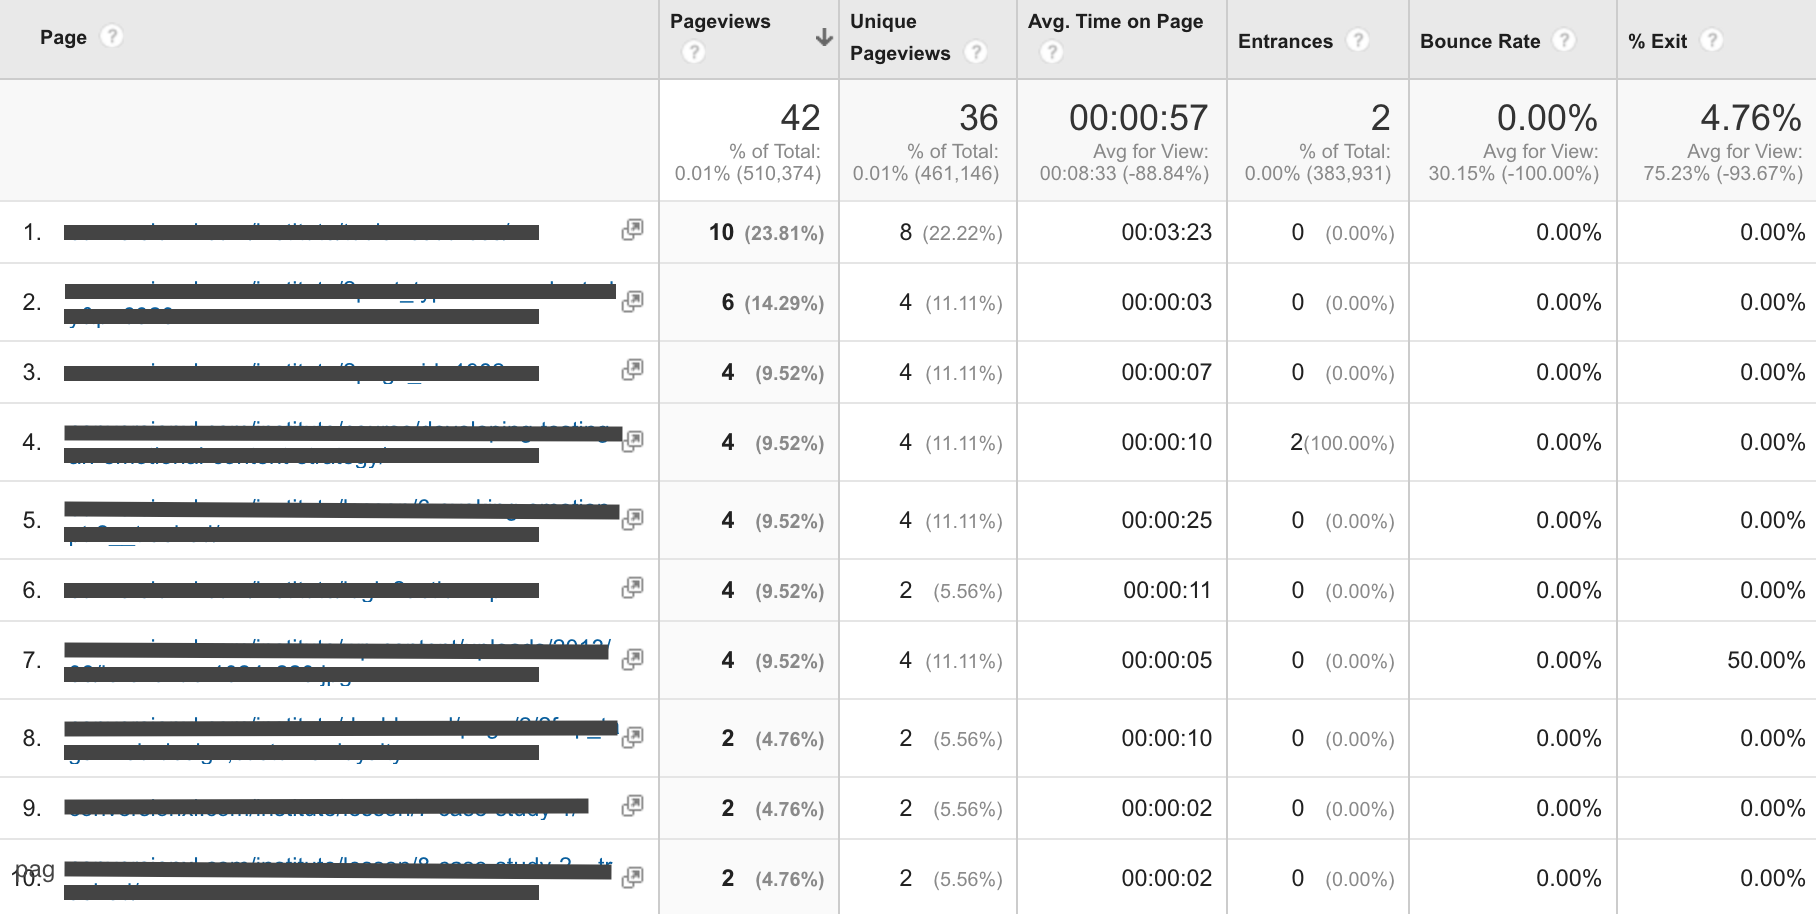
If you want more info, add a secondary dimension for “Full Referrer.” This will tell you the URLs that referred traffic. This can be a huge help, especially if you have external sites triggering your 404s.
As Ian Lurie points out, broken links are also bad for SEO…
Google ranks sites, in part, based on site “quality.” They’ve acknowledged that 404 errors are part of that formula.
You will never be penalized for 404 errors, but you could certainly rank lower. There’s a critical difference – a penalty is enforced because you violated Google’s TOS. You haven’t done that.
But Google will definitely take two actions with that many 404s:
– Crawl your site less often, or at least crawl fewer good URLs, as Googlebot spends time churning through all the 404s.
– Lower your site’s significance from the perspective of user experience. A site with 99k 404 errors doesn’t fit their definition of a good experience.So fixing those 404s is a must.” (via Quora)
Note that form error messages are important, too. We’ve written an entire article on perfecting those and tracking them in Google Analytics, so I suggest taking the time to read it.
You can also use Google Analytics events to track general site errors (e.g., “product out of stock,” “invalid login,” “invalid coupon”).
Step 4: Site speed
This one’s pretty straightforward. Having a slow site kills conversions. We’ve written about it time and time again, so I won’t bother going over it. Just note this rule from Peep:
While a one-second load time would be nice, if you manage to get a load time under three seconds, you’re doing fine. If it’s under seven seconds, it’s okay, too (but you have to improve it). Over 10 seconds and you’re losing money in noticeable quantities.
Yehoshua Coren of Analytics Ninja shows you how to make the case for a faster site in our Beginner’s Guide to Conversion Rate Optimization:
“If you want to make a quick argument to the decision-makers at your company that page load speed really does have a business impact, just compare the “Bounce Sessions” and “Non-Bounce Sessions”.

It should be quickly apparent that users who come to the site and leave are having a poor experience because the site is slow. That is leaving money on the table due to technical issues.
Or compare the page load speed of users who made it through different stages of your conversion funnel.
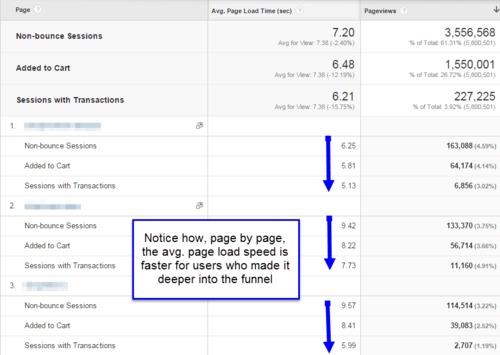
I’ve run this sort of report across dozens of different sites and the results are all very similar. The takeaway is that page load speed makes a difference to the business and now it is time to improve it.”
Basically, to avoid losing money in noticeable quantities, keep an eye on your page load times.
Here’s a super basic example where I simply compare the average page load time of my top pages to the site average:
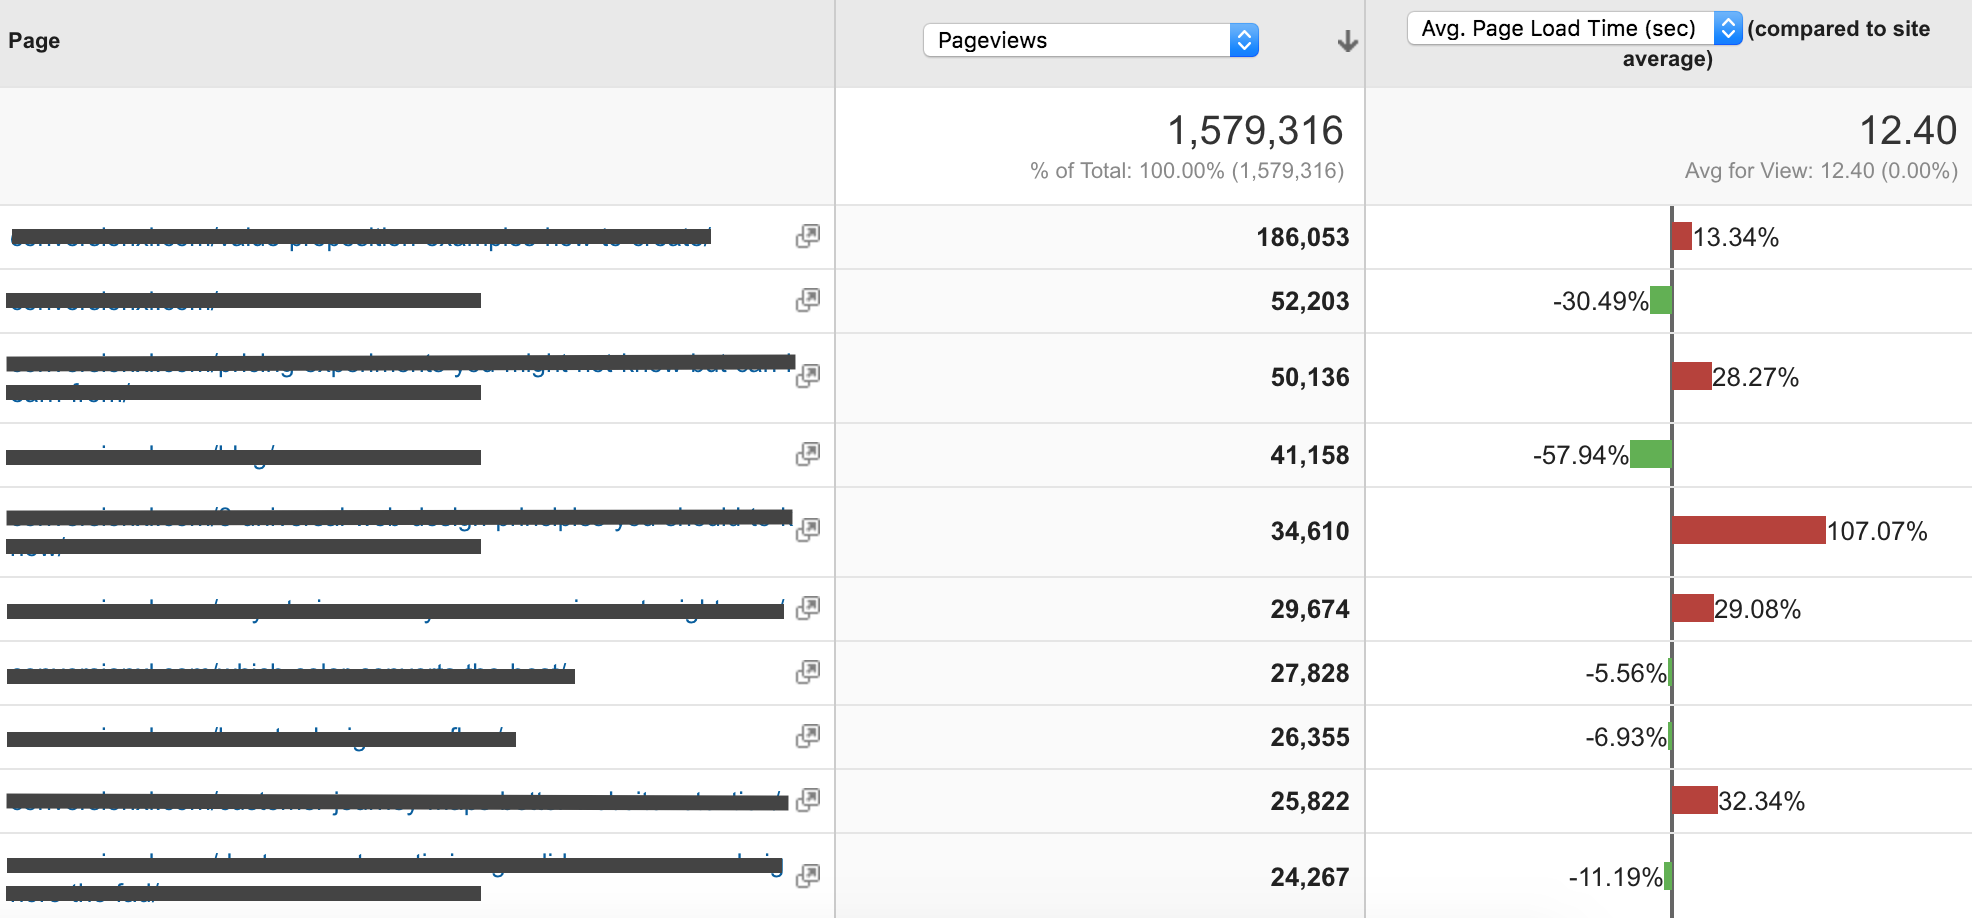
Obviously, there’s some work to be done here. Again, make note of these pages so that you can dig for more clues later.
But you can get way more insight with a little segmentation. Do certain devices have slower load times? Certain countries? Browsers?
Step 5: The funnel
You can use the conversion reports in Google Analytics to identify which parts of your funnel are leaking money (and how rapidly). This will tell you where to focus first and can point you in the right direction for further web analytics analysis.
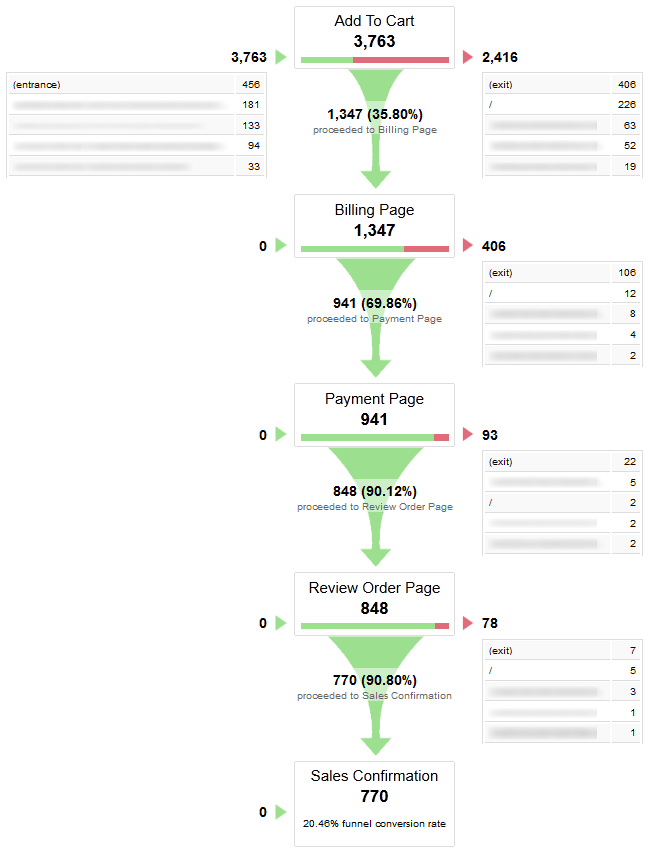
The funnel visualization report looks a little something like this:
Here, it’s clear that the focus should be on the “Add To Cart” step. In your funnel, you may need to focus on the payment page or the review order page—it’ll be different for everyone.
Remember, the further down the funnel you get, the less of an impact you need to make to get a big return.
For example, if you’re an average ecommerce site and you improve the checkout page even slightly, you’ll see a big increase in revenue. If you optimize closer to the top of the funnel, a small improvement won’t have as big of an impact.
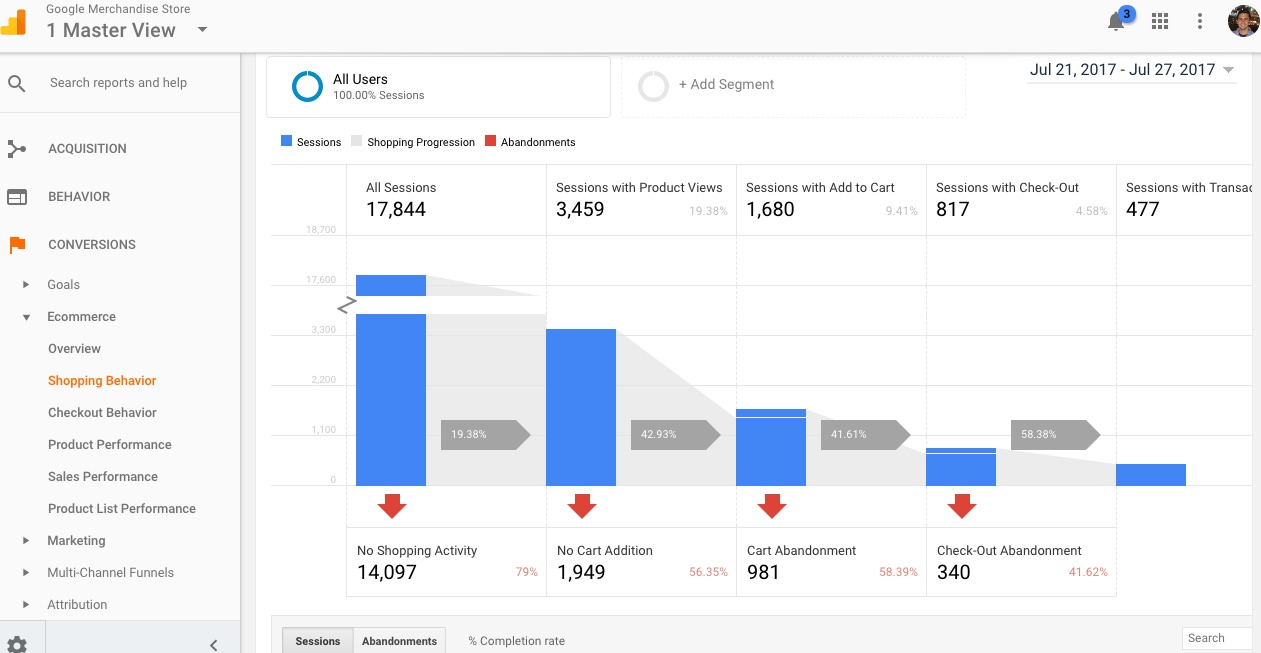
There are, however, quite a few limitations with the typical goal funnel visualization in Google Analytics (including backfilling and the lack of segmentation capabilities). Luckily, most limitations can be surpassed (with enhanced ecommerce) by using the horizontal funnel feature.
These are entirely customizable (to the point that you can use them for things like content engagement tracking), and you can analyze by any custom segment you’d like as well as by dimensions.
Another cool feature of this funnel feature is that, if your Google Analytics account is integrated with Google Ads or DoubleClick, you can create an audience from anyone who abandons a particular step and use them in your Ads campaigns.
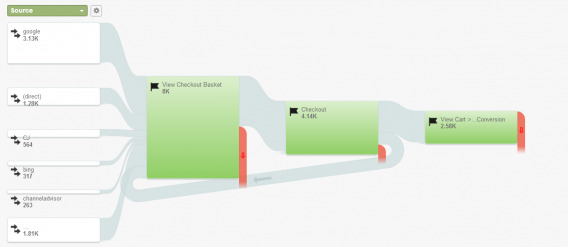
You also have the Goal flow report, which should look something like this:
So, what are the differences?
- The Goal flow report is more flexible.
- You can apply advanced segments, see retroactive data if you add/change a funnel, take full advantage of date comparisons, etc.
- The Goal flow report shows the most accurate path your visitors take before completing a Goal.
- It allows loopbacks, which means that if someone goes from step one to step two and then back to step one, you’ll see it (no exit recorded).
- It also doesn’t backfill steps if the visitor skips a step in the funnel.
- Finally, it shows you the actual order in which steps of the funnel were viewed.
If you’re interested in learning more about these and the many other differences, click here.
The Goal flow report tells you more about the paths people take, where there’s friction, and where to prioritize your digging/optimization.
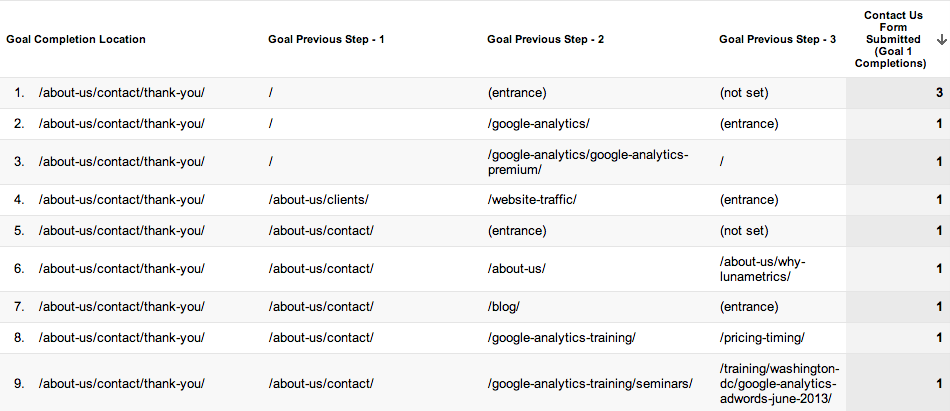
Tip: Always check the reverse Goal path report, which shows you the last three pages the person visited before completing a goal. This can tell you about your most valuable paths, some of which you may not even have considered.
Is there any unusual behavior here? Why might that be?
Step 6: Internal search
If you allow visitors to search your site and you’re not following up on how often they’re using it, what they’re searching for, whether they’re finding it, etc., you’re leaving money on the table. All over the table.
According to Avinash Kaushik, there are five questions worth exploring:
How frequently do users use my search box and what are they looking for?
Where do people begin searches and what do they find?
Are users satisfied with what they find?
How do different groups of users search my site?
What business outcomes result from users searching my site?
The answers to these questions open a lot of doors to explore. Fortunately, it’s pretty easy to navigate all of this in the site search report:
- Frequency. Site Search > Usage.
- Begin. Site Search > Pages.
- Satisfaction. Look at the % Search Exit metric. If it’s high, people are leaving immediately after searching, meaning they likely weren’t very satisfied. Also, look at the Results Pageviews / Search. If this is over 1, people had to dig to find what they were really looking for. (Note: This isn’t always a bad thing; remember the importance of context.)
- Different Groups. Use advanced segments.
- Outcomes. Site Search > Search Terms > Site Search Category (Primary Dimension) > Select the category > Select the Goal tab or the Ecommerce tab.
Here’s an example of the search term report…
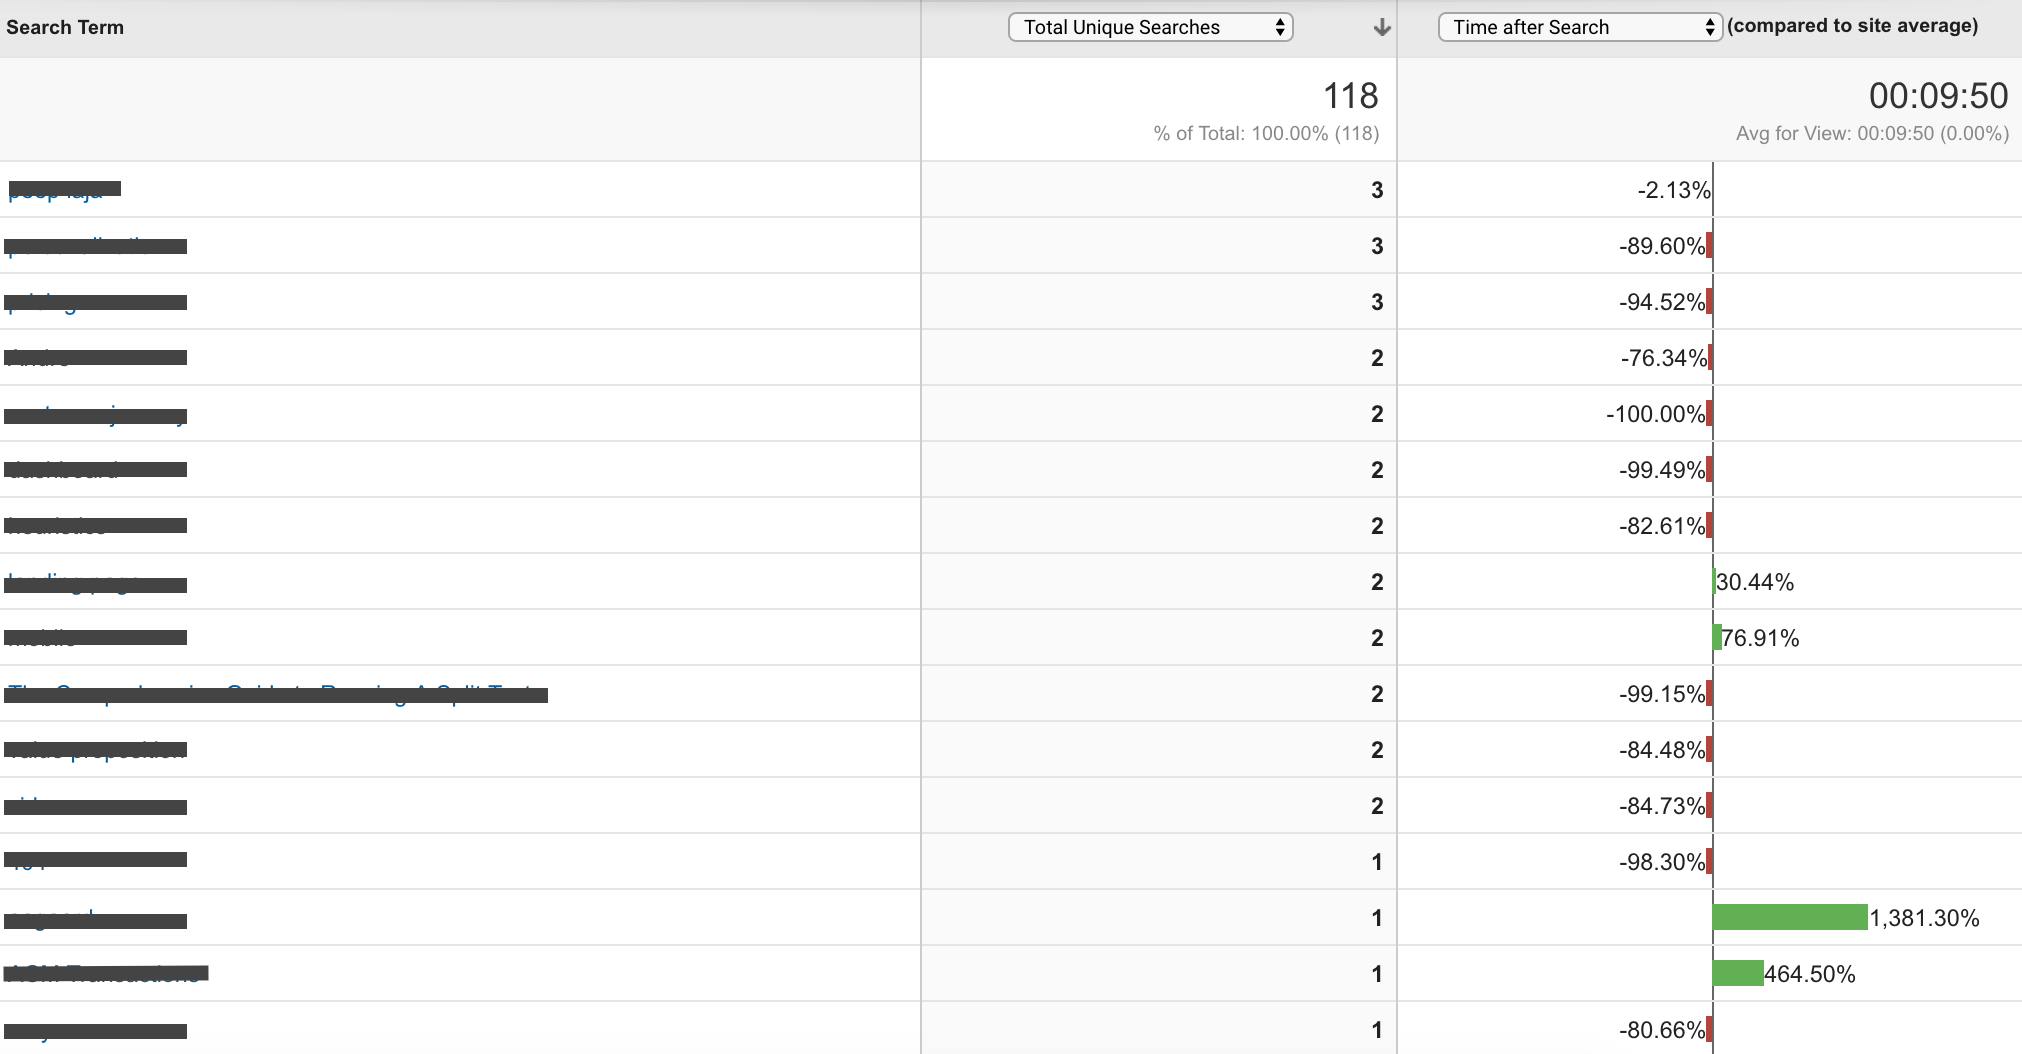
That report is pretty basic, but with a little digging, site search tells you what people are looking for and whether your site is effective in helping them find that. That’s a lot of insight. When you notice something unusual, be sure to note it for later.
Samantha Barnes gives just a few real-world examples of how site search can uncover insights:
“Once you have this tool, you can start to analyze internal search data and begin asking questions like:
- ‘Should we take another look at the usability of our navigation? More than 10% of people are using our site’s search engine.’
- ‘A lot of people from organic channels are looking for terms not related to our business. Why we are ranking for non-relevant keywords?’
- ‘We are seeing trends of certain keywords. Should we feature this content more clearly on the site?’” (via LunaMetrics)
Web analytics segmentation is the real secret
So, we’ve covered a lot. By now, you probably have a pretty big list of suspicious/”bad” parts of your site to explore further, as well as a big list of issues that just plain need to be fixed.
But the truth is that your list will 10x when you really focus on segmentation, which allows you to slice and dice your data to find even more insights.
Sauer gives a great overview of advanced segments:
“Advanced segments and their even more convenient cousin secondary dimensions help you slice and dice your data into meaningful groups of visitors that can be analyzed based on their behaviors.
The goal of segmentation is to take your full website population (100% of visitors) and break them into smaller but more meaningful buckets of people to analyze. In my Analytics Course, I recommend looking at segments that cover 5-50% of your population. Any lower than that and the population is too small to be actionable. More than 50% and your segment will represent your entire population.
What are some segments to apply? Traffic sources, demographics (age, gender and interests), mobile vs. desktop, goals, sales, location, browser, ISP, existing customers vs. prospects, etc.
With segmentation, you may find your conversion rate is low because most of your visitors have already bought from you. Your true conversion rate may be much higher if you exclude customers from the segment. Or you may find out that people can’t physically purchase from your site using Internet Explorer due to a JavaScript error. Segmentation is how you can discover these issues.
For a simple explanation, look no further than this 2 minute video from the great Peep Laja.
When it comes to getting the most out of your analytics package, think of it this way. Never take things as a whole or at surface value. First you slice the data to get a more specific view, and then you dice it by applying segments and secondary dimensions.
Why is this important? Because averages are lies. There is no such thing as an average customer, an average website visitor or an average website experience. Either you convinced someone to convert or you didn’t. There’s nothing average about it.”
I’ve actually written an entire article on advanced segments, As mentioned above, Coren talks about segmentation heavily in his section of our CRO guide. Read those two resources before you continue with web analytics analysis.
As Mercer points out, web analytics analysis goes hand-in-hand with the other steps of the ResearchXL model, like qualitative research:
“Advanced segments can look a little complicated. Once you setup a few segments you’ll quickly find out how powerful they are.
For example, you might create a segment of traffic that is purely from organic search and compare it against your demographics in Google Analytics. Then build a segment of buyers and do the same. Is there a correlation? Do you find that the age groups for organic traffic generally follow the buyers age? Or, as we recently found with a client, do you buyers skew heavily to one age group, while your organic traffic leans to another?
Knowing that, you might run some user surveys to get further insights and adjust your marketing efforts.”
Use custom reports
Also, don’t forget that you can put together custom reports to help you with web analytics analysis. So, don’t get stuck thinking you’re limited to the handful of default reports that Google Analytics supplies.
You can learn about a few key custom reports for optimizers (and how to make your own) by reading 12 Google Analytics Custom Reports to Help You Grow Faster.
Conclusion
Questions lead to more questions, but if you’re asking intelligent ones, eventually they’ll lead you to insights on problem areas and smarter A/B test ideas.
This all gets easier the more often you do it. Why? Because the data itself won’t tell you much of anything—that’s why it’s called web analytics analysis. Spend a few days roaming around Google Analytics, experimenting.
For now, stick to the following process:
- Do a simple walkthrough of your site. Look for suspicious/“bad” parts of the site and signs of poor tracking setup.
- Create a list of questions that will result in actionable answers.
- Conduct a Google Analytics health check to ensure you’re collecting all of the data you need, you can trust the data you’re collecting, and nothing is broken or reporting incorrectly.
- Remember that context is king. You’re a detective digging for clues; you’re looking for irregularities for your site.
- Understand the basic Google Analytics reports and how to get the most insight from them.
- Understand segmentation and how to dive deeper into your data for even more insights.
- Develop your own custom reports.



Well written article and great insights from industry experts. I always use GA and gostats for checking the metrics of the site having 2 tools is more reliable I think whats your say on this?
Thanks John! If you configure Google Analytics properly, you shouldn’t have to worry about reliable numbers, but I suppose it can’t hurt to have a back-up.
Shanelle, Google Analytics is blocked by a lot of users these days for privacy concerns. That’s good enough reason to not trust it 100%. Not only that – there’s the “if it’s free, you’re the product” issue. That’s not a sustainable long term strategy so having alternatives in place is imperative to guard against continuity & monetization of your customer data.
You’re absolutely right about privacy. I talk a lot about the Internet’s growing privacy concern in an upcoming article. However, it’s certainly not just Google Analytics that consumers are learning to block.
As I said, it can’t hurt to have a back-up. But in my experience, a properly configured Google Analytics account is more reliable than most alternatives.
Anyway, what other analytics tools do you use? Would love your opinion.