At a recent SMX Conference, I was asked by the panel moderator (Barry Schwartz), “What is the biggest mistake you notice people making when it comes to their analytics?” After considering the question for a moment, the answer became very clear to me.
People feel overwhelmed by a mountain of data and they don’t know where to start to find insights. “What should I be looking for in my analytics?”, they ask.
My response to Barry was that the first place people should start when it comes to analytics is with business questions. Your analytics data is there for you to learn about your site’s users and their behavior.
Asking a business question and then turning to your analytics for insights will consistently lead you to more success than just clicking around reports, waiting for something to pop out at you.
With that said, I’m going to give you a few tips for finding insights in your data. Spoiler alert: The rest of this email lesson is mainly going to be about segmentation.
BUT DON’T STOP READING NOW!
It’s really not as boring as you may think! In order to answer any reasonable business question you can come up with, you’ll need to “slice and dice” your data to get at the insights. Once you’re familiar with the process of slicing and dicing, I think you’ll find it quite fun. (And it’ll make you $$$.)
Technology
- Objective → Improve user experience (and conversion).
- Question → Are there any indications that user experience differs significantly by device type or browser type?
- Action → Fix technical issues that are hurting user experience.
Let’s start with an example that I oftentimes find has a lot of low hanging fruit → technology.
Cross browser testing, while vitally important, is time-consuming and not every dev team is super diligent about making sure their website works well across different browsers. Let’s be frank: If your site is broken on a certain browser, those people aren’t going to convert.
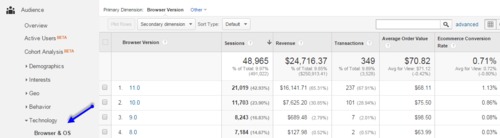
A starting point to get at this data is to use Standard Reports. Audience > Technology > Browser & OS.
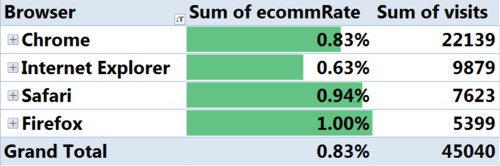
Generally speaking, you will be able to find insights in your data faster and more effectively if you have some way to visualize the data better than the tabular reports in GA.
Exporting your data to Excel or Google Sheets and applying some conditional formatting will make it much easier to find insights.
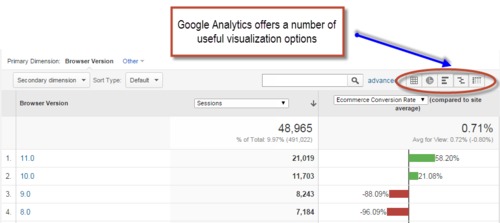
Similarly, using the “comparison” visualization in GA’s reports will help your data “pop out at you”.

In the above example, we see that Internet Explorer 8 and 9 are way off when it comes to conversion rate, and the amount of traffic to the site from those browsers is not insignificant (context!).
In this particular use case, running some cross browser testing on these browsers (the action item) led us to immediately find (and fix) a technical issue that was impeding sales.
Page Load Speed
- Objective → Improve user experience (and conversion).
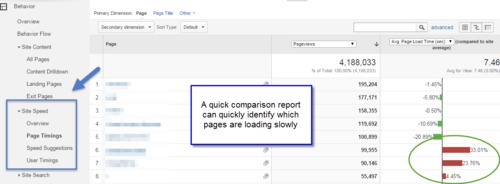
- Question → Are there pages that are loading slowly that I should pay attention to?
- Action → Get IT to improve page load performance.
Another technical issue that can greatly impact user experience (and conversion) is page load speed.
Google Analytics has some good data on how long it takes your pages to load. Although it is not an enterprise-class page speed analysis tool, you’ll be able to approach IT with a list of priorities, which pages to work on and how to tackle the problems.
IT can then use professional development tools to effectively tackle the problems.
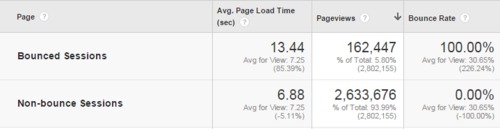
If you want to make a quick argument to the decision-makers at your company that page load speed really does have a business impact, just compare the “Bounce Sessions” and “Non-Bounce Sessions”.
It should be quickly apparent that users who come to the site and leave are having a poor experience because the site is slow. That is leaving money on the table due to technical issues.
Or compare the page load speed of users who made it through different stages of your conversion funnel.
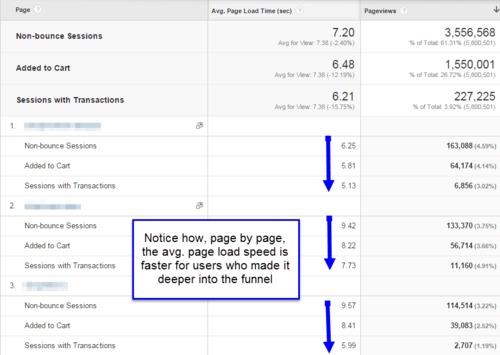
I’ve run this sort of report across dozens of different sites and the results are all very similar. The takeaway is that page load speed makes a difference to the business and now it is time to improve it.
Pro Tip: Use on-the-fly segmentation in your analytics tool often. In the above example, we’re simply comparing sessions where the user did not interact with the site vs. sessions where there was an interaction. The data makes a decently strong argument that page load speed impacts whether or not users stay or leave.
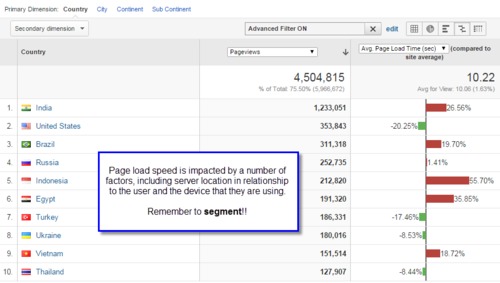
There are a number of different factors that can impact the loading of a page, including: device type, browser type, and the user’s location in relation to the web server. Applying segmentation to your site speed data will allow you to both identify the right pages to work on and in what context.
A core functionality of analytics tools is their reporting on the impact of changes you make to your site. While our current use case is page load speed, this can be applied to any area of optimization.
You’ll want to know what is working, what is not working and how that changes over time. Within our current context, I’ll introduce you to one of my favorite tools in Google Analytics → Motion Charts.
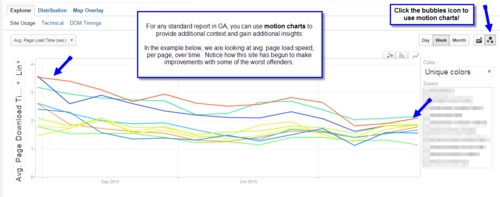
Motion Charts are a great way to spot anomalies in your data as well as see how your data points change over time.
In the above example, page load optimization efforts can be seen on a per page basis. (It is simply a stacked line chart where you can easily isolate an individual page and see general trends over many pages.)
If you were to select a bubble chart, which allows to you apply additional metrics to the graph based upon bubble size and color, you could also correlate this with a “page value” metric as well.
Time of Day / Day of Week
- Objective → Make the biggest impact from marketing efforts.
- Question(s) → Are there optimal times to send out your email newsletter? What times of day should you boost CPC in paid search? Are there best times to post to social media?
- Action → Deliver your marketing messages at the ideal time.
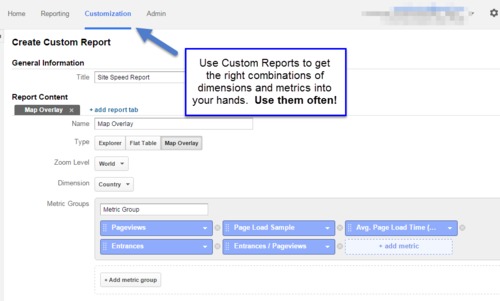
Google Analytics can help you determine how your site performs at different times of the day and on different days of the week. In order to access this data, you are going to need to create a custom report and export your data into Excel.
You can download a copy of the report here.
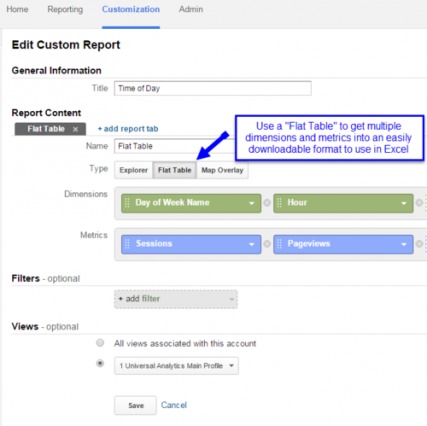
If you were to create report yourself, you would first create a custom report and choose Flat Table. Your dimensions will be Day of Week Name and Hour.
Now, add metrics such as Sessions, Pageviews and Conversion Rate (for goals or ecommerce).
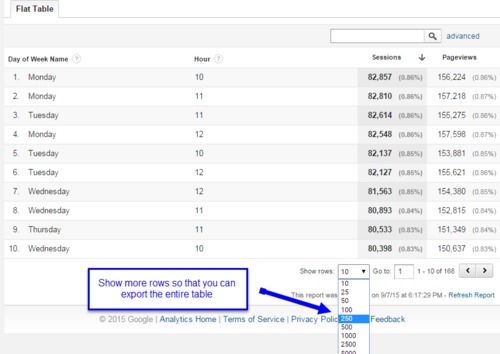
In order to download all the rows of the report, you will need to “Show Rows” at the bottom of the table. Then export to Excel.
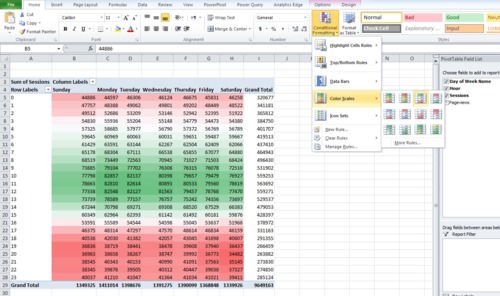
Once you have your data in Excel, you’ll need to create a pivot table. Apply some conditional formatting and VOILA! An awesome heatmap of your Google Analytics data.
Pro Tip: Add Channel or Source/Medium to your dimensions in the flat table to be able to segment your traffic volume and conversion rate by traffic source.
Conversion Funnels
- Objective → Increase the number of conversions.
- Question → Where are users dropping out of my funnel?
- Actions → Improve conversion funnel flow & “smart” remarketing to get the right message to the potential customer at the right time.
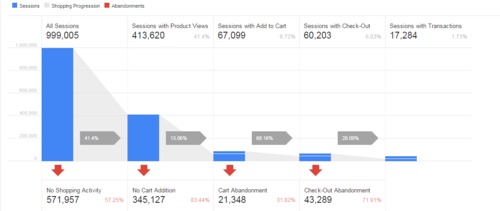
A key area you should be looking at to find insights is your conversion funnel. The conversion funnel describes a set of steps that the user must progress through in order to complete a desired action on your site.
For a B2B lead gen site, it could be something as simple as seeing a contact form to submitting that form. For ecommerce sites, it is usually the checkout process from adding an item to cart to purchase.
While this email lesson is not focused on the setup of your analytics as much it is about finding insights, I do want to note that if you aren’t collecting useful data you aren’t going to be able to find many insights.
With regards to conversion analysis, that means that you must have goals and funnels properly configured.
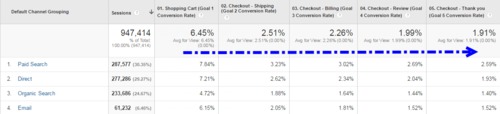
By setting discrete goals / metrics in your analytics tool for each stage in the funnel, you’ll be able to easily segment your funnel by any dimension. This was coined by John Henson as using “horizontal funnels”. The idea is to look for dropoff points in the funnel; these are the areas to focus on.
My friend Peter O’Neill wrote a recent post where he discusses how configuring calculated metrics can really help provide insights about where to take action. In his words:
“Knowing that your Conversion Rate is lower for segment X vs segment Y is not that valuable. Knowing that two dimension values behave exactly the same except for one stage in the funnel pinpoints where you have to take action.”
The thing I like about analysis using horizontal funnels is that you are able to segment your funnel using custom reports by any number of useful dimensions. In the above image, we’re segmenting the funnel by Channel.
However, your report can be configured to analyze:
- Landing Page Type
- A/B Test Variation
- New vs. Returning Users
- Geo-Location
- Device Type
- Browser Type
- Etc.
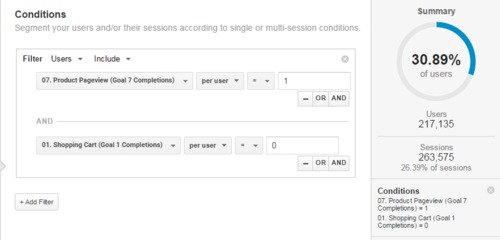
Another approach to finding insights in your conversion funnel is to create segments for users who dropped off somewhere in the process. Some ecommerce examples include:
- Viewed product, but did not add to cart.
- Added to cart, but did not begin checkout.
- Began checkout, but did not purchase .
The conditional logic for creating these segments is fairly straightforward.
Once you create your segment, you then proceed to explore (yup, more segmentation). Which traffic sources did these users came from? What landing pages did they arrive on? What products were they looking at? What were their geographic locations?
One particularly powerful function that I love about Google Analytics is the ability to take any of these segments and add it directly to an Ads Remarketing List (which works both for display and remarketing lists for search).
As you segment (and micro-segment) your traffic, you will be able to build smart audience lists so that you can get the right message to your potential customers at the right time.
So instead of just spamming the Internet with display ads to all of the people who have visited your site, you can show relevant messaging to users based upon where they were in their customer journey. (And ensure you don’t alienate your acquired customers by continuing to show them your ads.)
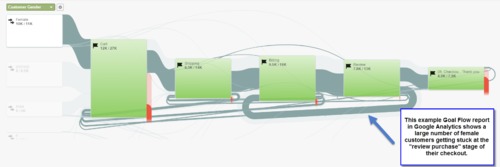
Conversion funnel analysis is great for discovering areas of the funnel that need fixing (often technical / motivational).
In the image below, notice how users are bouncing back from the “review order” page (they’ve already entered their credit card number!) to the billing page.
It is worth noting that quantitative analytics tools (like Google Analytics or Adobe Analytics) will only be able to model user behavior (what they’re doing), but will not be able to tell you “why” users behave in a certain fashion.
For that, you’ll need qualitative tools such as surveys or session recordings. As such, analytics tools are of great value to help guide exactly where / how to deploy the qualitative tool.
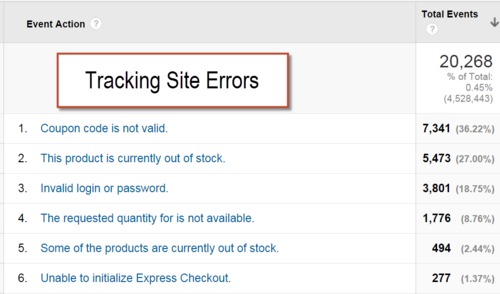
One exception to the above rule regarding analytics tools is with regards to error tracking. If you’re tracking error messages on your site, you can get a pretty good idea as to “why” users are dropping out of your funnel.
Summary
Digital media allows us to measure user behavior in an unprecedented way. The impact of marketing efforts, UX decisions, landing pages and A/B testing variations can be measured with great precision.
Finding insights in your analytics data ultimately requires you to segment your data as, quoting Avinash Kaushik, “all data in aggregate is crap”.
In order to provide you with some direction as to where to start, I recommended looking at:
- Device and Browser Type
- Page Load Speed
- Day Parting
- Conversion Funnels
As part of exploring those different areas, I shared some important techniques for how to go about finding insights. These revolved around:
1. Data Visualization
- Exporting data to a spreadsheet and applying conditional formatting.
- Using comparison toggles in your analytics tool.
- Using Motion Charts (for Google Analytics).
2. Using your tool’s ad hoc segmentation capability.
- Bounce vs. Non-Bounce Sessions.
- Users who complete discrete actions on your site.
- Users who drop out of your conversion funnel.
Analytics is both the way that you will measure the success (or failure) of your efforts online as well as a treasure trove of information that will inform your business decisions.
If you have any questions or would like to learn more, please feel free to reach out to me via email ([email protected]) or on Twitter (@analyticsninja).
Takeaways
- When looking for insights, start with a few core objectives and a list of business questions. Don’t expect insights to pop out at you.
- Export your Google Analytics data to Excel. You can easily create heatmaps and otherwise visualize your data to discover insights you might’ve missed in a tabular report.
- Conversion funnels are high value. You’ll be able to spot changes in behavior as visitors move through the funnels, which will show you exactly where to focus your optimization efforts.
For more from Yehoshua, check out Analytics Ninja.
Read Next Lesson or Download guide as PDF
-
Introduction to Conversion Optimization by Brian Massey
Copywriting, A/B testing, analytics, psychology... we'll cover it all. But first, Brian Massey, the Conversion Scientist, reminds you of the basics. -
How to Write Copy That Sells Like a Mofo by Joanna Wiebe
Joanna Wiebe of Copy Hackers and Airstory on how to write copy that converts like crazy. -
Introduction to Designing for Conversions by David Kadavy
David Kadavy, author of Design for Hackers, on designing for conversions. He debunks today's biggest design myths and tells you what actually matters. -
How to Use Psychology in Conversion Optimization by Bart Schutz
Bart Schutz of Online Dialogue and The Wheel of Persuasion on using psychology to increase conversions. -
Emotional Targeting 101 by Talia Wolf
Talia Wolf of Conversioner talking emotional persuasion. Building on what we learned from Bart, she explains how to appeal to your visitors' emotions. -
How to Build a List and Send Emails That Convert by Justine Jordan
Justine Jordan from Litmus walks you through collecting emails, improving your open rate, designing for all browsers / devices / email clients, A/B testing emails and more. -
How to Setup Analytics and Measure the Right Stuff by Chris Mercer
Chris Mercer from SeriouslySimpleMarketing.com on how to setup your analytics in a meaningful way that ensures you're gathering useful data. -
How to Use Analytics to Find Insights by Yehoshua Coren
Yehoshua Coren, the Analytics Ninja, walks you through extracting insights from your analytics using segmentation. -
How to Gather Qualitative Data for Insights by Jen Havice
Jen Havice of Make Mention on how to use qualitative research to answer one of the most important questions in conversion optimization: Why? -
What to Test (Conversion Research) by Michael Aagaard
Michael Aagaard, senior conversion optimizer at Unbounce, on how to strategically decide what to test using conversion research. -
How to Run A/B Tests by Peep Laja
Peep Laja teaches you everything you need to know to run valuable, statistically valid tests that will actually lead to applicable insights. -
How to Create a CRO Process by Peep Laja
Peep on how to combine everything you've learned into a systematic, repeatable CRO process.