Propensity modeling helps marketers estimate how likely a visitor, lead, or customer is to take a future action—buy, convert, churn, unsubscribe, or move to the next stage of the funnel.
Instead of only looking at what already happened, a propensity model turns historical and behavioral data into a probability score that helps you decide where to focus next.
This is becoming a much more practical part of modern marketing. Nielsen’s global marketing research found that 46% of companies use predictive analytics, while 44% use AI for customer segmentation.
But the prediction itself isn’t the valuable part. What matters is what you do with it: prioritize the right customers, create better-defined segments, identify where an intervention might matter, and test whether that intervention actually improves the outcome.
This guide explains how propensity modeling works, how to build and validate a model, where marketers can use it, and where it can go wrong.
TL;DR
- Propensity modeling predicts the probability that a visitor, lead, or customer will take a specific action, such as converting, buying, unsubscribing, or churning.
- A propensity score is a prediction, not proof of causation. A model can tell you who is likely to act, but not necessarily what caused that behavior.
- Good models depend on reliable historical data, a clearly defined outcome, and features that are available before the outcome occurs.
- Logistic regression remains useful because it produces probability estimates, but other machine learning models can also be used. What matters is whether the predictions generalize and are properly calibrated.
- Use propensity scores to prioritize audiences and inform experiments. Validate predictive performance on unseen data, then use experimentation to test whether acting on the prediction creates incremental impact.
Table of contents
What is propensity modeling?
Propensity modeling is a predictive analytics technique that estimates the probability that a person will take a specific action based on historical and behavioral data.
The output is typically a propensity score, for example, the estimated probability that a lead will convert, a customer will churn, or a subscriber will unsubscribe.
What does propensity mean?
Propensity means a tendency or likelihood to behave in a particular way. Oxford English Dictionary defines propensity as a tendency to a particular kind of behavior. For example, a CrossFit lover might have a propensity for drinking protein shakes.
What does a propensity model predict?
A propensity model predicts the likelihood of a defined outcome for each visitor, lead, or customer. That score can then be used to rank people, create segments, or decide where an intervention is worth testing.
So, for example, a propensity model can help a marketing team predict, through data science or machine learning, the likelihood that a lead will convert to a customer. Or that a customer will churn. Or even that an email recipient will unsubscribe.
Why should marketers and optimizers care about propensity modeling?
Propensity models help marketers decide where attention is most likely to matter. They can identify high-intent leads, flag customers at risk of churning, prioritize retention efforts, and create more meaningful segments for experimentation.
The same way SEO experts need to understand a bit of content marketing and HTML to be competent, optimizers need a basic understanding of statistics and propensity models.
But why should optimizers care about propensity modeling when there’s testing and experimentation?
Tim Royston-Webb, CEO of SentryBay, offers a few reasons:
The thing is that we can’t always rely on these statistical methods in the real world. There might be several scenarios where real experiments are not possible:
Tim Royston-Webb
- sometimes management may be unwilling to risk short-term revenue losses by assigning sales to random customers.
- a sales team earning commission-based bonuses may rebel against the randomization of leads.
- real-world experiments may be impractical and costly in certain cases when the same data or participants can be modeled through quasi-experimental procedures or when historical data is enough to produce actionable insights.
- real-world experiments may involve ethical or health issues, for example, studying the effect of certain chemicals.
Should you use propensity modeling instead of experimentation?
No. Propensity modeling predicts what is likely to happen, while experimentation tests whether an intervention causes a different outcome. The two work best together.
Even if you don’t face any of the experimentation challenges that Royston-Webb mentions, propensity modeling can help you:
- Fill your pipeline;
- Save time on quantitative conversion research;
- Explore smarter segmentation options.
How do you build a customer propensity model?
Start by defining the outcome you want to predict, selecting features that are available before that outcome happens, training the model on historical data, and checking how well it performs on data it has not already seen.
The exact model matters less than whether it produces reliable predictions for the business problem you are trying to solve.
As Mojan Hamed, Data Scientist at Shopify, explains, there’s no shortage of options to choose from, and none are inherently superior:
The first step is to actually pick a model because you have a few options. For example, instead of measuring propensity to churn, you could choose a survival analysis.
Regression is a good option because it’s very interpretable for non-technical audiences, which means it can be communicated easily.
It’s also less of a black box, making the risk more manageable. If something goes wrong and accuracy is low or you get an unexpected result, it’s easy to drill down to the formula and figure out how to fix it.
Mojan Hamed
For example, if you’re forecasting and notice some segments do well with the base models while others do not, you can dig deeper into those low-accuracy segments to identify the issue. With regression, the whole process won’t take more than a few minutes. With other models, that diagnosis is more time-consuming and complex.
Once you’ve selected the model that’s right for you (in this article, we’ll focus on regression), building it out has three steps:
- Selecting your features;
- Constructing your propensity model;
- Calculating your propensity scores.
Let’s explore each step further.
1. Which features should you include in a propensity model?
Start with variables that could reasonably help predict the outcome and that are available at the point when the prediction will actually be made.
These might include:
- Product milestones;
- App and theme downloads;
- Demographics;
- Device usage;
- Buying history;
- Plan selection.
More features do not automatically make a better model. Irrelevant or redundant variables can add noise, increase model complexity, and make it harder for the model to generalize to new customers.
You also need to watch for data leakage. A feature should not reveal information that would only become available after the outcome you are trying to predict.
Start with features that make sense based on the business and customer journey, then evaluate whether they improve performance on unseen data.
Train the model on historical data, but evaluate it separately on data the model has not seen before. Where customer behavior changes over time, a later time period can also provide a useful holdout because it more closely resembles how the model will perform when predicting future behavior.
The goal isn’t to build a model that explains the training data perfectly. It’s to build one that continues to make useful predictions when new customers and new behavior appear.
Whether you’re interested in interpreting the coefficients or not, one thing is certain: You’ll need to gather insight from internal experts. Despite popular belief, propensity modeling does not diminish the need for business and marketing know-how.
So, gather a room full of domain experts: email marketers, conversion optimizers, data scientists, finance experts, CRM specialists—anyone with relevant business acumen.
There are numerous mathematical ways to decide which features to select, but they can’t replace human knowledge and experience.
2. How do you construct a propensity model?
A propensity model learns the relationship between the features you provide and the outcome you want to predict.
Regression is one option, but it is not the only one.
Jim Frost, founder of Statistics by Jim, explains:
In regression analysis, the coefficients in the regression equation are estimates of the actual population parameters. We want these coefficient estimates to be the best possible estimates!
Suppose you request an estimate—say for the cost of a service that you are considering. How would you define a reasonable estimate?The estimates should tend to be right on target. They should not be systematically too high or too low. In other words, they should be unbiased or correct on average.
Recognizing that estimates are almost never exactly correct, you want to minimize the discrepancy between the estimated value and actual value. Large differences are bad!
These two properties are exactly what we need for our coefficient estimates!
Jim Frost
For the purposes of this article, you’ll want to be familiar with linear and logistic regression.
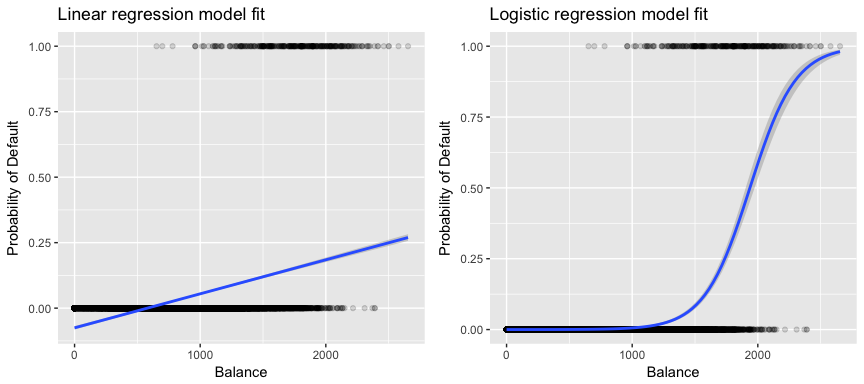
Linear regression predicts continuous numerical values. Logistic regression predicts the probability of a categorical outcome, making it particularly useful for binary questions such as whether someone will convert or churn.
Other machine learning models—including tree-based models—can also generate probability estimates. More sophisticated does not automatically mean better: the model still needs to perform well on unseen data and produce probabilities you can trust.
For marketers, interpretability matters too. A slightly less powerful model you can understand, debug, and explain may be more useful than a black box with marginally better predictive performance.
3. How do you calculate propensity scores?
Once the model is trained, it assigns each customer or prospect a predicted probability for the outcome you defined.
For a logistic regression model, that probability is constrained between 0 and 1. A score of 0.80, for example, represents an estimated 80% probability of the target outcome under the conditions captured by the model.
That number still needs to be validated. A model can rank customers reasonably well while producing probability estimates that are poorly calibrated.
Hamed explains:
In a linear regression model, it literally multiplies the coefficients by the values and gives you a continuous number. So, if your formula is
customer_value=0.323(sessions per month), where0.323is the coefficient for your sessions per month, it multiplies the number of sessions you had that month by 0.323.For logistic regression, the predicted value gives you a log-odds and the calculation can convert it to a probability. This probability is what we interpret as the “score.”
Mojan Hamed
Again, propensity modeling is a tool at an optimizer’s disposal, not a replacement for a thorough understanding of experimentation and optimization. Take advantage of how open regression is, look under the hood and ensure the data you’re seeing makes sense before running wild with it.
How do you validate a propensity model?
A propensity model is useful only if it continues to predict customer behavior outside the data it was trained on.
Start by evaluating it on unseen data. Depending on the use case, metrics such as precision, recall, ROC AUC, lift, and log loss can help you understand whether the model separates likely responders from unlikely ones.
But ranking customers correctly is only one part.
You should also check calibration. If a well-calibrated model gives 100 customers a score of roughly 0.70, you would expect around 70 of them to experience the predicted outcome over time.
Finally, measure what matters commercially. A statistically stronger model is not automatically a more valuable one. If using the score does not improve targeting, retention, conversion, or another relevant business outcome, better model metrics alone do not justify it.
Model performance should also be monitored after launch. Customer behavior, acquisition channels, pricing, products, and market conditions change. A model that worked six months ago can become less useful as the underlying data changes.
How should marketers use propensity scores in experimentation?
Use propensity scores to identify where an experiment may be valuable, not to determine why a customer behaved in a particular way.
A high conversion propensity tells you that someone is more likely to convert. It does not prove that any individual feature in the model caused the conversion. Correlation is not causation.
For example, a model might accurately identify customers who are likely to churn. You could then run a retention experiment within that group to see whether an intervention actually reduces churn compared with a holdout group.
This is where propensity modeling and experimentation work together: the model identifies where an intervention may matter, while the experiment measures whether the intervention actually changes the outcome.
Propensity modeling is a tool at an optimizer’s disposal, not a replacement for experimentation or optimization expertise. Use the prediction to make a better decision about what to test, then measure whether that decision produces incremental impact.
The 3 most valuable propensity models
Three propensity models are particularly useful for marketers: propensity to buy or convert, propensity to unsubscribe, and propensity to churn.
- Propensity to buy or convert. How likely are visitors, leads, and customers to make a purchase or convert to the next step of the funnel? Those who have a lower propensity score need more incentives than others (e.g. you might offer a higher discount if you’re an ecommerce store).
- Propensity to unsubscribe. How likely are recipients, leads, and customers to unsubscribe from your email lists? To those with a higher propensity score, you might try reducing the frequency of emails or sending a special offer to reinforce the value of remaining a subscriber.
- Propensity to churn. Who are your at-risk leads and customers? If they have a high propensity score, you might experiment with in-product win-back campaigns or assign account concierges to reconnect them with your core value proposition.
Propensity modeling is not prescriptive. Knowing that a group of leads has a higher propensity to convert alone is not particularly valuable. What’s valuable is combining that knowledge with optimization know-how to run smarter, more targeted experiments and extract transferable insights.
Frequently asked questions about propensity modeling
What is a propensity score?
A propensity score is the predicted probability that a person will take a specific action, such as converting, churning, or unsubscribing.
What data is used in propensity modeling?
Propensity models can use behavioral, transactional, demographic, CRM, product usage, and engagement data to predict a defined outcome.
What is the difference between propensity modeling and lead scoring?
Propensity modeling uses historical data to predict the probability of an outcome. Traditional lead scoring often assigns points using predefined rules.
Is propensity modeling the same as propensity score matching?
No. Propensity modeling predicts the likelihood of an outcome. Propensity score matching is a causal-inference technique used to create more comparable treatment and control groups.
Can propensity modeling predict customer churn?
Yes. Churn propensity models estimate which customers are most likely to stop buying, cancel, or leave.
Do you need machine learning for propensity modeling?
Not necessarily. Logistic regression can produce propensity scores, while more advanced machine learning models can also be used.
What should marketers do next?
Start with the skills that determine whether propensity models can be built, interpreted, and used effectively: AI workflows, analytics, and experimentation.
Build AI workflows around your marketing data: CXL’s AI Native Marketer program teaches marketers how to build working AI systems around research, analytics, reporting, experimentation, and other marketing workflows.
Strengthen your analytics foundation: The Digital Analytics Minidegree covers data collection, analytics, BigQuery, GA4, attribution, and turning marketing data into decisions.
Get the statistics behind experimentation right: Statistics for A/B Testing covers statistical significance, statistical power, sample sizing, multiple outcomes, and interpreting experimental results correctly.
Related Posts
-

Mediocre marketing teams guess: "Our latest run of Facebook ads seems to be working." Good…
-
Design impacts behavior. If you know how to impact behavior, you can design for behavior.…
-

You have your CRM, web analytics, email marketing tool, payment processors, survey tools and so…
-

Do you need to be a big company and need large volumes of traffic to be data…