
“You have to spend money to make money.”
This seemingly good-natured advice has spelled doom for millions of businesses worldwide.
While it’s true that businesses occasionally need to spend more upfront to validate their idea, doing so with a complete disregard for unit economics can be fatal.
That’s why Customer Acquisition Cost (CAC) is such a critical metric. It’s the single most important indicator to prevent reckless spending. In this post, we’ll show you how to calculate CAC, plus share a few tips to help you maintain it at a healthy level.
Table of contents
How to calculate CAC
CAC can be calculated with the following formula:
Total Spend on Acquiring Customers / No. of Customers Acquired
But “Total spend on acquiring customers” can be ambiguous. In most cases, it includes:
- Salaries of sales and marketing teams
- Advertising spend on acquiring new customers (Search/Display Ads, Social Ads, Sponsorship, etc.)
- Cost of software/hardware used in sales and marketing
- Agency, PR, or any third-party costs involved in sales and marketing
The sum total of these costs divided by the number of new customers gives you CAC. Here’s how this could look for Company A over a 3 month period:
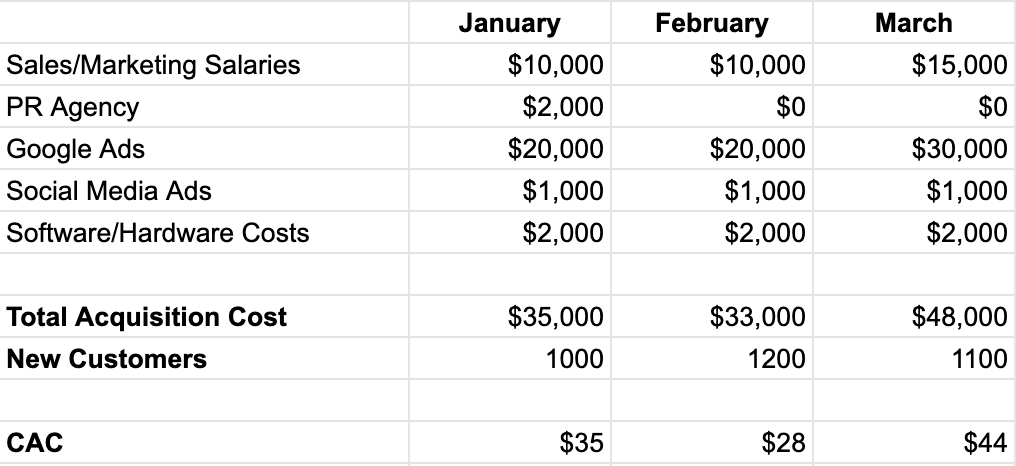
In March, for example, CAC is:
$48000/1100 = $44
But what if your product offers a free trial and your data team tells you it takes 30 days on average for “free trial users” to become paid customers. That would mean the 1100 new customers in March are the result of February’s acquisition cost.
Therefore, you need to attribute revenue by their monthly cohorts rather than when they converted in order to properly measure ROAS.
This calculation will get more complex for free trials of other durations, such as 14 days. Here, ROAS would be partially influenced by the acquisition cost of both the existing and previous month:
CAC for March (14 day free trial) = [(48000 + 33000)/2]/1100 = $37.
And what if your product is freemium (i.e. users can use your app for as long as they want until they feel the need to upgrade)?
The freemium version influences acquisition of new users. Some businesses even include a portion of freemium development costs (such as server maintenance) in their CAC. However, many leave it out for the sake of simplicity.
Freemium users also have a much longer conversion funnel or “penny gap” compared to free trial users.
For example, Mailchimp’s freemium plan gives you basic features with 2,000 subscribers and 12,000 emails per month. As it might take a while to cross that threshold, you need accurate data to learn when each customer was first engaged. This will help you attribute the conversion to the correct acquisition cost.
Another common problem is how to calculate returning users. A popular way is to include the cost of re-engagement campaigns in the acquisition cost. This way, you won’t have to segment new customers.
But for more accurate data, calculate CAC separately for new and returning users. Re-engaging is often cheaper than acquiring new users and clubbing the two acquisition costs together might give a rosier view of your CAC.
The key takeaway? Understand whether a cost directly influences new (and returning) customers. If so, include it in your acquisition costs.
But CAC only tells you how much it costs your business to acquire one purchase. Lifetime value (LTV) gives you a more accurate understanding of your CAC efforts.
LTV/CAC – Understanding the golden metric
Often touted as the north star for businesses, LTV/CAC is the single most important metric to gauge business health.
Lifetime value refers to the total amount a customer is expected to bring in during their stay with your business. Here’s how you calculate LTV:
[ARPC (Average Revenue Per Customer in a Month) X Gross Margin] / MRR Churn Rate
CAC tells you how much a new customer costs. LTV explains how much a customer is worth. That’s why the LTV/CAC ratio provides a holistic view of your business.
For example, say CAC of Company A increased from $30 to $40 in one year. Whether this should worry stakeholders would depend on the change in the lifetime value during the same period. If the lifetime value increased by more than 33%, the overall LTV/CAC ratio would increase, which is a great sign for the business. Therefore, an increase in CAC isn’t always bad news.
According to most experts, the LTV/CAC ratio should be at least 3 for a sustainable business (i.e., a new customer should bring at least 3X value of what they cost to acquire).
LTV/CAC of less than 3 is a red flag as it indicates you’re overspending on acquisition. It’s a sign that you need to review CAC of your prominent channels and look at the growth marketing funnel to understand where the fault lines are.
The opposite is also true: three or higher means you can afford to spend more aggressively to acquire new customers.
Note that LTV/CAC ratios can fluctuate month on month due to specific investments. So, you should look at overall trends rather than isolated instances.
For example, on-demand graphic design service Manypixels ran a 40% discount at the beginning of the year on its subscriptions:
This would directly impact the lifetime value of users signing up in the discount period by reducing the Average Revenue per Customer. But that shouldn’t be a cause of concern because discount periods are expected to impact revenue-related KPIs.
Using CAC to make key strategic growth decisions
Let’s come back to CAC and explore how it can help you make key strategic growth decisions.
Segmenting CAC to prioritize channels
CAC is only one metric, but you can use it to understand how your message resonates with different customer segments and which customer segments get the most value from your product or service. This helps you justify marketing spend and discover new markets.
For example, let’s say your CAC is $100 and LTV is $250, giving an LTV/CAC ratio of 2.5.
While this is less than 3, it still doesn’t give the full picture. Suppose your product is selling in multiple countries. In that case, you should calculate CAC separately for all of the markets you’re in.
Maybe in certain markets, CAC is low while LTV is high, giving a higher LTV/CAC ratio. By simply shifting spend across different markets, you might be able to bring overall LTV/CAC over 3.
Similarly, you can also calculate CAC for different marketing channels such as Search Ads, Social, Content Marketing, etc. This will help you understand which channels are giving better returns and help with overall budgeting.
Note that to segment CAC, you need to have flawless tracking. You should be able to attribute the customer to specific marketing channels, even if there is a delay in conversion.
Involve your data team in the process of channel attribution and creating conversion pixels. This would ensure that tracking in your centralized dashboards aligns with the data in different marketing tools.
Fixing the Leaks
Growth marketing is a funnel. From the first ad impression to the final conversion, there are several steps along the way. Consider the following funnel for a Google Ad campaign:
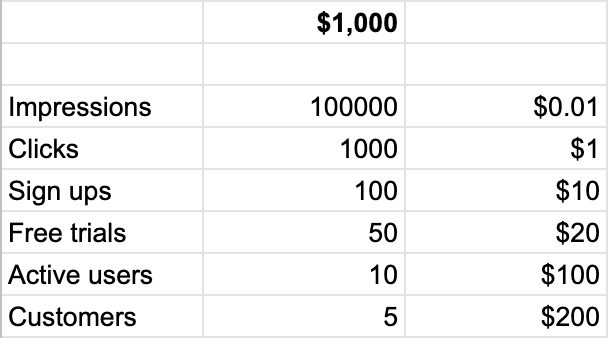
You spent $1,000 on a campaign that yielded 5 customers with a CAC of $200. There is leakage at each stage of the funnel. However, reducing leakage at any stage will have a direct impact on CAC. That’s why you should keep track of conversion rates across the entire funnel.
Here, the sign-up and click-through rate is 10%. This is mostly dependent on your landing page. If by optimizing your landing page you can bring this rate to 12%, that alone will bring your CAC to $167 if all other conversion rates remain the same.
Suppose the above Google Ad is to acquire users for a to-do list app. Here, the free trial/sign-up rate would depend on the initial onboarding that explains how to use the app. By making the onboarding more intuitive, you can improve the conversion rate, leading to a direct reduction in CAC.
There are several tools available to help you optimize your growth marketing funnel. For example, HubSpot Academy wanted to increase its sign-up rate. They used a simple exit-intent survey widget from Hotjar to ask visitors why they were about to leave the page:
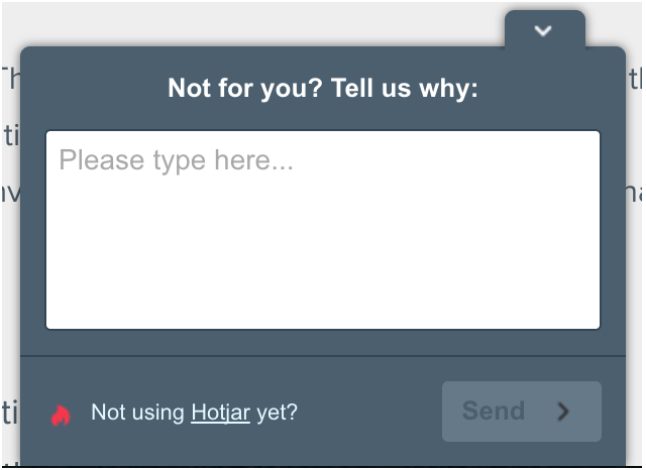
Visitors gave answers such as: “I don’t know how this will help me with my career?” or “I cannot make an account. The form keeps asking me about a company name while I’m a jobseeker.”
By making adjustments in their landing page based on the feedback, they were able to increase conversions by 10%, leading to a direct impact on the CAC.
Many organizations struggle to bring down CAC because these steps involved in the funnel are disjointed, lacking oversight of the entire process. That’s why marketers are often encouraged to visualize their projects in the form of a funnel. This helps them better understand the impact of their projects on the bottom line.
Where does the payback period fit in?
No discussion of CAC and LTV is complete without bringing up the payback period.
Although investors bet on the future, they can’t ignore the present health of the business. Knowing how long it takes a business to recover CAC gives them a great indication of its investment potential. That’s what makes the payback period a favorite KPI of the VCs.
Payback period is the number of months it takes to recover CAC from a customer:
CAC / Average Annual Revenue per Customer
In subscription-based businesses, it generally takes a few months to recover CAC. Most experts recommend it takes less than 12 months, i.e., your business should be able to recover CAC within a year. This is a good rule of thumb, but it varies considerably depending on your industry.
This is a big reason why most subscription-based businesses offer heavy discounts on annual plans. By encouraging people to purchase for a year and pay beforehand, they can significantly lower their payback period:
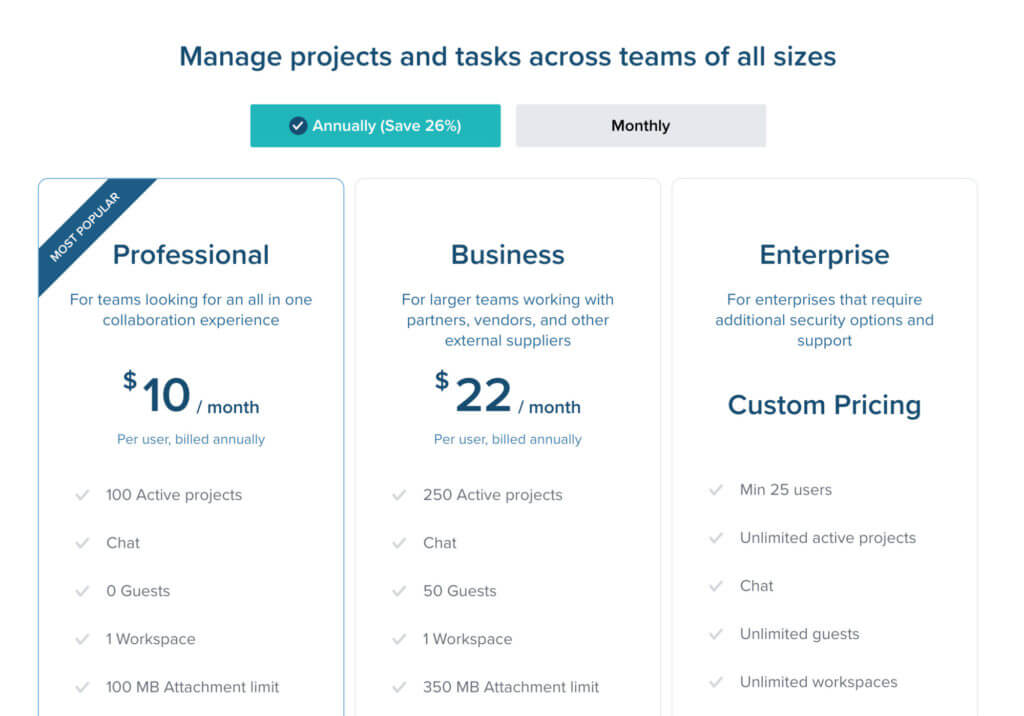
Note how Taskworld’s pricing page encourages visitors to subscribe to their annual plan.
A note on churn
Churn is another factor that affects the LTV/CAC ratio. No matter how good your CAC is, profitability may stagnate or suffer if customers don’t stick around.
Churn refers to the number of customers or percentage of revenue that your business loses at regular intervals. Most businesses track it on a monthly basis for both customers (Customer Churn Rate) and monthly recurring revenue (MRR Churn Rate).
It’s important to be aware of which churn you’re using in your LTV calculation, as they might give different answers. You’ll find examples of using both customer and MRR churn rates. We suggest using MRR, especially for products with flexible pricing. Here’s why:
Suppose you have 100 customers that contribute $5000 in MRR each month and one of them is a big enterprise that constitutes almost $250 of your total MRR. Now, losing that customer might show 1% customer churn, but the MRR churn would be 5%, which is a much more accurate reflection of the intensity of loss.
Monthly churn figures might seem trivial, but a 5% customer churn every month will make you lose almost half of your customers by the end of the year, courtesy compounding.
So, what is an acceptable churn rate? Unfortunately this simple question doesn’t have an easy answer. Countless studies have tried to estimate the average churn rates. For example, a study of 1500 SaaS products by Recurly revealed an average monthly churn rate of 5.6%:
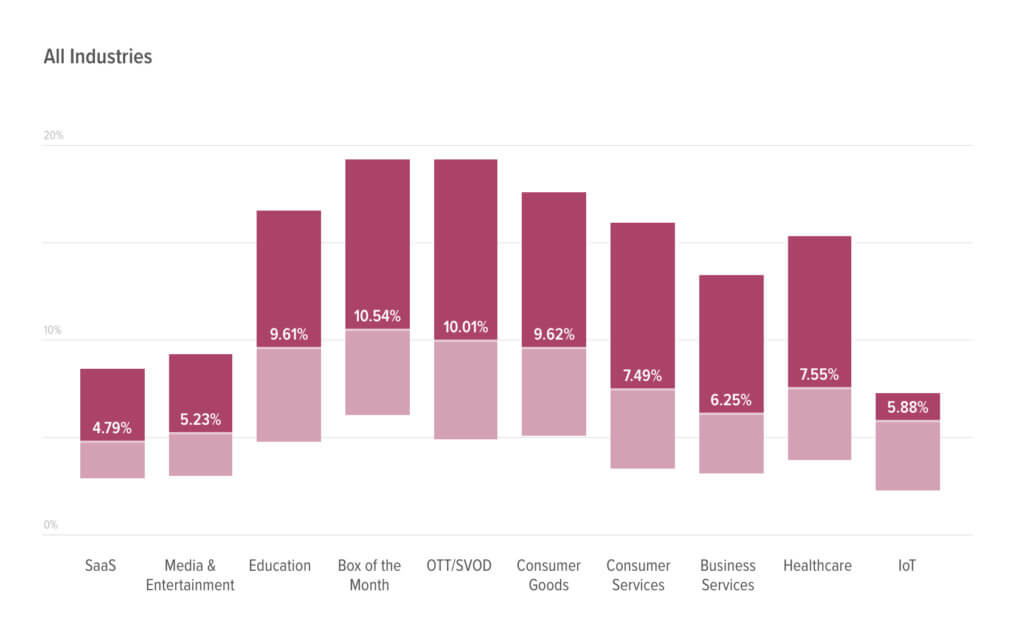
Above, we see an industry-wise monthly churn benchmark based on Recurly’s study. Note that B2C organizations tend to have higher churn than B2B businesses.
However, it can be tricky to assume that just because your churn rate is less than a “benchmark”, you’re in the green. A business with high growth might be able to survive a higher churn rate.
Churn rates can also vary depending on the nature of your product or even the market. For example, if you sell a product in America and Japan, churn in Japan may be traditionally lower because there are fewer Japanese language alternatives to your product.
Therefore, the best way to measure churn is against your own metrics. If your churn is showing a downward trend, that’s great news for all your SaaS metrics.
Conclusion
Measuring CAC opens the door to several other key SaaS KPIs. That’s what makes it such a vital metric to track.
SaaS products are always on the move—tapping into new markets, tweaking pricing, and exploring unique pricing plans. It’s highly unlikely that the way you define CAC will remain the same. Even with your existing pricing structure, there might be several approaches to calculating your CAC, depending on who you ask.
Although CAC is included in various KPIs that affect marketing performance, it’s not a marketing exclusive metric. Every team should keep an eye on CAC and understand how their work affects it. By making CAC a common thread in strategic conversations, you can nurture a shared interest across different departments and prevent silos.
Related Posts
-

Conversations with prospects or customers can improve practically every metric or user state model you’re…
-

What did you do last Sunday? Well I had breakfast with Brian Massey, The Conversion…
-

That it costs five to seven times more to acquire a customer than it does…
-

If you want to double your results, you can either double the number of visitors (very…