
A useful metric is both accurate (in that it measures what it says it measures) and aligned with your goals. Don’t measure anything unless the data helps you make a better decision or change your actions. – Seth Godin
Marketing metrics are a competitive advantage. They allow you to create and optimize campaigns based on actionable evidence rather than intuition.
But to turn data into insights and money, it’s not enough to simply collect information. You have to track metrics you can act on.
Digital marketing metrics track campaign performance and reveal customer responses, guiding decisions, and budget allocation. By aligning metrics with your goals and evolving strategy, you can focus on profitable channels and maximize conversions.
Goals determine your key performance indicators (KPIs), which inform the metrics to track. Although often used interchangeably, there are two main differences between digital marketing metrics and KPIs.
- A KPI is a quantifiable measure of business goals. For example, if your goal is to boost sales by 20% over the next quarter, you might set multiple KPIs to get the full picture of how your team is progressing (e.g., new customer acquisition, conversion rate, and churn rate).
- A metric measures progress toward your goal at a tactical level. For example, if you want to see how a landing page contributes to your goal of increasing sales, conversion rate is a good metric to track.
Analytics platforms track a wide range of metrics by default. Google Analytics, for example, tracks more than 200 different data points spanning the entire marketing funnel. Not all of these will be relevant to you—focus on the metrics that influence your KPIs.
With this in mind, let’s look at 13 digital marketing metrics to track campaign effectiveness.
Individually or together, each of these metrics will contribute to common underlying marketing goals:
- Building awareness;
- Customer acquisition;
- Customer retention.
Table of contents
- 1. Overall website traffic: Spot trends in visitor numbers
- 2. Traffic by channel: Find out where your visitors come from
- 3. Engagement rate: Learn which content resonates with your audience
- 4. Bounce rate vs engagement rate: Learn what’s causing people to leave your website…or stay
- 5. Exit rate: Identify issues in your marketing funnel
- 6. New visitors vs. returning visitors: Understand how customers use your website
- 7. User demographics: Analyze your targeting
- 8. Sentiment: Track brand perception
- 9. Conversion rate: Understand marketing success
- 10. Click-through rate: Understand how your emails and ads engage customers
- 11. Cost per click: Track ad spending to improve performance
- 12. Customer acquisition cost: Prevent reckless spending
- 13. Customer Lifetime Value: Learn how to increase retention
- Conclusion
1. Overall website traffic: Spot trends in visitor numbers
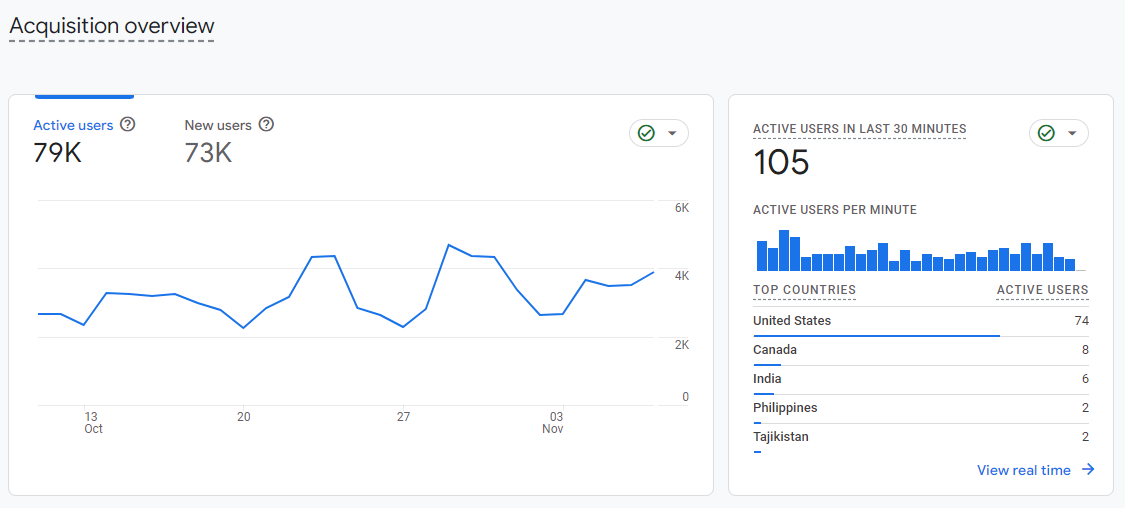
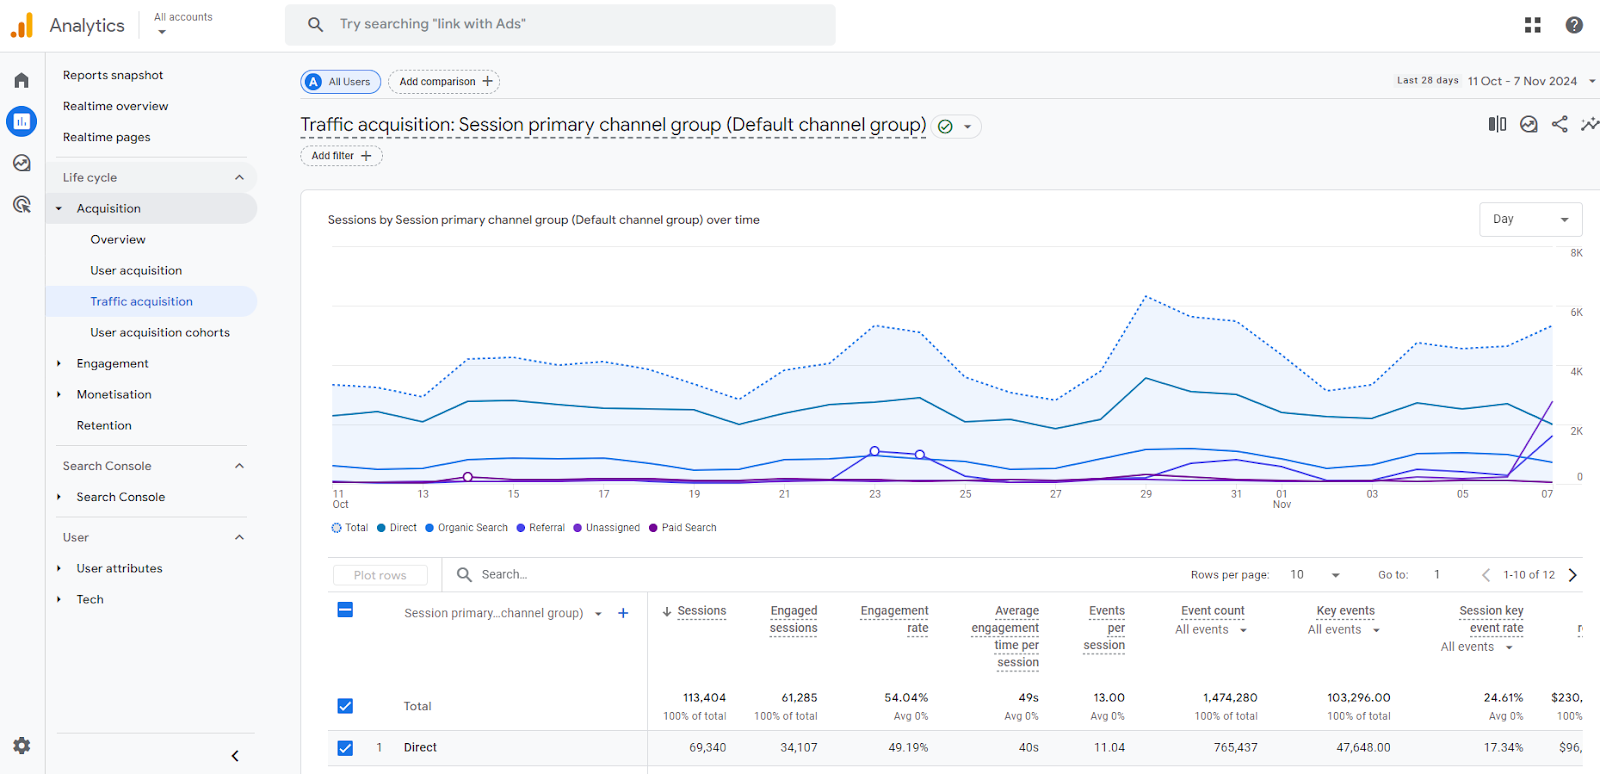
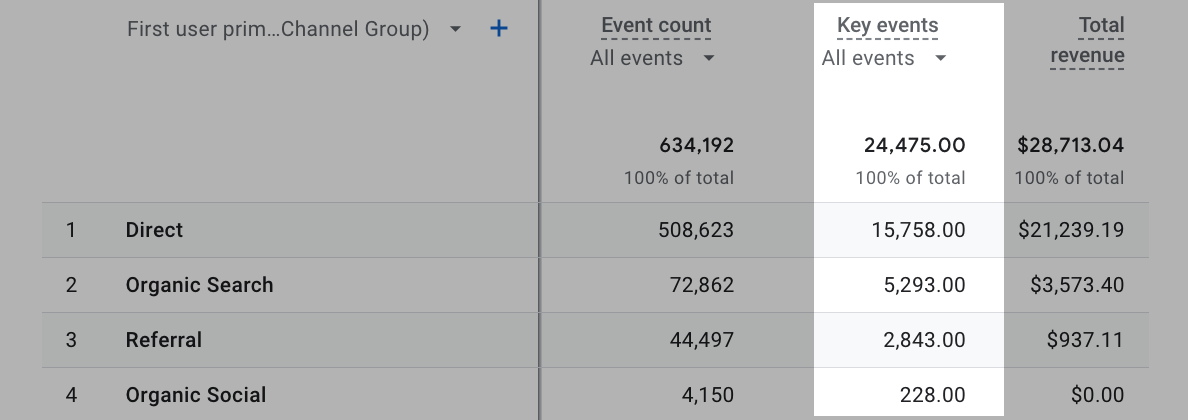
Website traffic is a digital marketing staple. In Google Analytics and other analytics software, overall traffic shows how many people visited or engaged with your website. This data is also filtered by source to show where traffic comes from.
For example, in this screenshot, we can see that traffic mostly comes from direct visitors.
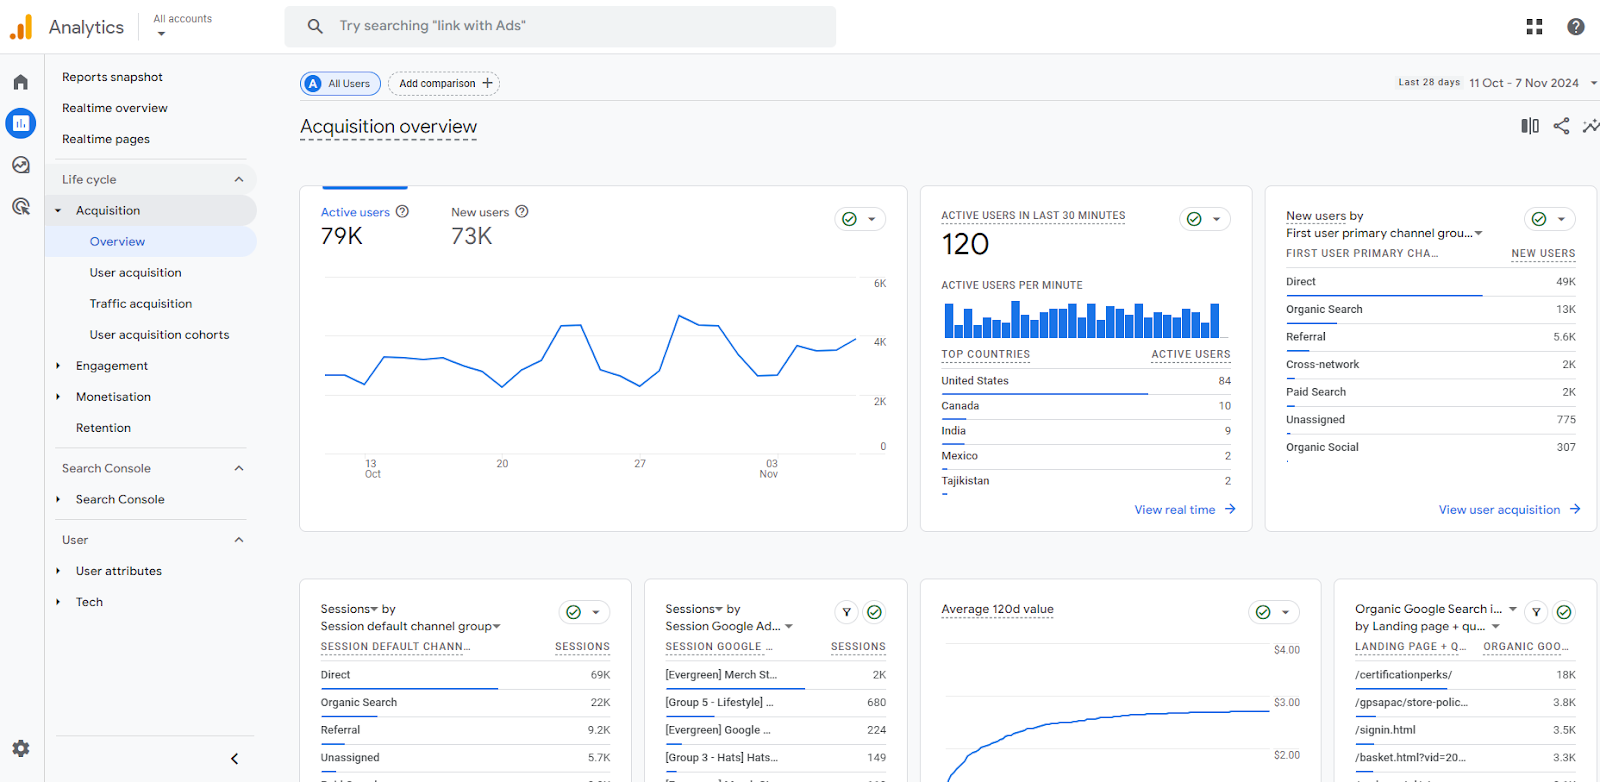
Overall traffic gives you a bird’s eye view of your marketing efforts. If a lot of people are visiting your website, it’s a signal that your campaigns are effective.
If traffic has dipped, it indicates a problem. This could be related to technical issues such as broken links or a sign of poorly performing content.
Traffic on its own doesn’t provide enough information to directly influence the type of content you should create. It’s a metric best used alongside others to track KPIs. However, it’s a useful benchmark.
Monitor traffic closely to spot patterns that can influence your marketing strategy. For example, if visitor numbers spike around particular events or seasons, you can use this to plan ahead and target interested people.
How to track overall traffic
Measure traffic from your Google Analytics dashboard.
In Google Analytics 4 go to Reports > Life cycle > Acquisition > Overview.
2. Traffic by channel: Find out where your visitors come from
Traffic by channel adds meat to the bones of overall traffic. In Google Analytics or other analytic platforms, channels are the sources featured on the overall traffic dashboard. They show where users were before arriving at your website, providing insight into how your campaigns are performing.
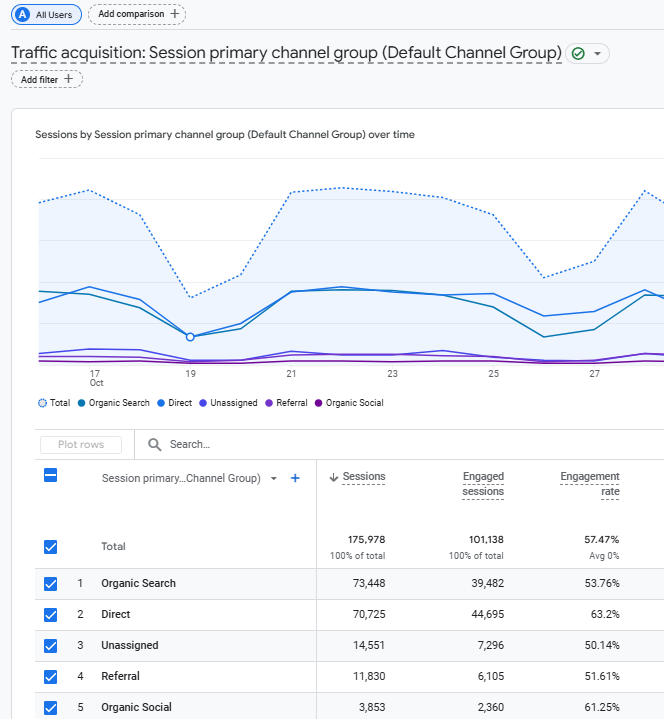
These insights can be used to help focus your strategic initiatives to acquire more traffic.
For example, if a high number of visitors comes from organic search and very little comes from paid search, you can look at shifting ad budget over to SEO. If further analysis shows that direct traffic contributes more to conversions, you have a strong case for doing so.
Here are different channels to track and what they mean:
1. Direct. Traffic from users that entered a URL into a browser, clicked on a saved bookmark or clicked on a direct link from outside of the browser (e.g., in an app). This traffic typically comes from people with awareness or affinity to your website. Therefore, direct traffic is likely to be from loyal and/or engaged users. This makes it a good metric to measure brand awareness and demand.
2. Referral. Traffic from direct links, such as an affiliate link or news source. High referral traffic is an indication of strong affiliate links or media coverage. Look closer at this traffic to understand your partnerships. Sources that drive a lot of traffic to your site can be used to build long-term relationships.
3. Organic. Traffic from non-paid results on search engines. A large amount of organic traffic is a sign that your content is performing well in search results. Traffic tends to be high-intent, which can lead to high levels of engagement. Use Google Search Console or a tool like SEMRush to look at which keywords bring traffic to your website. Build future content around the most popular non-branded terms.
4. Paid. Traffic from paid search ads on search engines. High-paid search traffic is a sign that people are clicking on your ads. As ads appear in search results, visitors generally show high intent. Use ads analytics to view keywords and understand which products and messaging deliver success.
5. Social. Traffic from social media platforms. Consistently generating a high level of social traffic indicates an engaged and loyal community. Look at which platforms drive the most traffic to understand your core communities.
6. Display. Traffic from Display and Video ads. As with paid traffic, generating a lot of visitors from Display is a sign that your ads are engaging. Dig deeper into where this traffic is coming from to get a better idea of your targeting, messaging, and product focus.
Where to track traffic by channel
In GA4, go to Reports > Life cycle > Acquisition > Overview.
You’ll see that traffic by channel is categorized as “User acquisition” and “Traffic acquisition.”
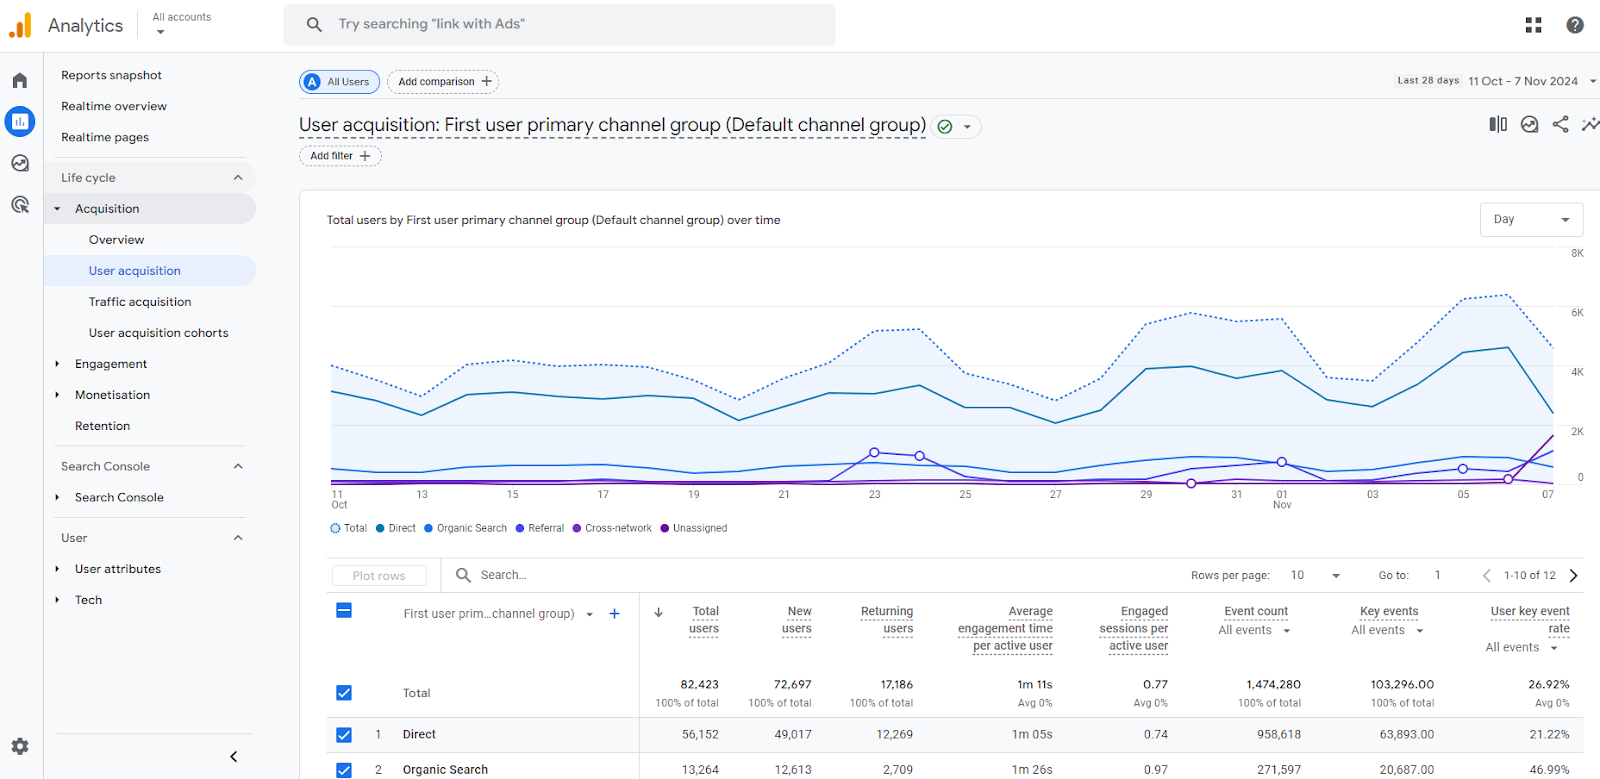
- User acquisition shows you where new users come from.
- Traffic acquisition shows you where new sessions come from for new and returning users.
If you want to find out which sources brought a user to your site in the first place, look at user acquisition. If you want information on the latest session, look at traffic acquisition.
Monitor both to see how your audience engages with your marketing.
3. Engagement rate: Learn which content resonates with your audience
Engagement rate is a content performance metric. It tracks how actively involved with your content your audience is. From this, you can understand if you’re reaching the right people with the right message.
High engagement results in increased awareness and strong brand affinity, which leads to increased revenue.
Use engagement metrics to measure performance and learn which content resonates with your audience so you can create more of it. When doing so, pay attention to the makeup of your audience.
For example, if you notice that a high percentage of engagement comes from a particular demographic, you can tweak your target audience and strategy to better suit their needs.
What constitutes an engaged user differs depending on the context and medium. Therefore, there are different metrics to look at depending on where you’re measuring engagement. Here’s what to look at:
- Websites. Scroll depth, bounce rate, average page views, average time on page, shares, blog post comments, and form conversions.
- Emails. Open rates and click-through rates.
- Facebook. Reactions, comments, shares, and clicks.
- X. Retweets, comments, likes, and clicks.
- Instagram. Likes, comments, and views.
- TikTok. Views, likes, comments, and shares.
- LinkedIn. Interactions, impressions, clicks, comments, and shares.
Where to measure engagement rate
In Google Analytics 4, engagement rate is calculated automatically and displayed as a ratio in your acquisition reports. To find these go to Reports > Life cycle > Engagement > Overview.
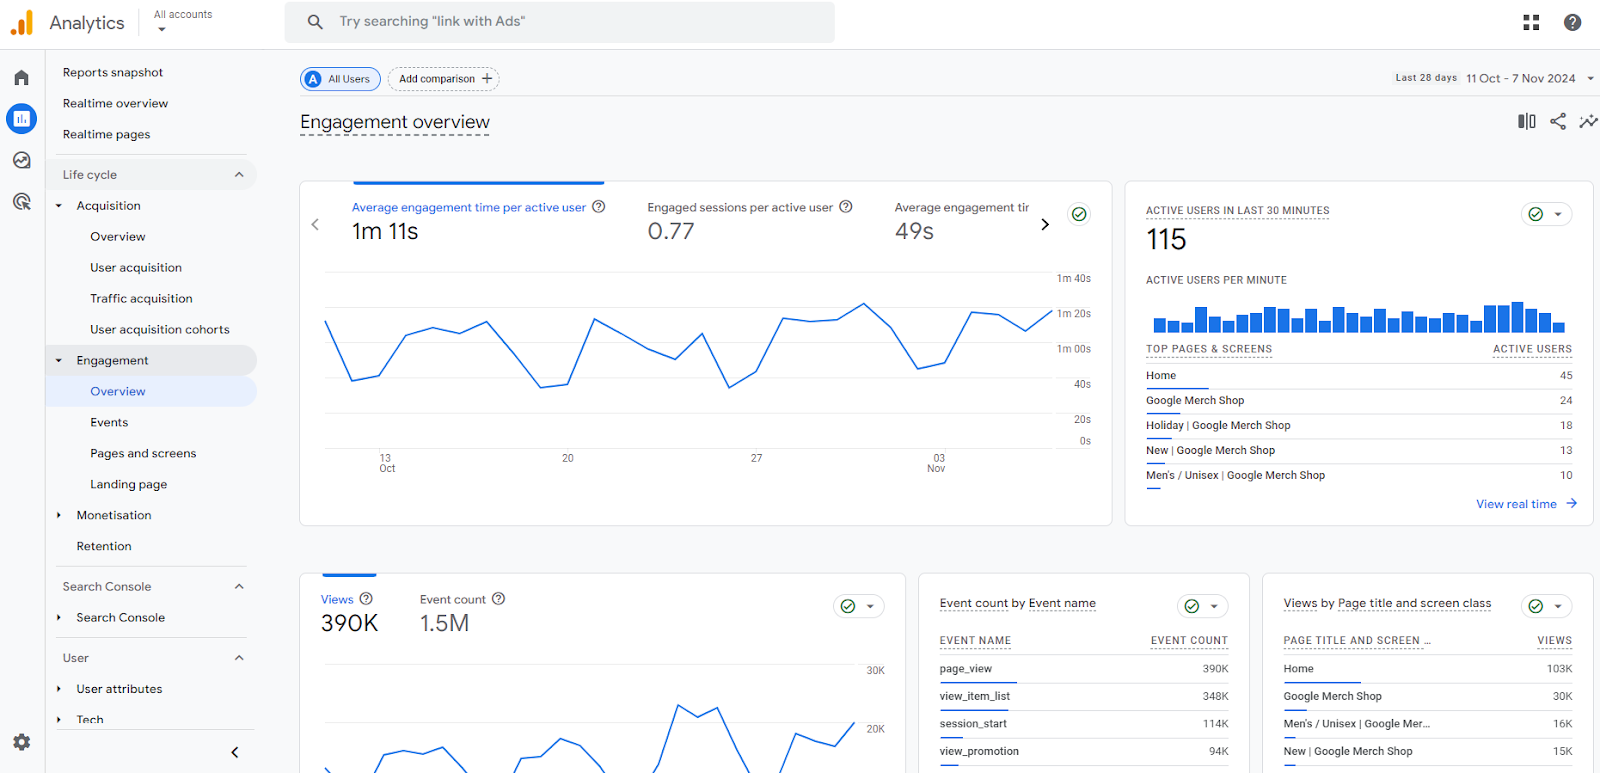
The ratio is calculated as:
Engaged sessions / total sessions x 100% = Engagement rate
For example, if you had 100 engaged sessions and 1000 total sessions, your engagement rate would be 10%.
100 / 1000 x 100% = 10%
An engaged session is logged when a visitor completes one or more of the following:
- Views a page for 10 seconds or longer;
- Views more than one page;
- Triggers a conversion event (e.g., submits a form).
For reference, according to FirstPageSage, a good engagement rate is anything above 63% for B2B websites and above 71% for B2C websites.
To measure social media engagement, you’ll need to run the math yourself. The formula for this is:
Total engagement / total followers x 100% = Engagement rate
- Total engagement is the sum of all interactions (e.g., likes, shares, comments, etc.).
- Total followers is the number of people who follow your account.
For example, if your Twitter account has 10,000 followers and you received 200 likes, 100 replies, and 100 shares, your engagement rate would be 4%.
400 / 10,000 x 100% = 4%
Social engagement rates differ depending on the platform and industry. Check out Socialinsider’s social media industry benchmarks study to see where you stand in the market.
4. Bounce rate vs engagement rate: Learn what’s causing people to leave your website…or stay
Bounce rate is the percentage of sessions that contain a single view of your website.
A bounce is calculated when a visitor lands on your website and leaves without navigating to another page and without interacting.
In Universal Analytics, bounce rate was the key metric used to determine how relevant your content was and whether you were driving traffic to the right landing pages. A high bounce rate was generally seen as a negative (i.e. your page wasn’t serving its purpose) and a low bounce rate as a positive. But it’s not always as simple as that.
A high bounce rate on a help page, for example, could be because the visitor found what they needed and left happily. Or it could be that issues with UX design have ruined the experience. It also depends on the type of page.
Blog posts, for example, will have a naturally higher bounce rate. People tend to be passive content consumers, absorbing a post or scanning it and then clicking away to something else. They might also have been directed to the post through social media, read a bit, and then return to scrolling.
Because of user behavior, the average blog post has a higher bounce rate than, say, a product page. On a product page, the customer is more likely to have a high purchase intent, meaning they’ll convert. Context is important.
Although not completely removed from GA4, bounce rate has taken a back seat to engagement rate, which is now the default metric displayed instead.
Why the Shift?
GA4’s metrics, like engagement rate, provide a richer understanding of user behavior, emphasizing positive interactions rather than just identifying sessions where users did “nothing.”
How to calculate bounce rate
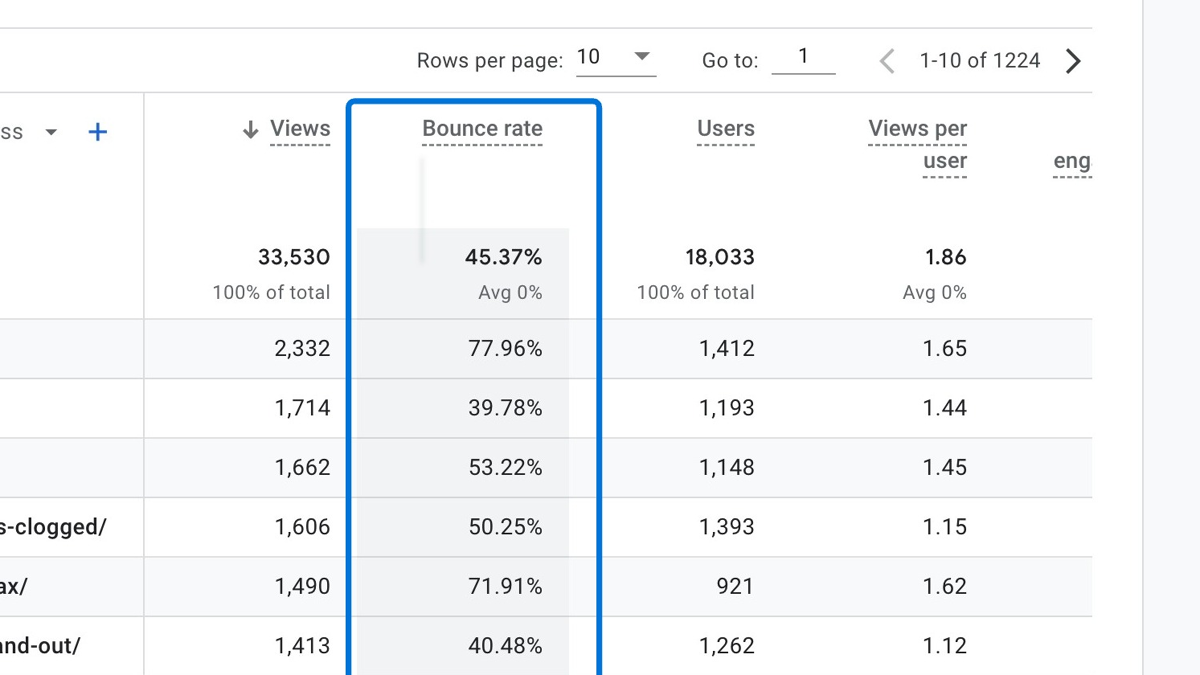
Bounce Rate in Google Analytics 4 (GA4) is the opposite of the engagement rate. In other words, it represents the percentage of sessions that didn’t qualify as engaged sessions.
For example, if your engagement rate is 70%, your bounce rate will be 30%.
In GA4, the bounce rate is calculated by dividing the number of bounces (sessions that are not engaged) by the total number of sessions. The result is then multiplied by 100 to express it as a percentage.
Bounces(non-engaged session)/Sessions x 100 = Bounce Rate %
How to calculate engagement rate in GA4
Engagement rate is the percentage of sessions that are considered “engaged.” A session is classified as engaged if:
- The user stays on the site for at least 10 seconds;
- The user views at least 2 pages/screens;
- The user triggers a conversion event.
Since bounce rate is the inverse of engagement rate, we can use the same formula to calculate engagement rate. The only difference is that we replace bounces (non-engaged sessions) with “engaged sessions.”
Engaged Sessions/Sessions x 100 = Engagement Rate %
Where to track bounce rate in GA4
In GA4, bounce rate is measured as part of engagement rate. Anything that does not class as an engaged session can be viewed as a bounce.
To see the bounce rate, you will need to create an exploration report or add it to your custom reports, as seen below.
Check out Loves Data’s step-by-step guide on how to add bounce rate to GA4.
5. Exit rate: Identify issues in your marketing funnel
Where engagement rate measures the percentage of sessions considered “engaged,” exit rate measures the percentage of users who have left a specific page.
It’s calculated by dividing the total number of visitors to a page by the total exits it received.
Track exit rate to monitor the success of your conversion funnel. A high exit rate will reveal which stage visitors are falling away at so you can correct it.
For example, if someone lands on your homepage and navigates to your product page where they exit, it’s an indication that something is wrong with the page.
From here, you can make tweaks such as editing product descriptions and call-to-actions (CTA), then analyze how exit rate changes.
Where to track exit rate
Measure exit rate in Google Analytics.
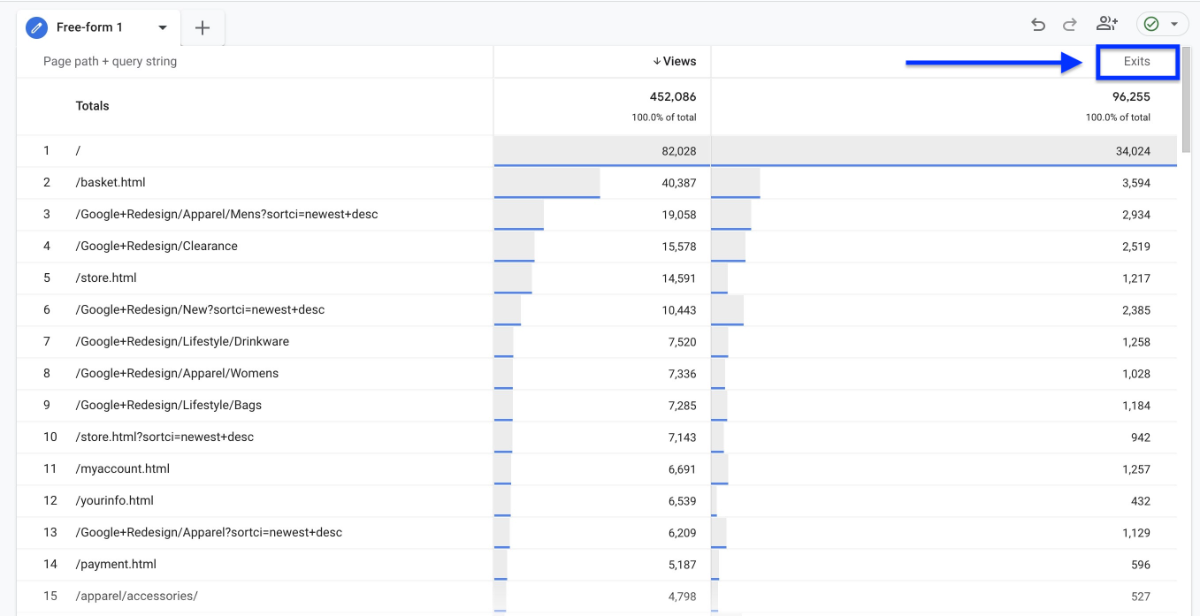
In GA4, exits are only available in custom explorations. To build a report, check out Analytics Mania’s step-by-step guide.
Learn the difference between bounce rate and exit rate and why both matter to performance.
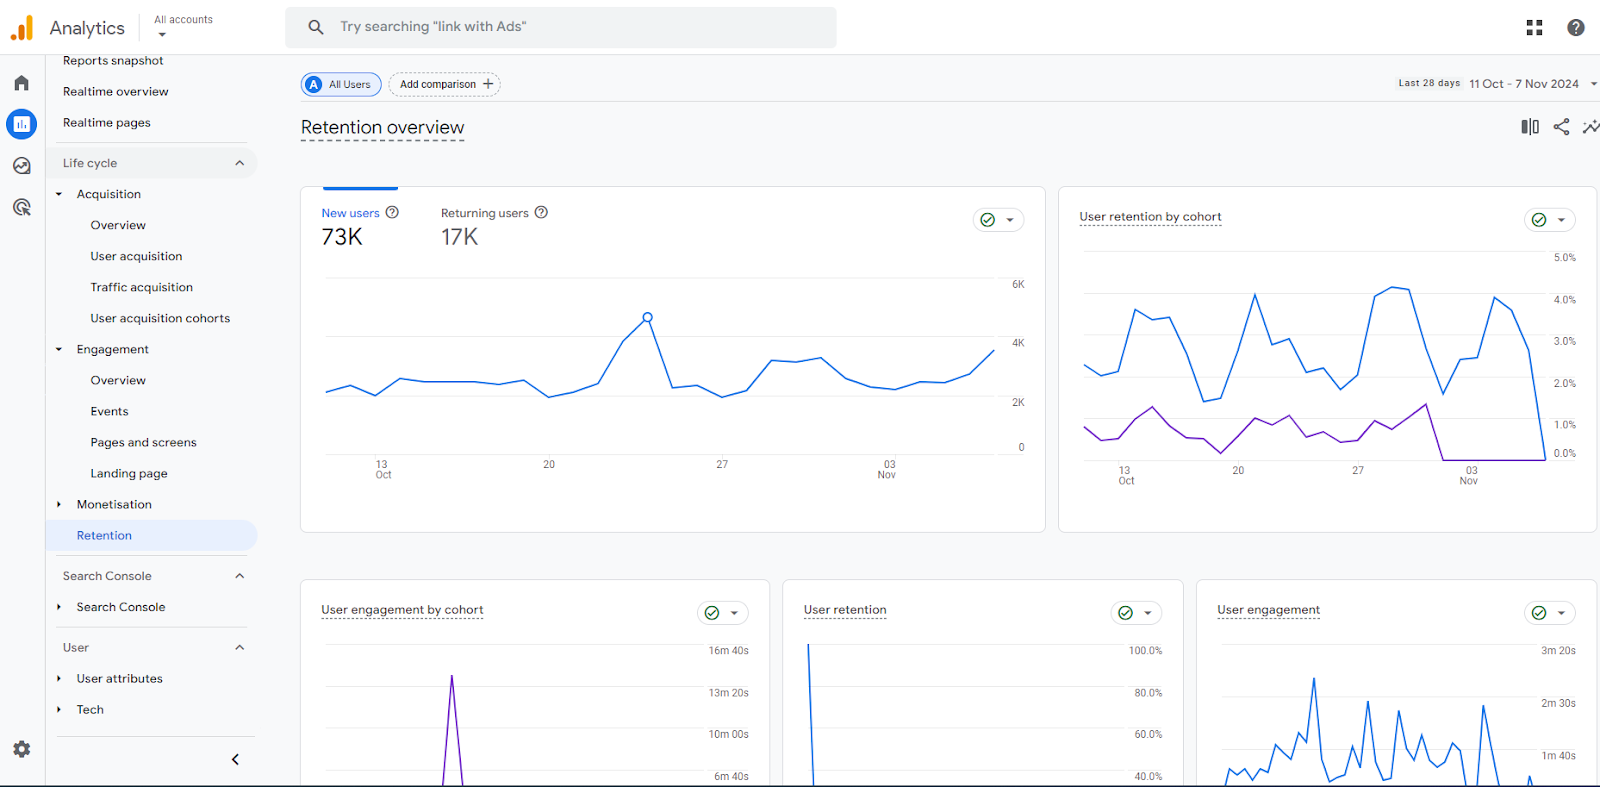
6. New visitors vs. returning visitors: Understand how customers use your website
Comparing the number of new visitors with the number of return visitors is a good way to measure the effectiveness of your website and new content.
In Google Analytics, new visitors are users navigating to your website for the first time on a specific device. Returning visitors are users who come back to your website on a specific device within a two-year period. If it’s been more than two years since a person has visited your site, the next time they return will be counted as a new visit.
These numbers won’t always be accurate. For example, seeing 10,000 new users won’t necessarily mean 10,000 different people. If a person visits your site from a new device or browser, uses private browsing, or blocks cookies, they’ll be counted as new even if they’re not.
But comparing the two can reveal interesting insights.
For example, if new visitors spend less time on your site than returning ones, use a behavioral analytics tool like Hotjar to gather qualitative data to find out why. The answers can be used to make tweaks to improve the experience. For instance, using coupon codes or a free guide to incentivize first-time visitors.
If returning users have a lower engagement rate than new users, look at your content strategy and design. Does the quality of new content match older posts? Have you made UX changes that might alienate existing users?
Where to track new vs. returning visitors
User metrics can be tracked in Google Analytics reports.
In GA4 go to Reports > Life cycle > Retention.
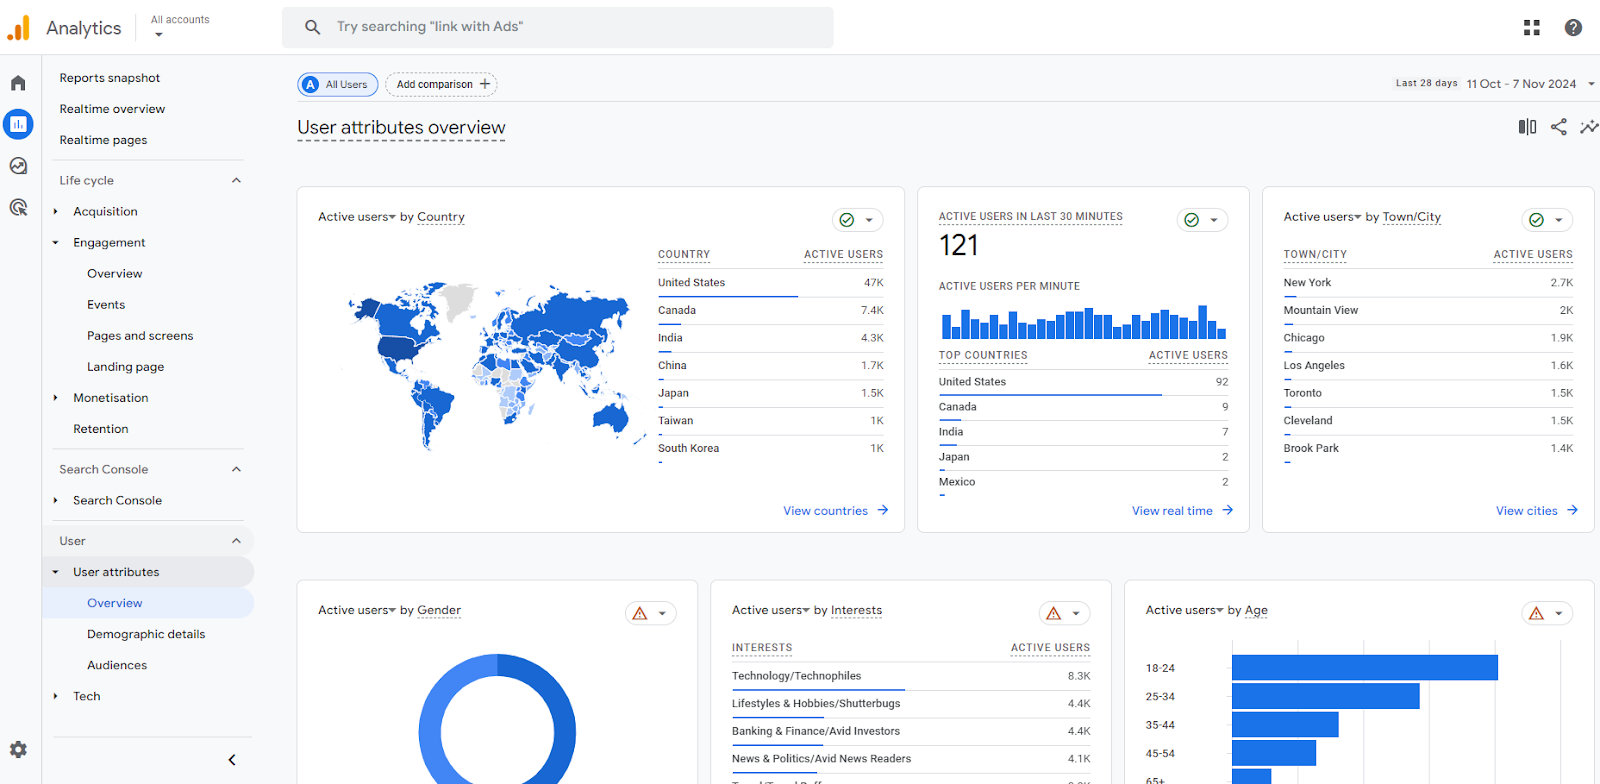
7. User demographics: Analyze your targeting
Demographics give you an insight into your target audience. This includes:
- Location;
- Gender;
- Interests;
- Age;
- Language.
Use this information to compare website visitors with your target audience. If demographics match your customer personas, it’s an indication that your targeting is effective.
If the two are widely different, it’s a sign that your positioning or messaging is off. If this is the case, look at conversions (see metric #9). If rates are down with your core audience, revisit your digital marketing strategy.
Demographics can also uncover new opportunities. For example, a significant number of visitors from surprising locations or age groups can open up new markets to explore.
Where to track demographics
Monitor demographics in Google Analytics.
In GA4, go to Reports > User > User attributes > Overview.
Other platforms such as Facebook’s business page dashboard and social media management tools like Sprout Social and Hootsuite will also provide a demographic breakdown of your social audience.
8. Sentiment: Track brand perception
For your brand to strike the right chord with customers, it’s important to know how your company is perceived.
Most consumers (94%) say that negative reviews have convinced them to avoid a business. Measuring brand sentiment is important to managing brand reputation and ensuring negative perceptions don’t harm your bottom line.
From a content marketing perspective, it expands on engagement rate to give you a deeper insight into what customers like and why.
From a customer service perspective, it allows you to be proactive in your support. For example, monitoring brand mentions might reveal that customers are frustrated at delivery delays. You can use this insight to email them with preemptive apologies and put measures in place to speed up delivery.
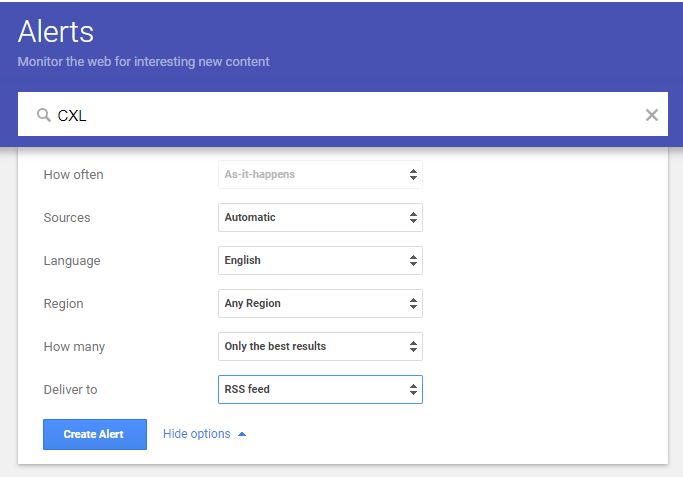
Where to track sentiment
You can measure sentiment in several ways:
- Set up Google Alerts for your brand name and other related topics where your brand is actively mentioned.
- Run customer questionnaires to work out your Net Promoter Score (NPS).
- Regularly review customer service emails and support chat logs. Categorize conversions by tag (e.g., complaint, query, and praise) to gauge overall sentiment.
- Monitor social media shares and mentions for tone, frequency, and volume to gain context for how people are engaging with your brand.
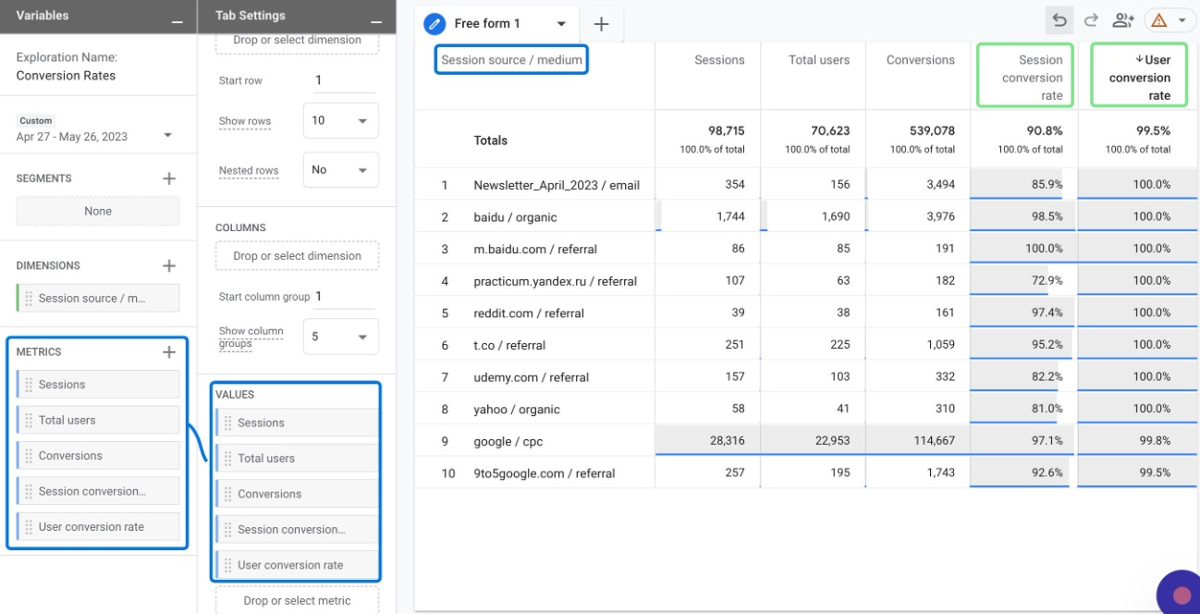
9. Conversion rate: Understand marketing success
Conversion rate is the percentage of users who visit your website and complete a desired goal, out of the total visitors. The action is directly tied to your goal. For example, completing a form, signing up for a service, or purchasing a product.
Conversion rate can be calculated with the following formula:
Number of conversions / Number of visitors x 100 = Conversion rate
For example, if you generated 12 purchases from 240 visits to your product page, your conversion rate would be 5%.
12 / 240 x 100 = 5%
Track conversion rate to understand how successful you are at attracting leads or customers.
Conversions can be as specific or as broad as you want them to be, with insights used to improve performance. Here are a few examples of different rates to monitor:
- Overall conversion rate. How well does your site convert traffic from all sources?
- Marketing channel conversion rate. Do Google Ads convert better than Facebook Ads or email marketing?
- Landing page conversion rate. Which of your landing pages convert the most traffic? Can this format be replicated?
- Campaign conversion rate. Did changes to targeting or messaging make a difference?
- Ad conversion rate. Which ads drive more qualified traffic? What do these ads do that underperforming ads don’t?
- Keyword conversion rate. Which keywords perform best? Successful terms warrant more budget.
Use results to identify profitable channels and troubleshoot friction points in your sales funnel. A poor conversion rate combined with a high exit rate, for example, can help you pinpoint areas for analysis.
But what makes a good or bad conversion rate?
Most analyses find that the average conversion rate for B2B companies is around 2%, whereas for B2C companies it’s around 1.6%. These rates are useful for benchmarking, but your rate should always be measured alongside lead quality and sales.
A high conversion rate for non-purchases only benefits your bottom line if it results in a paying customer.
Where to track conversion rate
Monitor conversion rate in Google Analytics.
From here you can explore conversions deeper by looking at goal completions by URL, reverse goal paths, and funnel visualization.
This will help you understand attribution and how different pages and marketing assets contribute to conversions.
Check out our guide to setting up conversion-boosting funnels in Google Analytics.
In GA4, conversions or Key Events are based on which events (actions) you mark as conversions. For example, clicking a link or completing a purchase. Learn how to set up events in our definitive guide to Google Analytics 4.
10. Click-through rate: Understand how your emails and ads engage customers
Click-through rate (CTR) shows the relationship between the number of views and the number of clicks on an ad or in an email.
This is calculated slightly differently depending on the medium.
For email, the formula to find your CTR is:
Number of people who clicked a link / Number of emails delivered successfully x 100 = CTR
For example, let’s say you sent an email to your list of 150 people and 100 were successfully delivered. Of those 100 recipients, 50 clicked on your CTA and were sent to your landing page. Based on those figures, your CTR would be 50%
50 / 100 x 100 = 50%
For PPC, the formula to find your CTR is:
Number of people who click an ad / total number of ad impressions x 100 = CTR
For example, if 100 people saw your ad and 10 people clicked on it, your CTR would be 10%
10 / 100 x 100% = 10%
CTR is an important metric for measuring the efficiency of your PPC ads and email marketing campaigns.
Monitor the CTR of your email campaigns to analyze multiple elements and improve results:
- Email interest or fatigue;
- Content quality;
- Media type;
- Link placement;
- Number of links.
Track CTR for ads to evaluate the quality of your keywords and thus your ads. CTR is a key factor in Google’s Quality Score formula used to raise your ad position and reduce your spending.
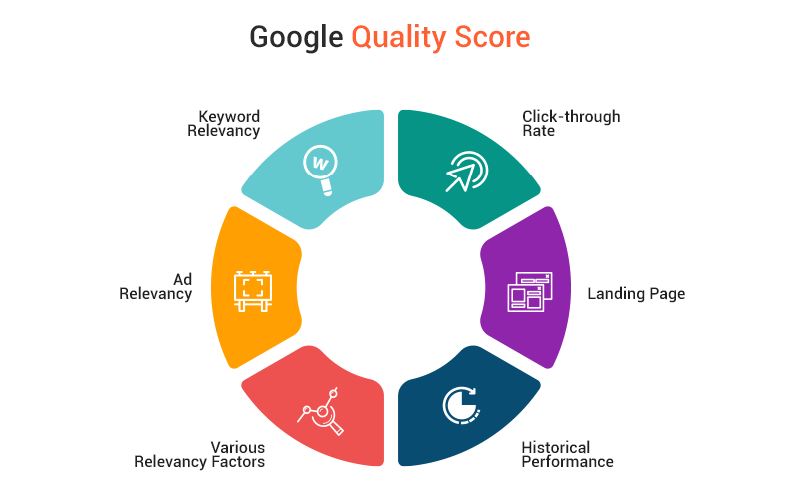
Essentially, a high CTR means that your keywords are targeting and engaging the right audience.
A low CTR points to an issue in one of the factors affecting your Quality Score. keyword relevance, landing page quality, or ad relevance.
- If your ads aren’t being shown, assess keyword quality. Are you bidding on terms that are relevant to your target audience?
- If people are clicking on your ads but not converting, analyze your landing page. Is messaging consistent with your ad? Does it do a good enough job of explaining the benefits of your product? Are CTAs clear and well-positioned? Optimize different elements of your page and run A/B tests to find the best combination of elements.
- If people are seeing your ads but not clicking on them, look at your messaging, images, and CTAs. Is the ad engaging your target audience? Again, test different versions to gauge what works.
So what’s a good CTR?
Looking at all industries shows an average CTR of 6.64% for search and 0.57% for display. A CTR higher than the average in your industry can be considered a good CTR. Learn what your industry average is in our click-through rates breakdown.
Where to track click-through rate
Email CTR will be measured automatically in your email marketing platform. You can track links in two ways:
- Unique clicks. This tracks once for each user who clicks a link to reveal the percentage of recipients who clicked through an email.
- All link clicks. This tracks any click-through on an email, even if the same user clicks on a CTA multiple times. It will reveal the ratio of emails sent to visits to your website. Use it to see how effective your website is at converting users first time.
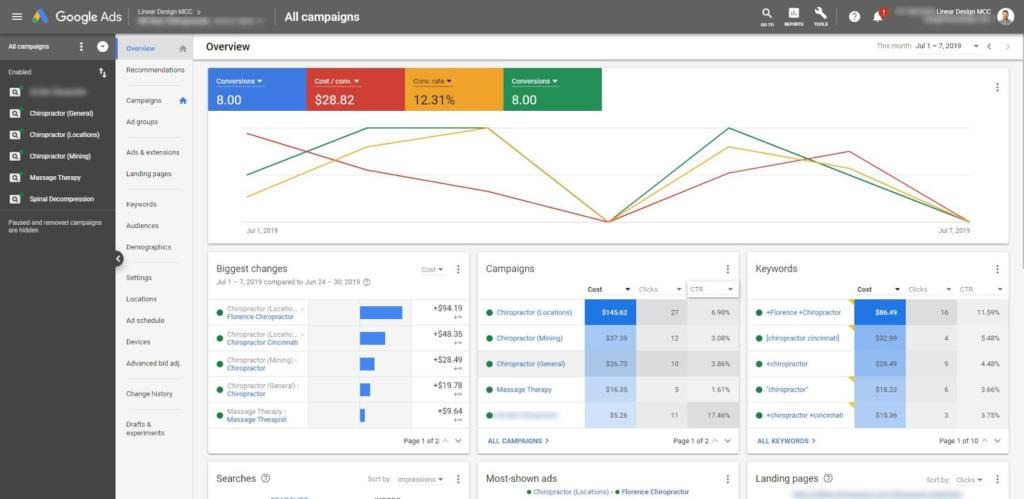
In Google Ads, CTR can be found in your Campaigns dashboard.
11. Cost per click: Track ad spending to improve performance
Cost per click (CPC) is the price you pay for each click on a PPC ad. Since your overall campaign return on investment (ROI) is determined by how much you’re paying for clicks and the quality of traffic those clicks drive, it’s an important metric to measure in terms of expense and value.
CPC acts as a thermometer for ad performance. Monitor it to identify which ads, ad groups, or ad campaigns deliver the best ROI, and as a way to compare your ad effectiveness against competitors.
To measure your average CPC, use the following formula:
Total cost of clicks / Total clicks = CPC
For example, if your ad gets two clicks, one at $0.20 and one at $0.10, the total cost is $0.30.
$0.30 / 2 = $0.15
According to WordStream, the average CPC across all industries is around $2. Costs tend to be higher for search network ads and lower for ads shown on Google’s display network.
If your CPC is high, it signals room for improvement in your Quality Score or ad targeting. To lower it, analyze:
- Audience. Are you targeting the right people? Narrow down your audience to one specific group.
- Ad relevance. Ensure your ads are engaging for potential customers.
- CTAs. Test different CTA copy. Get specific. User action words to entice clicks. For example, if you’re giving away an ebook, don’t say “click here”, say “download your free guide.” Tell the person what will happen when they click. Check out our guide to crafting compelling CTAs.
Where to track CPC
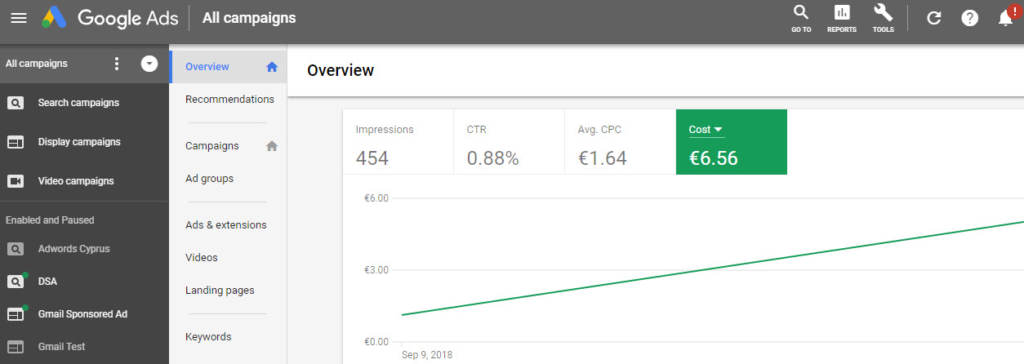
Measure CPC in your Google Ads Campaigns by looking at the “Avg. CPC” column.
12. Customer acquisition cost: Prevent reckless spending
Customer acquisition cost (CAC) measures how much your company has to spend to get a new customer. It also tells you how much you need to earn from each customer to run a viable company.
Measuring CAC is critical to ensuring you’re not spending more than you’re making. It’s also a way to identify opportunities and streamline marketing for better ROI. For example, if your acquisition costs are high for LinkedIn ads, you can shift marketing budget to a tactic with a lower CAC.
CAC is calculated by totaling expenses related to acquiring new customers and dividing them by how many customers you’ve earned.
Total marketing spend / Number of new customers = CAC
For example, if you spent $300 on email marketing and $400 on PPC ads and acquired 500 new customers, your CAC would be $1.6.
$700 / 500 = $1.6
Track CAC to keep your business honest and spend wisely. Check out our guide on how to maintain a healthy customer acquisition cost and use this metric for growth.
Where to track CAC
To measure and compare CAC over time, create a cost spreadsheet to track spending.
Here’s an example from Startup Tools:
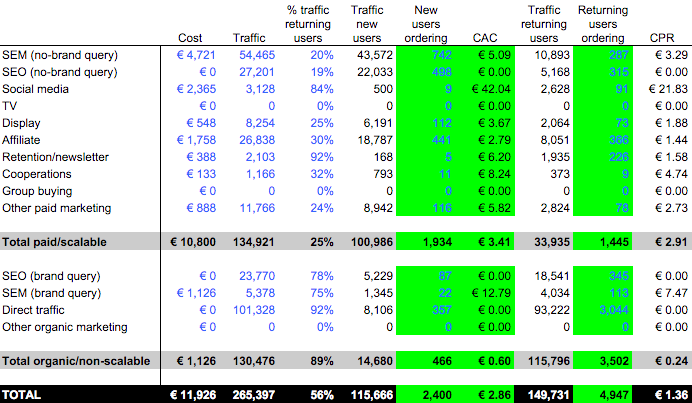
If you want to track marketing and ad spending, include only your marketing outlay.
If you want to measure your true CAC to get an idea of overall business health, include all costs related to day-to-day operations. These are your Cost of Goods Sold: materials, rent, labor, storage, shipping, etc.
13. Customer Lifetime Value: Learn how to increase retention
Customer Lifetime Value (LTV) is the amount of money a customer is predicted to spend with your business for as long as they are a customer.
LTV is a measure of customer loyalty. The more valuable existing customers are to your business and the longer they stick around, the less you have to spend finding new ones.
Track LTV to help answer some key questions about your customers and marketing, such as:
- Do offers meet customer needs and incentivize repeat purchases?
- How much should we invest in retaining or winning back customers?
- Does our onboarding process help foster brand loyalty?
- How much time and money should we invest in marketing for acquisition?
LTV is also an important financial metric. When measured alongside CAC, LTV provides a holistic view of your business. CAC tells you how much a customer costs. LTV reveals how much a customer is worth.
If you retain customers for a long time, LTV can put CAC in a more positive light. Here’s an example from our guide on ecommerce customer acquisition costs:
If your CAC is $100 per customer, that may seem high. If you acquire 2,000 customers a year, your total expenditure would be $200,000.
However, if each customer stays with you for two years and has an average order value (AOV) of $30 a month, you earn $620 per customer. Multiply that figure by your 2,000 customers, and you get $1,240,000.
Calculate LTV as:
Average value of a sale x Number of repeat sales x Average retention time = LTV
For example, if a customer spends $20 per month on your product for three years, LTV would look like this:
$20 x 12 months x 3 years = $720 in total revenue (or $240/year)
This is a very basic equation and it’s important to segment your customers to understand the correlations between those who stay and those who churn quickly.
LTV/CAC ratio should be at least three for a sustainable business (i.e., a new customer should bring at least 3X the value of what they cost to acquire).
Anything less is a red flag that indicates overspending on acquisition. If this is the case, review the CAC of prominent channels and analyze your marketing funnel to find faults.
Where to track customer lifetime value
The numbers needed to track lifetime value can be found in the analytics and reporting tools of your ecommerce or sales management platform (e.g., BigCommerce, WooCommerce, Pipeline, or Salesforce).
There are a few numbers you’ll need to track in a spreadsheet to uncover your average LTV.
To find the average value of a sale, divide total revenue by the number of orders over the period.
Total revenue / Number of orders = Average purchase value
To find the number of repeat sales, divide the number of purchases by the number of customers over the period:
Number of purchases / Number of customers = Average number of repeat sales
Multiply average purchase value by average number of repeat sales to find your customer value.
Average purchase value / average number of repeat sales = Customer value
To find the average lifespan of your customers, divide the amount of time a customer continues to purchase from you by the total number of customers.
Customer lifespan / number of customers = Average customer lifespan
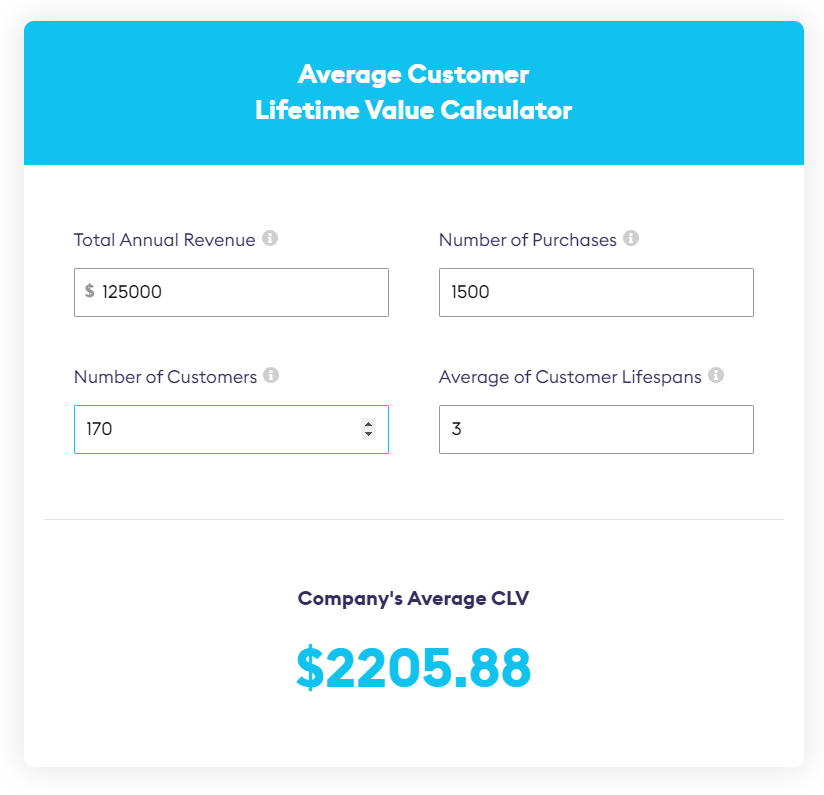
Finally, multiply customer value by customer average customer lifespan to get your average customer lifetime value.
To help you quickly run these sums, use Chattermill’s customer lifetime value calculator.
Conclusion
Tracking metrics lets you build digital marketing campaigns around what you know works and patch holes when they appear.
But not every metric is needed in every scenario. Use KPIs to determine which metrics to measure. Consider whether the data offers useful insights to improve performance. If it doesn’t contribute to your goal, it’s probably not worth tracking right now.
Become great at data-driven marketing and use insights to grow your business with CXL’s Digital Analytics Minidegree.
Related Posts
-

Knowing how to measure content marketing ROI, like measuring optimization ROI, is hard. And complicated.…
-

Traditionally associated with development and product management, agile is a lightweight and, well, agile framework…
-

Thinking about emailing influencers to ask them for backlinks or tweets? Most people are terrible…
-

When researching a new product, buyers use 10 or more channels to interact with companies.…