Intuition is no substitute for data. As Dr. Eric Bonabeau says, “The more data you have to weigh, and the more unprecedented the challenges you face, the less you should rely on instinct and the more on reason and analysis.”
With digital analytics, you have access to all the data you need to make smart decisions without solely relying on feelings.
In this guide, you’ll learn how digital analytics can benefit your business and how to use it to communicate with stakeholders. You’ll also discover digital analytics tools and the most complete digital analytics training to help you better understand your customers.
Table of contents
- What is digital analytics and what can you gain from it?
- The digital analytics metrics you need to know
- How to use analytics to improve marketing campaigns
- 9 tools for your digital analytics stack
- 1. For overall web analytics: Google Analytics
- 2. For content analysis: Parse.ly
- 3. For customer analysis: Woopra
- 4. For UX analysis: Hotjar
- 5. For A/B testing: Google Optimize
- 6. For social analysis: Sprout Social
- 7. For SEO analysis: Ahrefs
- 8. For enterprise-level analysis: Google Analytics 360
- 9. For data visualization: Microsoft Power BI Desktop
- Digital analytics training: Which course to choose?
- Conclusion
What is digital analytics and what can you gain from it?
Digital analytics is the process of analyzing data to uncover insights that help improve business and marketing performance. It involves collecting and measuring data from interactions with your website, ecommerce store, social media channels, and mobile apps to make decisions based on audience or user behavior.
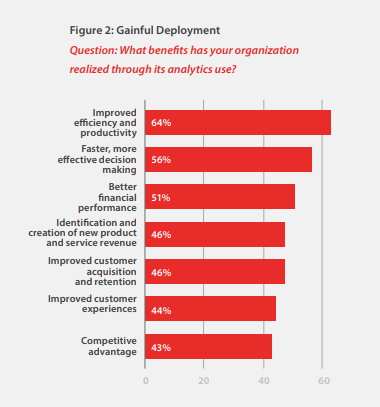
When MicroStrategy asked marketers how analyzing data has helped their organizations, the answers spanned most aspects of the business:
For organizations that have embraced the use of data and analytics, a common set of benefits has emerged that continue to motivate their investments, including improved efficiency and productivity, faster and more effective decision-making, and better financial performance.
In thinking about the bigger goal of digital transformation, 46% say they have been able to identify and create new product and revenue streams, and 45% of organizations are now using data and analytics to develop new business models.
The more you know about your customers and market, the more effectively you can run your business.
Digital analytics helps drive growth by using what’s happened in the past and what’s happening in the present to improve what happens in the future.
It does this across three main categories.
1. Descriptive analytics
The aim of descriptive analytics is to answer the question: what happened? It does this by using current and historical data to identify trends and relationships that you can use to shape marketing campaigns.
For example, which channels drive the most traffic to your product page? Using descriptive analytics, you can analyze the number of visitors from each channel. Go deeper to compare traffic data to historical data from the same channel and determine which channels are the most successful and which need work.
For instance, you might learn that traffic from social media increased 30% in Q2, but search traffic for the same period dropped off.
Descriptive analytics can also be used to identify trends in user behavior to gauge demand.
Netflix is a great example of this. By gathering insights into users’ viewing habits, Netflix can determine which content is most popular:

This information is then used to produce more TV shows and movies along the same themes, increasing user engagement.
2. Predictive analytics
Predictive analytics uses data to predict future trends and scenarios. On digital analytics platforms, this is done through machine learning.
If you’ve ever used Amazon or a store that offers product recommendations, you’ll have seen predictive analytics in action. By analyzing a buyer’s browsing and purchase history, Amazon makes an educated guess on products that the person will also like:

This helps them personalize the customer experience. Research from Salesforce shows that over half of customers expect companies to always personalize offers (a finding that’s moved upwards since 2019).
By making predictions based on what buyers want, Amazon makes shopping easier (people don’t have to go searching for products), allowing them to sell more.
3. Prescriptive analytics
Prescriptive analytics uses relevant data to determine what to do next. Like predictive analytics, it uses machine learning algorithms to provide relevant data.
The difference is, where predictive analytics gives you raw data for making informed decisions, prescriptive analytics gives you data-backed options you can weigh against each other.
Algorithms use “if” and “else” statements to filter data and make recommendations. For example, if data reveals that 40% of sales calls don’t convert, the algorithm may recommend further training for sales reps.
Mobile carrier Sprint (now part of T-Mobile) is a great case study for the effectiveness of this kind of analytics. The company once had the market’s highest churn rate and lowest Net Promoter Score (NPS). By switching from manual analysis data to predictive analytics, Sprint could quickly analyze user behavior to spot customers at risk of churn and identify retention offers.
It then used an AI-powered algorithm to proactively provide personalized recommendations (like Amazon), giving customers attractive offers when they were most at risk of leaving. This led to a 10% reduction in churn and a 40% increase in NPS.
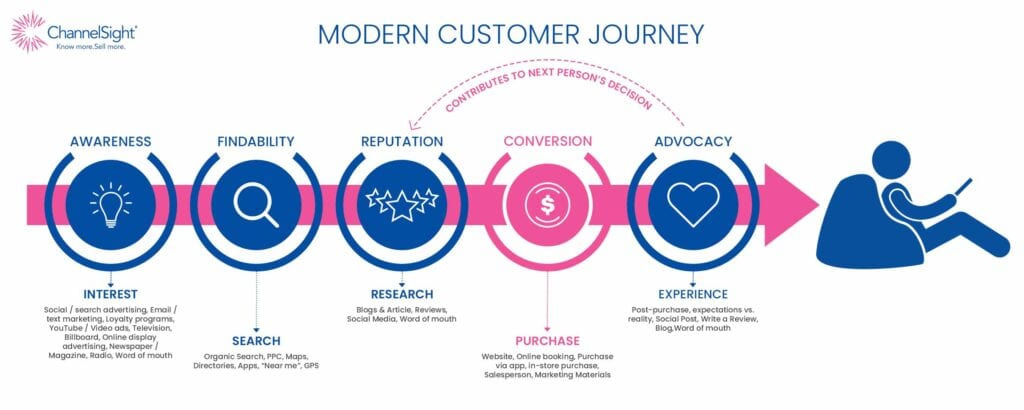
Descriptive, predictive and prescriptive analytics models combined give you the information needed to deliver a better experience at every stage of the customer journey.
For customers in the research stage, you can use analytics to identify which content helps your audience answer questions based on engagement from previous content.
From search terms being used to visit your website, pages visited, and conversations happening on social media, you can create lead magnets that appeal directly to your audience’s needs to sway customers in the consideration phase.
And from existing customer behavior and interactions with your customer service team, you can predict popular products and make upsell and cross-sell recommendations to increase retention.
In short, digital analytics stops you from relying on intuition to keep pace.
The digital analytics metrics you need to know
Metrics are the statistical measures used to determine the success of your marketing efforts.
For example, if you’ve created a new user guide, you’ll want to know how many people have read the full guide and clicked on the call-to-action (CTA) buttons. Metrics will provide that information.
Not all metrics are useful, however. So-called “vanity” metrics make you look good, but won’t always help you understand performance in a way that informs future strategies.
For example, a company with a large social media following might look like it’s thriving, but followers are a vanity metric. What’s important is how follower numbers translate to engagement, shares, increased brand awareness, and conversions.
To assess the impact of a marketing campaign, find new opportunities, improve return on investment (ROI), and increase customer lifetime value (CLV), you need to focus on actionable metrics.
Here are some important actionable metrics to monitor.
- Conversion rate. The number of actions taken (e.g., sale, sign-up, or download) compared to the total number of visits.
A good conversion rate points to a successful funnel that can be analyzed and replicated. A poor rate, on the other hand, is a sign that parts of your funnel are ineffective or broken. Learn how to measure your conversion rate to accurately calculate growth.
- Engagement rate. The total number of engagements (e.g., comments, likes, clicks, and shares). This shows how actively involved your audience is with your content.
An engaged audience is a sign your digital marketing strategy is working. Poor engagement signals issues with targeting or content quality.
- Click-through rate. The ratio of users who click on a specific link compared to the total number of users who view the content (e.g. page, email, ad, video, etc.). This is a crucial metric for evaluating the relevance of your marketing. Learn everything you need to know and more about click-through rate.
- Bounce rate. The percentage of people who leave after only viewing one page. A high bounce rate indicates your website isn’t meeting visitors’ expectations.
This could be content or UX-design-related. Or, it could be a result of issues such as bugs, broken links, or slow loading. Learn how to analyze, use, and understand bounce rates.
- Website traffic. The number of visitors to your website within a given period. Measuring traffic will help you identify which campaigns work and which ones don’t.
- Traffic by source. The number of visitors from different places on the web (e.g., direct, referral, organic, paid, social, email, etc.). Where website traffic tells you what’s popular, measuring the source helps you identify profitable channels.
You can also analyze traffic by device to assess how people access your website (e.g., by smartphone, tablet, or desktop).
- Exit rate. The percentage of exits on a page. Where bounce rate measures single-engagement sessions, exit rate is the percentage of visits that were last in the session.
A high exit rate usually signals a problem in your conversion funnel. Learn the difference between bounce rate and exit rate and how to reduce site exits.
- Sessions. A series of events or actions that a visitor takes on your website (e.g., viewing a page, watching a video, or clicking on a CTA, etc.) A session will expire after 30 minutes of inactivity.
Track sessions to understand how attractive your site is and how well you’re doing at attracting users. Combine sessions with “users” (unique visitors) to understand the number of people who are seeing and interacting with your content.
- Cart abandonment. The number of online shoppers who add items to their cart but don’t complete a purchase.
Monitor and measure cart abandonment whenever you make changes to your site. Issues such as changes in design, unexpected costs, and your checkout process can all impact conversions. Learn how to reduce cart abandonment.
- Cost per click (CPC). The amount you pay for each click on a PPC ad. Monitor CPC to assess ad ROI. A high CPC is a signal that your ads are ineffective. Learn how to correct Google Ads mistakes that cost you money.
- Customer acquisition cost (CAC). The cost of converting a lead into a customer. CAC is a sign of your sales, marketing, and customer service health.
The less you spend acquiring customers, the more profitable your business will be. A high CAC, however, is a sign your products, or sales and marketing campaigns are failing. Learn how to calculate and maintain a healthy CAC.
Every metric you track should be considered with a careful eye. Never take data at face value; ask critical data anlytics questions, like whether you have the complete picture and what needs to be measured for more meaningful results.
How to use analytics to improve marketing campaigns
To use digital analytics effectively, you need solid goals backed by the right metrics. A logical connection between why you’re measuring and what you’re measuring will help you stay true to your mission and use software in the right way.
Use your why and what as the foundations for your digital analytics strategy.
Define your mission, goals, and KPIs
Bring analytics tools together to measure every aspect of your marketing campaigns, helping you identify how channels work together and how people interact with your various initiatives.
But at the hub of it all is your website. This sits at the heart of your digital analytics strategy, where you’re driving traffic and securing sales.
Set out the mission for your website. Why does your site exist? What is it designed to do? Your mission may be tied to your overall brand mission statement.
For example, Asana’s mission is to “help humanity thrive by enabling the world’s teams to work together effortlessly.”
This is why Asana’s website exists. Its main site is dedicated to teaching people how to work more productively on and off Asana, while its app helps users easily manage projects.
Keep your mission short, sweet, and value-focused. In no more than three lines, you should answer:
- The challenges your website solves;
- What customers value;
- How your website/company is different from the competition.
Think of it like an elevator pitch. If you had 15 seconds in an elevator with a potential customer, how would you sell your website?
If it helps, use a basic formula like this one by HelloDotNYC:
At [COMPANY NAME], it’s our mission to help [TARGET CUSTOMER] do / achieve / reach / eliminate / reduce [HAPPINESS/PAIN] by providing [A BENEFICIAL OUTCOME].
When you’re clear on why your site exists, define what you want your users to do on your site and marketing channels.
Goals have to be actionable so that you can track progress and measure outcomes to improve.
For example, your goal for analytics can’t be to influence the conversation in your industry. That’s not trackable. What you can aim to do is increase brand engagement on LinkedIn. This engagement can be measured in likes, comments, shares, and direct messages and will indicate that you are influencing the conversation.
Make your goals SMART: Specific, Measurable, Attainable, Realistic, and Time-bound.
SMART goals will provide clarity and realistic targets to aim for.
Set key performance indicators (KPIs) to measure marketing performance
KPIs turn raw data into actionable data to drive results from your goals. They’re an important way to keep teams aligned and hold marketing to account so that business keeps moving in the right direction.
Set KPIs that relate to your goals. For example, if your goal is to increase sales by 30% this year, your KPIs might include metrics such as customer acquisition, conversion rate, and churn rate.
Metrics support KPIs to give you the full picture of your team’s progress towards the goal. Being clear on them will help you determine which metrics to track.
Understanding your KPIs and what data needs to be analyzed will also help you narrow down the analytics tools to include in your marketing stack.
What to look for in a digital analytics product
Digital analytics is as huge and multifaceted as digital marketing. There are hundreds of tools to help you measure every interaction a person has with your business along the customer journey.
However, the only tools that matter to you are the ones that help you achieve your goals (e.g., let you track the required metrics) and meet your budget. Assuming software ticks those boxes, here are five questions to ask to select products that deliver actionable insights.
1. Does the software offer multichannel integration?
Brand audiences today are “hybrid consumers,” interacting with brands across a mix of up to 20 channels, according to research by BlueVenn.
With each interaction, consumers expect their experience to be consistent. Delivering on this expectation requires you to be on top of what’s happening wherever you market your business.
While different tools have specific purposes, your main analytics software should provide multichannel integration to pull in data from multiple sources (e.g., web, mobile, email, and ad vendors). This will give you the big picture of your marketing performance while letting you assess how specific channels contribute to the customer journey.
For example, if you’re driving traffic to a landing page, multichannel integration will help you quickly see how click-throughs from email marketing and SEO are contributing. From attribution, you can identify which channels are most profitable.
2. Does the software offer customization around metrics, views, dashboards, and reports?
The software you use has to work with your current goals and KPIs, and adapt as those objectives change.
Check that you can customize the software to focus on data that matters. For example, with Google Analytics you can create custom dashboards to view specific metrics such as total traffic, session duration, and conversion rate. You can also import dashboard templates and use multiple templates to zero in on your chosen metrics.
Additionally, Google Analytics lets you create custom reports for goals, channels, landing pages, and more. This ensures you get the information you need to compare marketing performance and pull relevant data for other stakeholders.
3. Is it easy to use for both technical and non-technical teams?
Creating a seamless customer experience requires more than marketing expertise. Product teams, customer support, UX design, IT, and stakeholders will all contribute to achieving goals.
Software that benefits more than one department should be straightforward to use, search, and customize for data science teams and those without technical expertise.
This will ensure everyone has access to the data they need, when they need it, making teams more agile and able to tweak strategies quickly.
4. Does the vendor offer training and support?
Every analytics tool will have some kind of learning curve. Being able to access training resources reduces the chances of improper implementation.
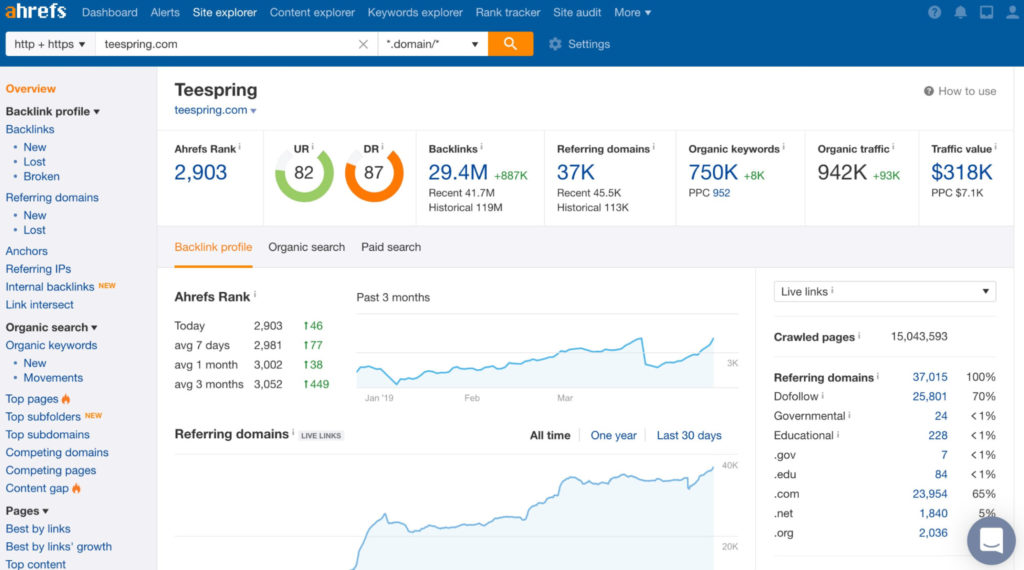
Ahrefs, for example, has a dedicated Academy with courses designed to help you make the most of its product:
Sprout Social gives users access to a Learning Portal that includes a Live Webinar Series and the chance to ask tutors questions about the product.
Along with training, check that each vendor has a dedicated support team. Even the most user-friendly of tools can throw up technical difficulties or require help with customization. At a minimum, the software should have a community forum where you can find answers from experts.
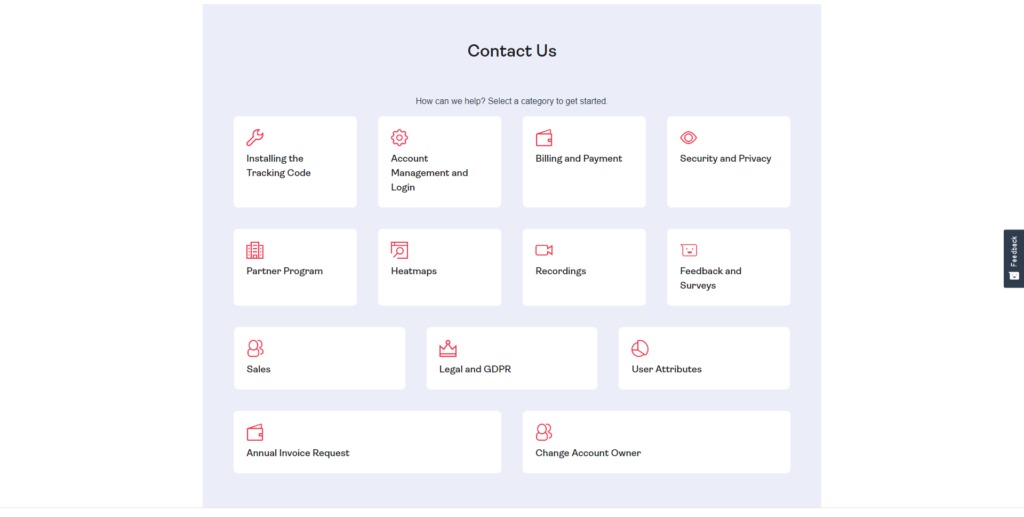
You should also be able to get in touch with customer support when needed via live chat, phone, email, or form submission.
For example, Hotjar’s help center provides guides and demos to solve common problems. If you still need assistance, you can get expert help for the specific category by submitting a ticket.
5. How does the vendor view user privacy, data security, and compliance?
GDPR and international data privacy laws prevent the collection of user information without specific permission. As you evaluate each platform, ask:
- What is the company’s stance on user privacy?
- How do they ensure that collected data is secure?
- How do they adhere to current legislation such as GDPR and CCPA?
Look closely at privacy and security policies to ensure your users and company are protected.
9 tools for your digital analytics stack
According to Forrester, 86% of organizations use two or more analytics tools for business intelligence. Some 61% use four or more, and 25% use 10 or more.
More than 10 seems like overkill. As Pyramid’s Chris Banks notes, too many solutions can be detrimental:
In deploying so many different analytics solutions throughout an organization, people’s trust in data erodes. There’s this nagging feeling that decisions are being made with incomplete data. Finance is working with their data, marketing is working with their data, and sales is working with their data . . . so does that mean everyone is making decisions based on the same underlying truths? Where’s the holy grail of the “single source of truth” you’ve tried so hard to establish? [via Pyramid]
Depending on your objectives, gathering the insights you need from a single platform like Google Analytics might be perfectly possible.
However, to get a full view of audience behavior, you will benefit from the right combination of tools to uncover alternative insights and compare results.
With this in mind, here are nine tools for your digital analytics stack. It’s unlikely you’ll need them all, but those that meet your needs will give you quality insights to make data-driven decisions.
1. For overall web analytics: Google Analytics
Cost: Free
Web tech analysts W3Techs found that 85% of all websites that use traffic analytics tools choose Google Analytics. It’s the go-to platform for over half of the internet and the best solution to start with:

Google Analytics automatically collects data, and integrates with other platforms like Google Ads. Use it to track goals and understand how visitors use your website.
- Measure internal site search to see what people are searching for. This will highlight popular products or content, as well as information that is unclear or lacking. Data can then be used to make your website more user-friendly.
- Track bounce rate to find out why visitors are leaving your website. A high bounce rate warrants further investigation. Is your landing page design confusing? Is it slow to load? Does the content sell the benefits of your product?
- Identify the demographics of your audience. Monitor age, gender, interests, and location to keep your marketing strategy targeting on point.
Do the people who visit your site match your target audience? Should you tweak targeting or change content to better suit customer personas? Analytics will answer these questions.
- Find social platforms to target. Track which social platforms drive the most traffic to identify where to focus your marketing efforts and budget.
- Keep track of content engagement to understand what to create next. Monitor page views and shares to identify content users are interested in. If a particular topic is popular, expand on it and repurpose content to reach new audiences.
- Monitor overall marketing performance. Monitor goals to ensure your business is moving in the right direction. For example, if your marketing goal is to increase newsletter subscriptions, Google Analytics will show you if you’re on track to hit your target.
If you prefer not to use Google products, Adobe Analytics is a great alternative that offers the same level of tracking.
Learn more about where to start with the GA platform in our Google Analytics course for beginners.
2. For content analysis: Parse.ly
Cost: Contact Parse.ly for pricing
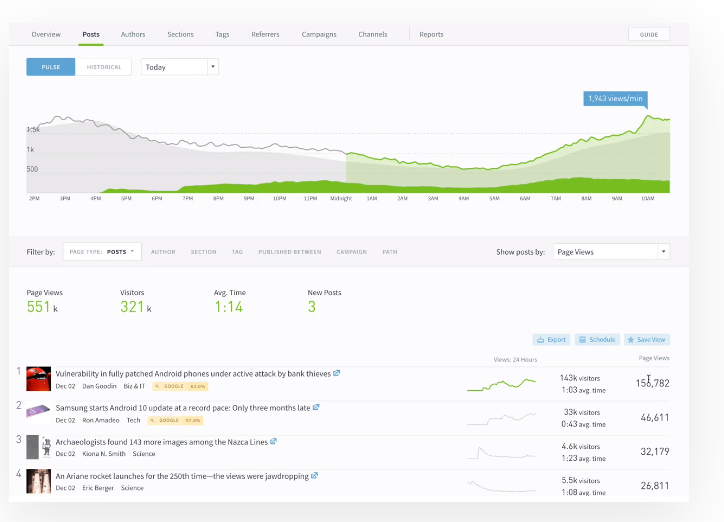
It’s possible to track content performance using Google Analytics. However, if you want a tool specifically for content that’s easy to use for marketers, writers, editors, and directors, Parse.ly gives you a more complete view of engagement.
Real-time and historical data is presented on a central dashboard, where data can be filtered by channel, source, author, and more. Parse.ly also pulls in data from social, search, direct traffic, internal traffic, and news platforms to give you a comprehensive view of content performance.
Use Parse.ly to measure engagement from visitors and subscribers, and identify new content marketing opportunities.
Its heartbeat feature lets you measure continuous engagement across blog posts, articles, videos, and interactive content. This gives you a clear picture of how people interact with your website in a way that Google Analytics doesn’t.
Parse.ly alternatives include Smartlook and Amplitude Analytics.
3. For customer analysis: Woopra
Cost: Free for the limited plan
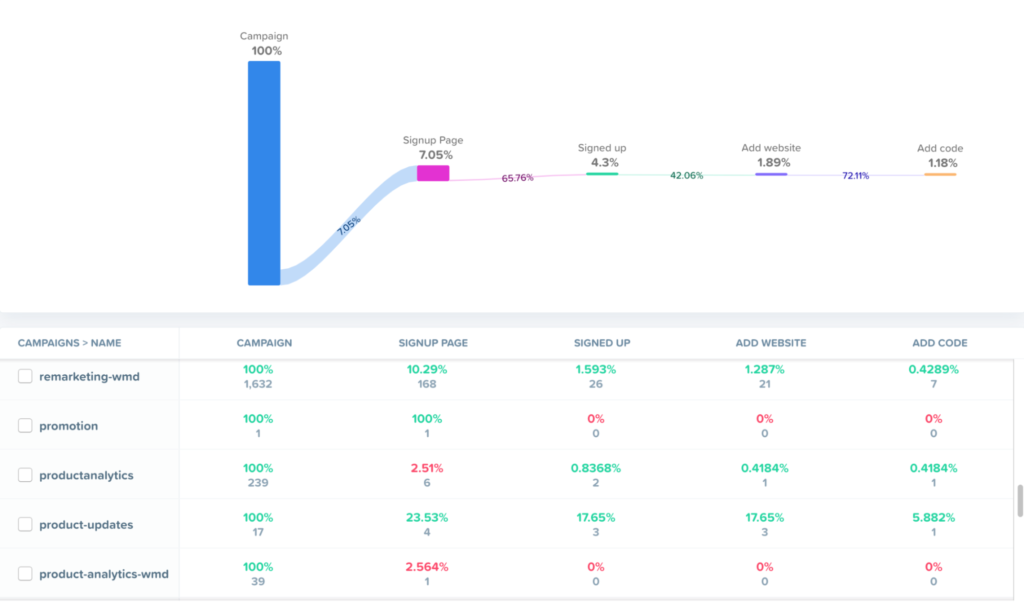
Woopra lets you delve deeper into customer behavior by pulling in data from different channels (e.g., web, social, mobile, and email).
Use Woopra to track the user journey to better engage and retain customers. As data flows in, the platform creates People Profiles that show behavioral history for each user, from the first touch point to conversion. It then lets you take real-time actions based on the data.
For example, if a user signs up for your newsletter, you can trigger an email sequence that welcomes and then nurtures them to buy.
The data Woopra delivers benefits marketing, sales, and product teams, and can be used to develop consistent user experiences.
Woopra alternatives include Kissmetrics and Mixpanel.
4. For UX analysis: Hotjar
Cost: Free for the basic plan
Hotjar uses heatmaps and data recordings to give you a visual analysis of how people are using your website.
It also lets you implement polls, surveys, and real-time feedback chat to ask customers about their experience. This gives you access to qualitative data that uncovers the reasons behind actions being taken.
For example, if a heat map shows that people don’t scroll beyond the hero section of your landing page, surveys can reveal why. Maybe visitors have all the information they need without scrolling. Or maybe content above the fold isn’t delivering the right message.
If your conversion rates are low, use Hotjar to identify weak points in your landing pages.
Hotjar alternatives include Crazy Egg and ClickHeat.
5. For A/B testing: Google Optimize
Cost: Free
Running A/B tests is crucial to create content that gets the best results for your goal.
For example, does adding social proof to a call to action increase conversions? What about the button copy and color? Small tweaks are often the difference between a person taking the desired action or leaving your site.
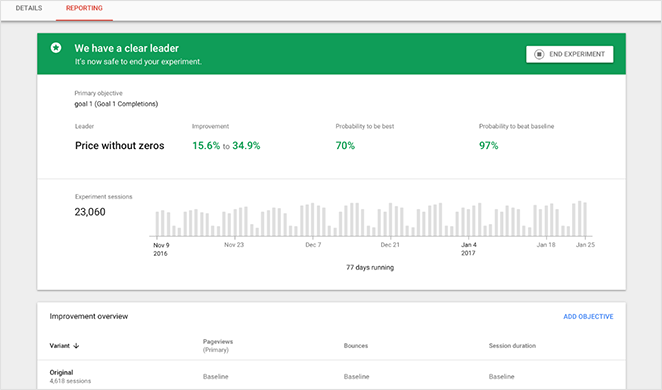
Google Optimize lets you create and run A/B tests related to your problem (e.g., a conversion drop-off). You can select who to target and when to run the experiment to gather optimal feedback.
As well as the standard variant A vs. variant B tests, Optimize lets you perform redirect tests to test different landing page designs, and multivariate tests (MVT) to see which combination of test elements creates the best outcome.
Google Optimize alternatives include Optimizely and Adobe Target.
6. For social analysis: Sprout Social
Cost: From $89 per user/month
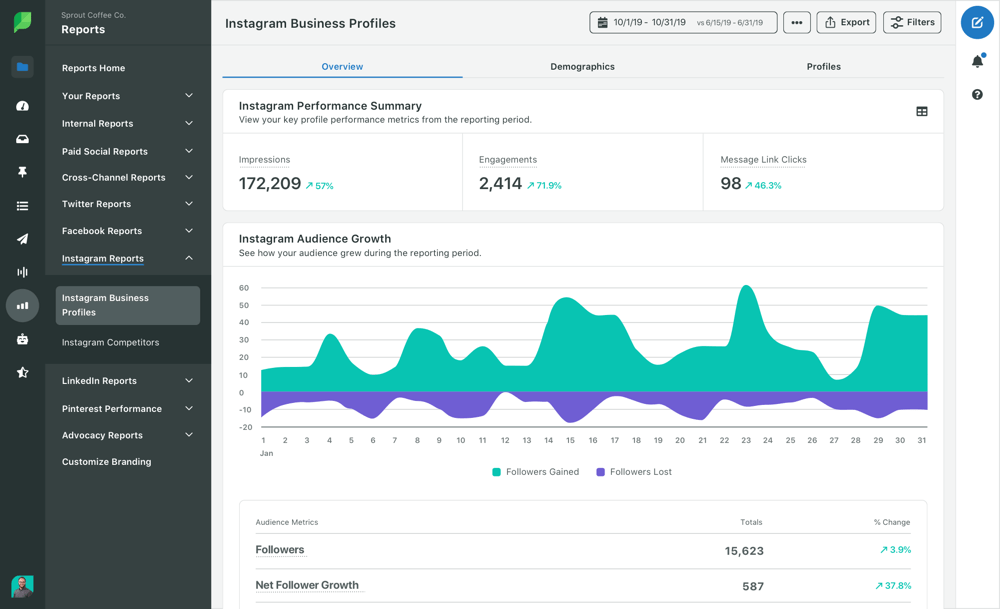
Sprout Social is an all-in-one social media management platform that lets you create, schedule, publish, and monitor social content.
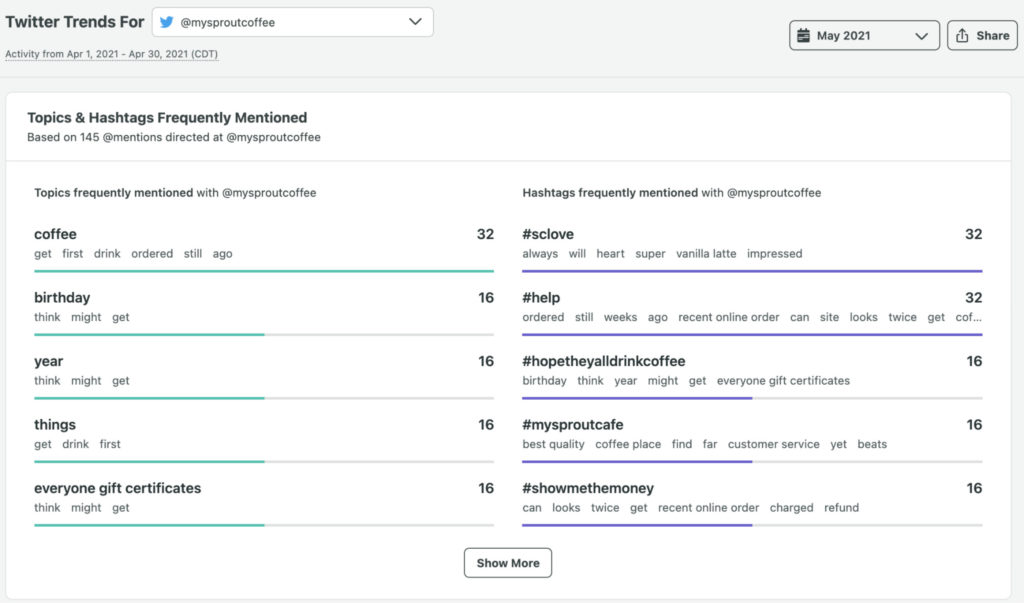
Use it to track keywords and hashtags, and analyze the success of your social media campaigns from a single dashboard. Sprout Social’s Trends Reports display frequently mentioned topics and hashtags related to your brand.
Charts also show the relationship between the two. On the one hand, this lets you identify customer issues (e.g., “fail” or “tired” trending is a sign that customers are unhappy). On the other, it surfaces trending tweets that can shape your content strategy and engage your audience around topics they care about.
Sprout Social’s insights also provide data on brand performance and industry performance so you can run competitor analysis and identify trends to influence your own campaigns.
Sprout Social alternatives include Hootsuite, Buffer, and Semrush.
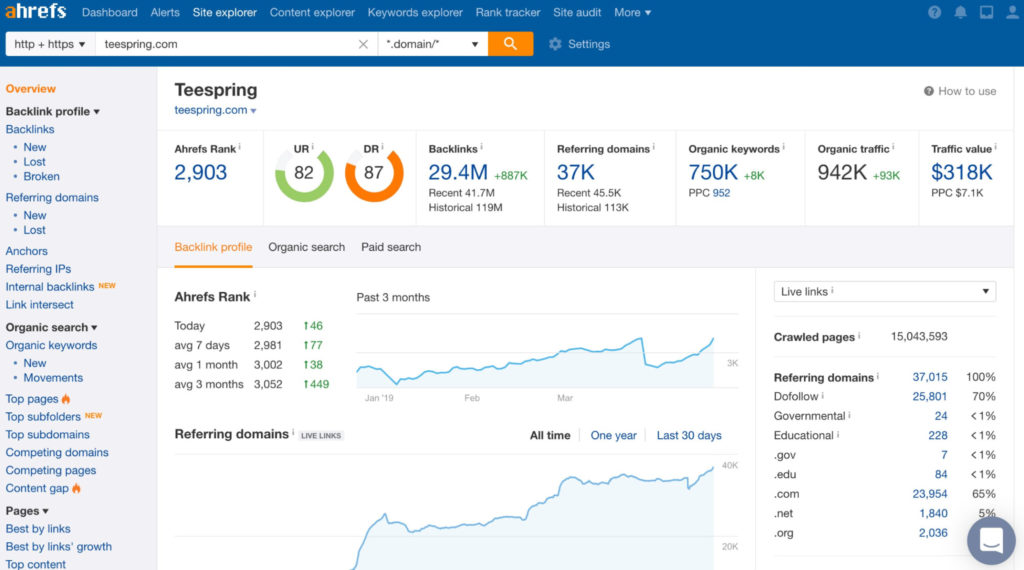
7. For SEO analysis: Ahrefs
Cost: From $99/month
Ahrefs is a platform that helps you optimize your website for search engines. Google Analytics features help you do this too, but Ahrefs goes deeper on the content side by giving you information to:
- Find out what people are searching for in your niche;
- Create content that’s likely to attract organic traffic;
- Identify link-building opportunities;
- Improve technical aspects of your website.
Use Ahrefs to uncover insights and gain a competitive advantage in search engine results pages (SERPs).
- Research keywords from multiple search engines (e.g., Google, Amazon, YouTube, and Baidu). This will help you tailor content marketing for audiences on different platforms.
- Analyze links pointing to your website to improve your backlink profile. Ahrefs lets you see the number of links over time, the quality of those links, and which pages of another website link to yours. This will help identify sites that are helping to boost your search presence.
For example, if you find that a popular blog is linking to your video, you can create similar content and reach out to bring it to their attention.
- Run technical SEO audits to check that your website is properly optimized for search engines. An Ahrefs audit highlights issues related to crawlability and indexation that prevent search engines from ranking your website in SERPs.
The audit results will give you the data needed to fix any elements that could hinder optimization, such as bad code or duplicate content.
Alternatives to Ahrefts include Semrush and Moz.
8. For enterprise-level analysis: Google Analytics 360
Cost: $150,000/year
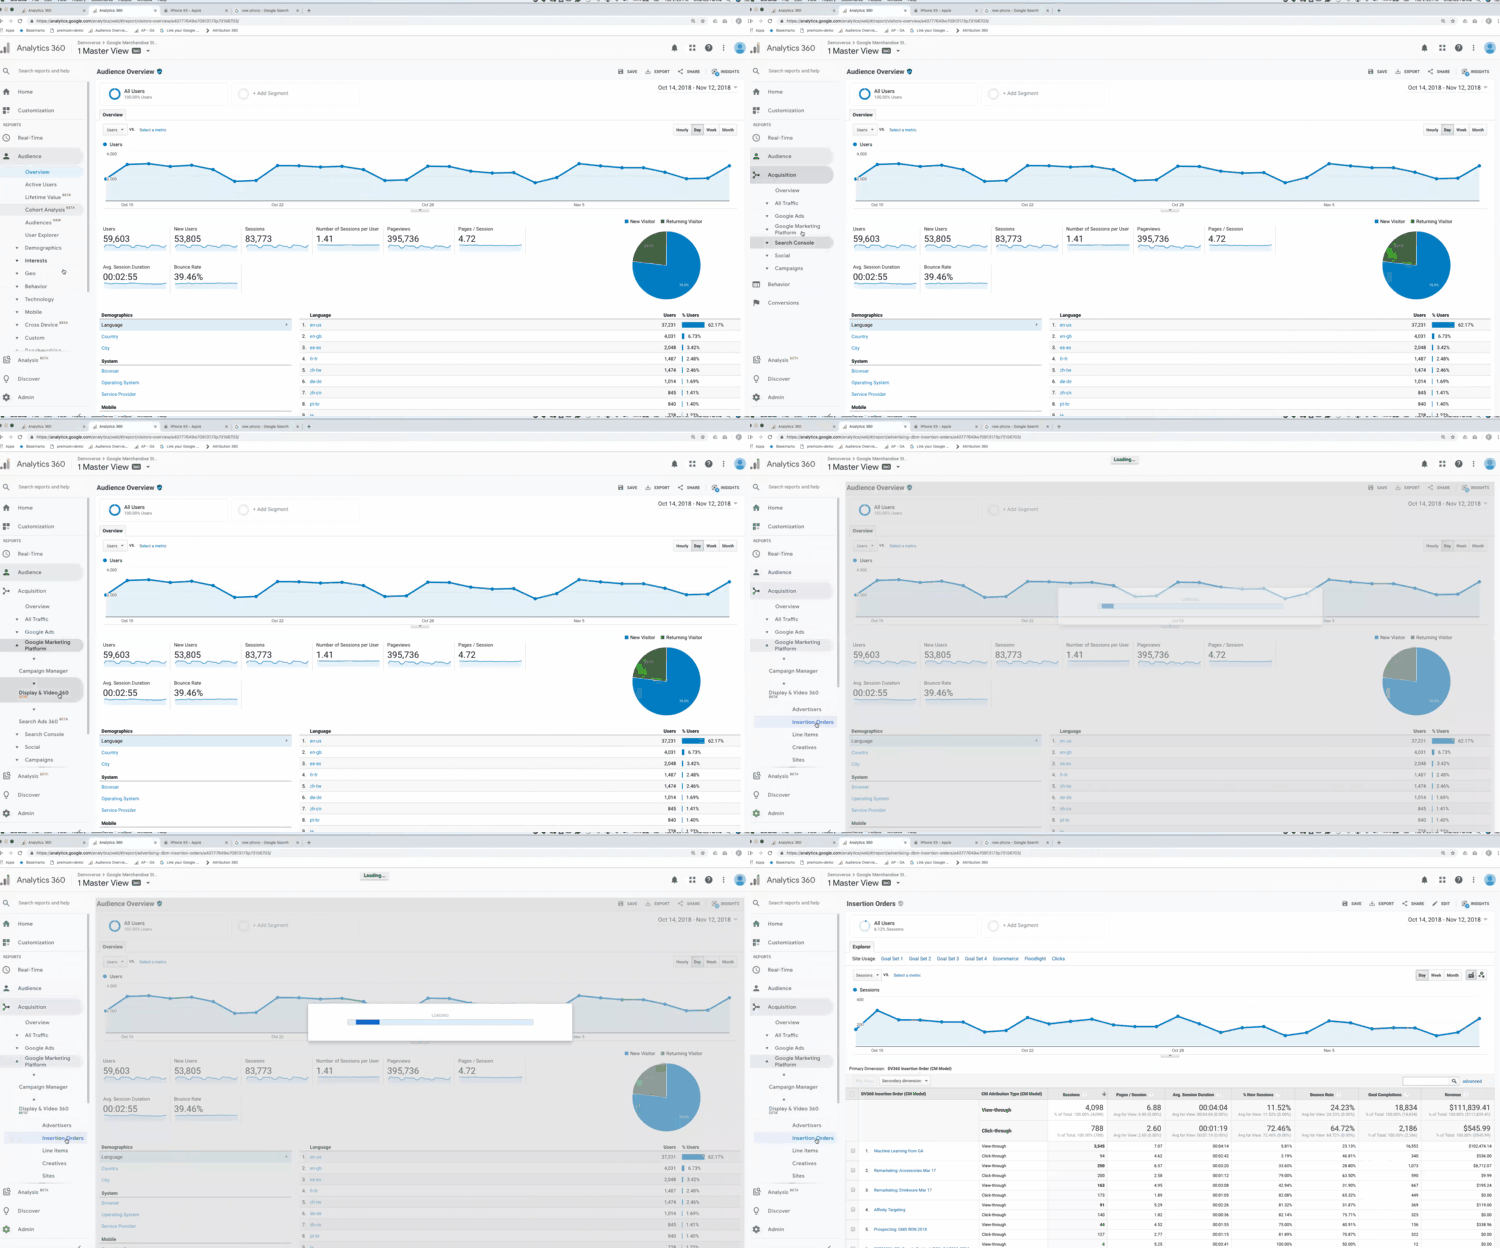
Google Analytics 360 is next-level Google Analytics. It’s designed for growing companies that are hit by the limitations of its free sibling.
For example, Google Analytics offers 20 custom dimensions and metrics. GA360 offers 200 of each.
It also comes with a range of additional benefits designed for enterprise-level needs. These center on:
- Connections between Google Analytics data and personally identifiable information;
- Integrations with a wider range of ad networks;
- Granular, actionable data visualizations.
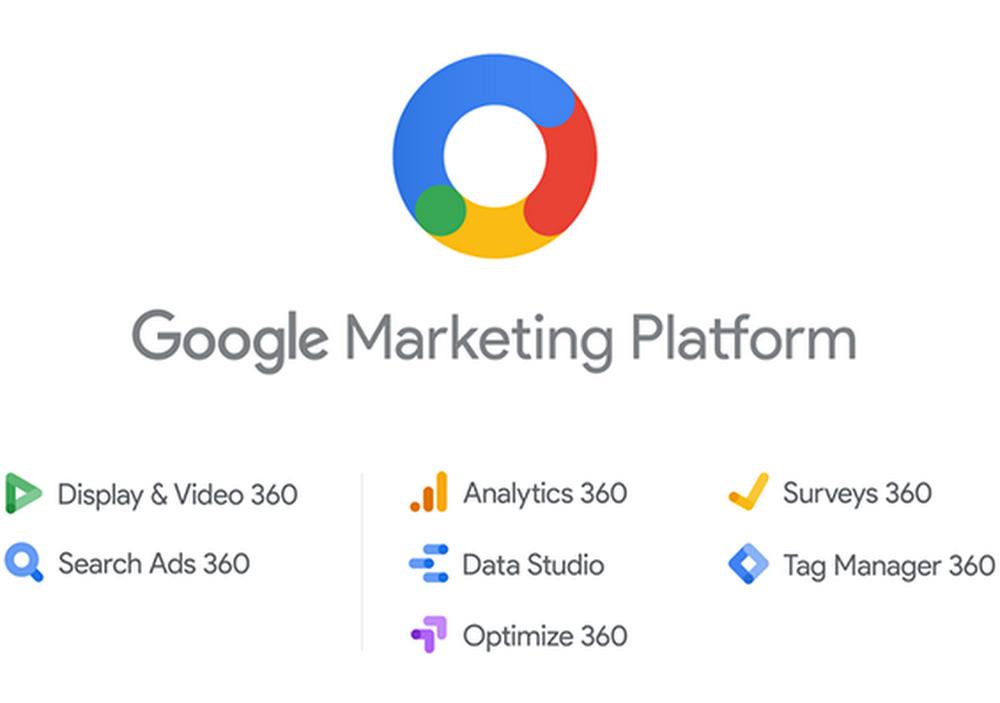
These extras come at a hefty cost: $150,000 per year, billed monthly at $12,500 with an annual contract. Although, you do get access to 360 versions of other products in the Google Marketing Platform.
To weigh up whether it’s worth bumping up from Google Analytics to GA360, check out the following posts:
- Google Analytics vs. Google Analytics 360 (Based on a Decade of Implementations)
- Google Analytics 360: The Features Worth $150k a Year
9. For data visualization: Microsoft Power BI Desktop
Cost: Free
Raw data alone doesn’t create change. It’s in the way it’s communicated. To connect the dots and help stakeholders understand what data means, use data visualization to bring insights to life.
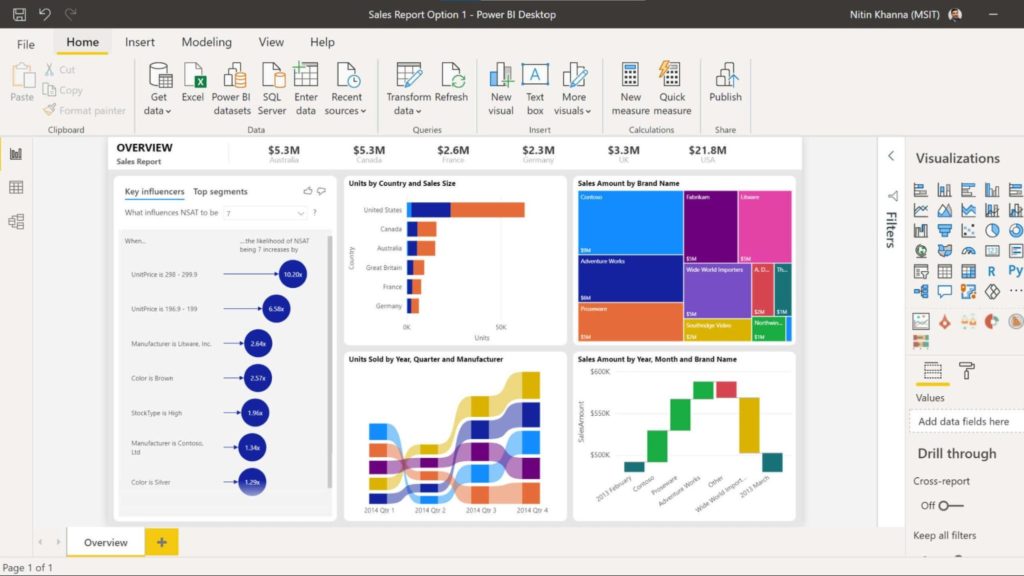
Microsoft Power BI Desktop is a free business intelligence tool that lets you create data dashboards and interactive reports, charts, and graphs to develop insights quickly and tell compelling data stories.
The above sample dashboard, for example, provides an instant overview of company market share, product volume, sales, and sentiment.
Charts help viewers process datasets and identify highs and lows quicker than would be possible when looking at numbers on a page.
Use Power BI to view and sell the value of your data using comparisons, correlations, changes in data over time, and ranking. The platform supports multiple data sources including:
- Microsoft Excel;
- Salesforce;
- Google Analytics;
- Google BigQuery;
- Adobe Analytics;
- Microsoft Azure;
- IBM Netezza.
This will ensure you can import data from other analytics platforms to visualize for different audiences.
Power BI Desktop alternatives include Tableau Desktop, Sisense, and Looker.
Each tool we’ve listed brings you useful data that can deliver actionable intel. It’s always good practice to question your data analytics, even from top tools, so you’re optimally interpreting the results and not increasing confidence in the wrong decisions.
Digital analytics training: Which course to choose?
This guide is a good place to start learning how to understand users and customers through analytics. But it’s only the tip of the iceberg.
Our Digital Analytics Minidegree offers a complete training program on Google’s suite of analytics tools from top marketers in the field. You’ll learn skills like data storytelling, attribution, and how to successfully communicate your findings to stakeholders.
Marketers with data analysis skills are in high demand, with Marketing Week finding one-third of brands identified this as a skills gap on their teams (and hiring to fill it). Use the Minidegree to land your next promotion, find a better-fit job, or just level-up your skills to secure your current seat for the future.
Conclusion
Investing in digital analytics is a commitment to learning more about your customers and optimizing marketing and sales to increase conversions.
Decide what you want analytics to help you achieve. Choose software based on your goals and budget. If your budget is modest, start small. Go with a free tool or plan and see how it helps your business. From there, you can scale up your investment, when needed, to uncover additional insights that improve customer experience.
When you’re ready to take the next step, build your skills in our Digital Analytics Minidegree.
