With more than 2 billion monthly active users and more than a billion hours of content consumed every day, the right Youtube strategy can increase brand awareness, engagement, and conversions.
But, cutting through the noise can be a challenge.
Strategically leveraging YouTube’s robust analytics can help you make data-backed decisions and improve performance.
In this post, we’ll tell you how to use YouTube analytics to grow your brand and generate more video content views.
Table of contents
Why YouTube analytics is critical for measuring content and paid ad performance
YouTube generated $19.77 billion in ad revenue in 2020. Ahead of both Instagram and Facebook, it has the highest ROI for video content. Done right, YouTube ads are a profitable endeavor.
But you can also accumulate significant exposure and revenue through an organic YouTube strategy. Best practice is to start with organic, understand what techniques work for your content, then boost with paid.
In both respects, you need to understand if your content and paid media efforts are performing. There are four key reporting areas within YouTube Analytics:
- Overview
- Reach
- Engagement
- Audience
As with most platforms, there are metrics that matter, and vanity metrics. Similar to app store optimization (ASO), it’s easy to fall into the trap of chasing shallow wins.
For ASO, this happens when you prioritize downloads over long-term value. Given that most users abandon apps within 30 days post-installation, high downloads don’t lead to high audience retention, satisfaction, or revenue. Time-to-value is much more important.
With YouTube, for organic, average view duration (AVD) and click-through rate (CTR) should be prioritized over YouTube search optimization, descriptions, tags, and other vanity metrics. YouTube elevates videos (and channels) that prove meaningful engagement, which is exactly what AVD and CTR do.
By elevate, we mean high AVD and CTR can get you into YouTube’s recommendation engine. 70% of the time, content users consume is recommended by YouTube’s AI and algorithm, so you want to be on this ride.
Why does YouTube elevate AVD and CTR? Both metrics represent high engagement.
AVD is total watch time divided by total video plays, meaning viewers watch for longer, and sometimes even replay. And a high CTR represents that your hook and thumbnail resonate with your audience enough to click and view.
Understanding which videos resonate and engage allows you to replicate success and optimize those that fall flat.
Once you do master your organic marketing strategy, you can bring YouTube ads into the game. With the right targeting and content, paid ads can expand your reach and revenue.
As with any marketing play, make sure to align your ads with the stages of the funnel. Choose an ad format and campaign that aligns with your end goals (e.g. are you looking to generate traffic or leads?).
The three most critical metrics for monitoring ad performance, especially regarding ROI, are View rate, CTR, and Earnings per view. These tell you how many people actually watched your videos, clicked on them, and the money earned per video view.
Of course, a video with low ROI can still generate awareness, expand impact, and lead to sales. Peripherally, you should monitor all metrics, but prioritize the ones that align with your goals and drive profitable traffic.
How to implement YouTube analytics
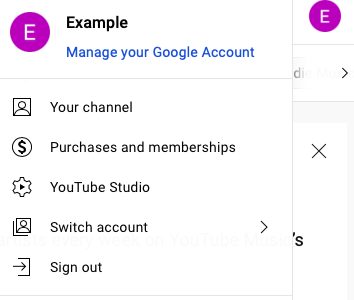
Setting up your YouTube analytics is straightforward. To start, go to your profile in the upper right corner and select YouTube Studio:
You’ll see a list of icons and options on the left-hand side of the screen beneath your profile icon. Select Analytics:
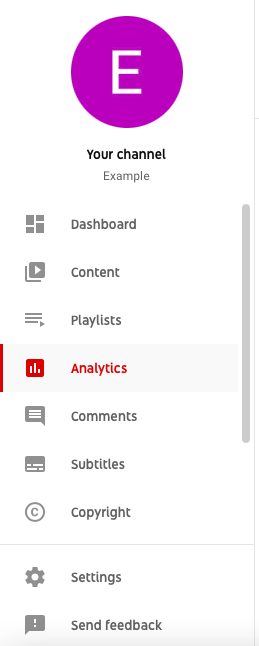
There are four Channel Analytics tabs in your dashboard (five if you have a Revenue option). Here, you’ll find detailed metrics regarding your account:

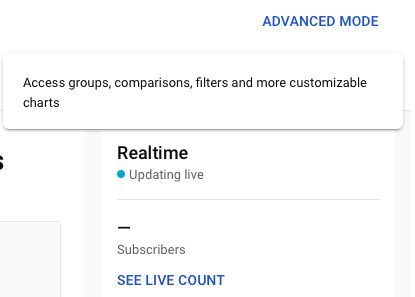
For more advanced analytics, select Advanced Mode in the top right corner. This will give you individual metrics for each of your videos:
You can also connect YouTube analytics to your Google Analytics (GA) account. This makes it possible to track performance directly from your GA dashboard.
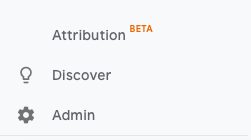
From your GA dashboard, click the Admin gear icon in the lower left-hand corner:
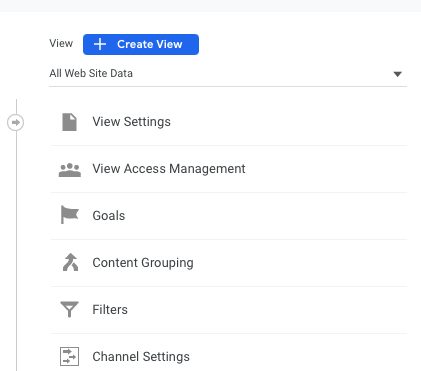
Then, select Create View in the upper right corner. Fill out the form by selecting a view name and choosing your time zone:
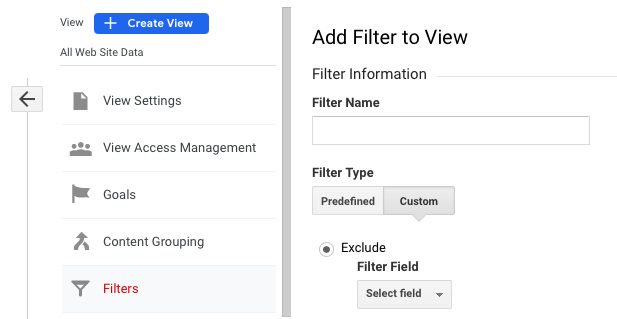
To create a filter that shows only YouTube traffic, select Filters. Name the filter and select Custom:
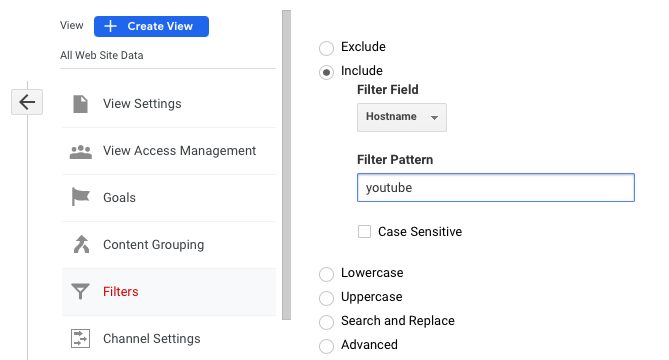
Next, click Include and choose Hostname from the drop-down menu. Type “youtube” in the Filter Pattern Box and save:
Getting the most out of YouTube’s reports
Here are some of the key reports you can run in YouTube Analytics, and how to leverage them to improve your strategy.
Overview metrics
The Overview tab is where you’ll find your overall YouTube channel performance analytics including:
- Subscribers
- Realtime views
- Top videos
- Channel watch time
- Channel views
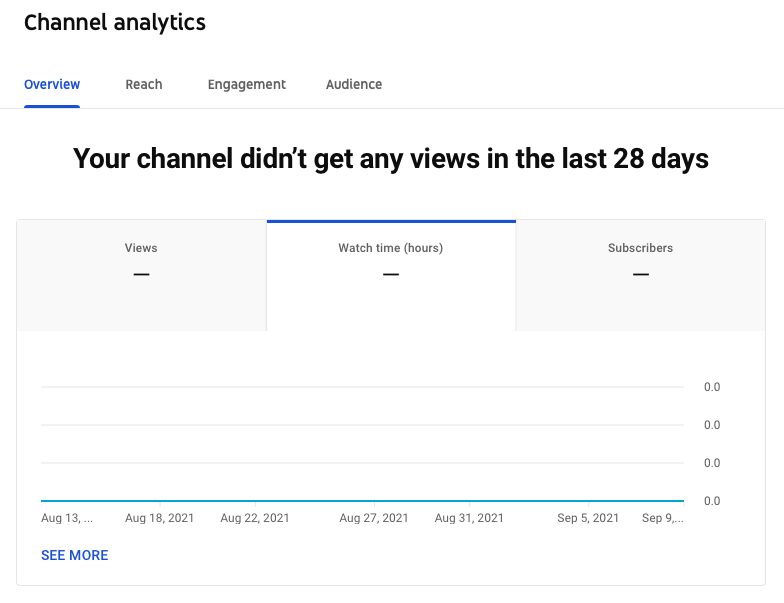
Use these metrics to identify average trends and get a quick snapshot of channel performance.
For example, subscribers are your most loyal fans. If your goal is to increase loyalty and engagement, pay attention to them. They watch 2x as many videos as non-subscribers. But that’s only if subscribers actually engage with your content and channel.
You want growing subscribers and growing watch time from subscribers to increase in tandem. This way, you can measure reach next to engagement to monitor if your videos are having the desired effect.
Reach metrics
If you are creating TOFU videos, the reach metrics is where you’ll learn how viewers are finding your content. Reach metrics include the following reports:
- Impressions
- Impressions click-through rate (CTR)
- Traffic sources
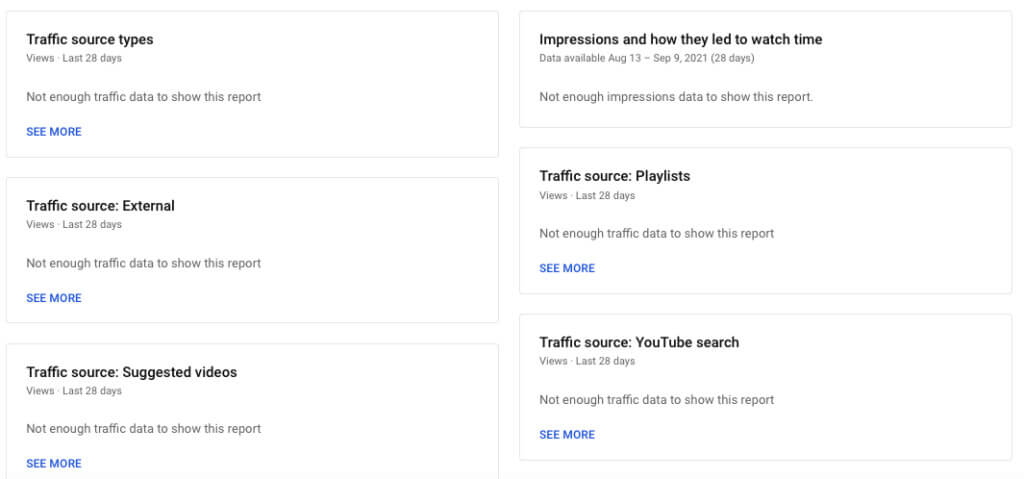
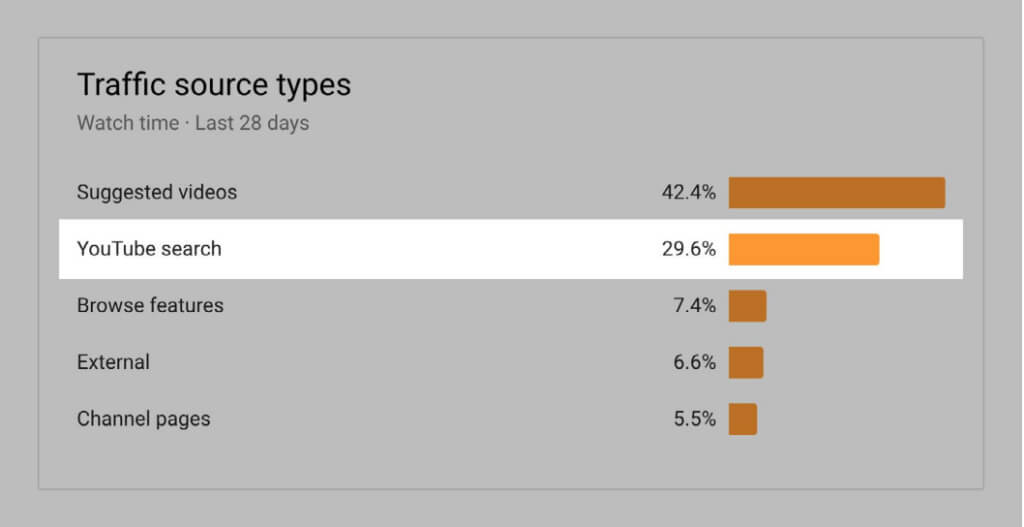
As mentioned above, most people find your content from YouTube’s recommendation engine. Only 15%-25% comes from search. The rest are served up as suggested videos or accessed via browse features:
You should still optimize videos to rank for keywords, especially if awareness and reaching a larger audience is important. But Google prioritizes “Video Keywords” when it comes to ranking. Video Keywords represent keywords that already are tied to videos on the platform.
Brian Dean puts it this way:
“In my experience, if you optimize your video around a keyword that doesn’t already have a video in Google, it’s going to be VERY hard for it to rank. The simplest way to find Video Keywords is to search for your potential keyword in Google. If you see at least one video result in the top 10, great. If not, you may want to consider a different keyword.”
Don’t waste your time trying to make a nonvideo keyword rank. Also, focus on video keywords that have a result in one of the top three spots in Google. 55% of all clicks come from these top-ranking keywords.
Engagement metrics
For your MOFU content, focus on the Engagement metrics tab. This gives you insights into how viewers are interacting with your videos, including:
- Average view duration
- Top playlists and cards
- Top videos and top videos by end screen
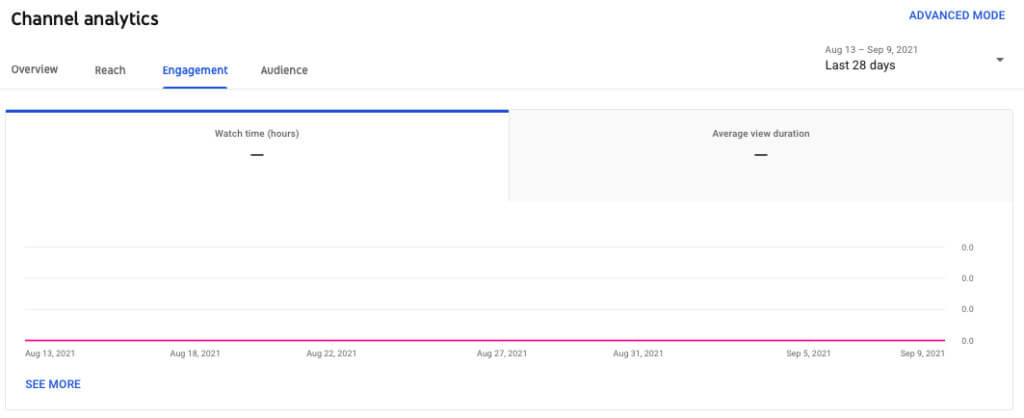
We’ve explained why AVD is given so much weight in the recommendation engine. But what about playlists?
Good playlists promote replays. With playlist reports, you can see how individual playlists are contributing to your channel’s performance. Also, session watch time increases every time people watch your playlists. This is important.
Session watch time, like AVD, shows how long viewers spend interacting with your content. Longer sessions lead to better engagement. YouTube loves this, as it means people are spending more time on their platform.
One way to optimize session watch time is to optimize playlists. An easy trick is to make adjustments to the video order. If you have a poor-performing playlist (or an old one that’s lost traction), simply reorder the individual videos based on video performance.
Use Analytics to see which videos are being viewed the most and move them to the top of the playlist:
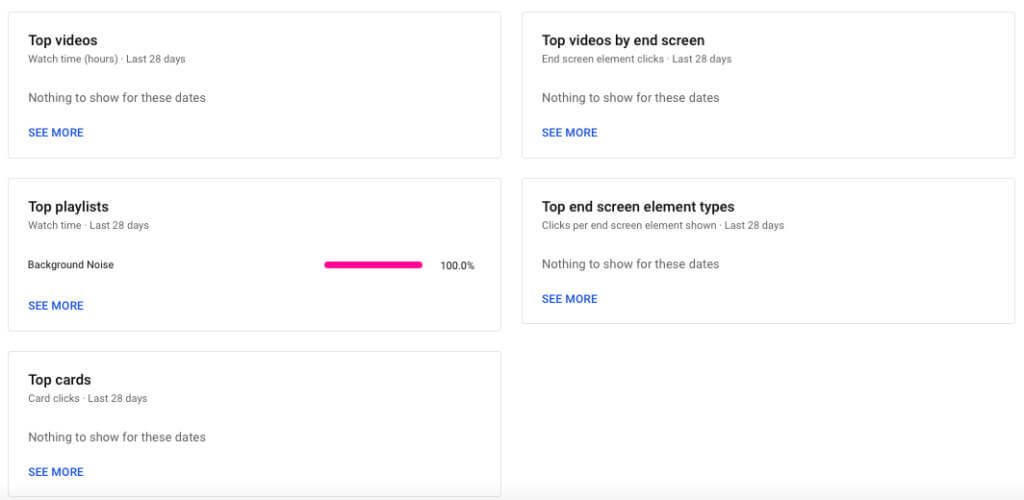
By frontloading the most engaging videos, you hook your audience in and boost the chances they’ll stay around for the duration of the playlist.
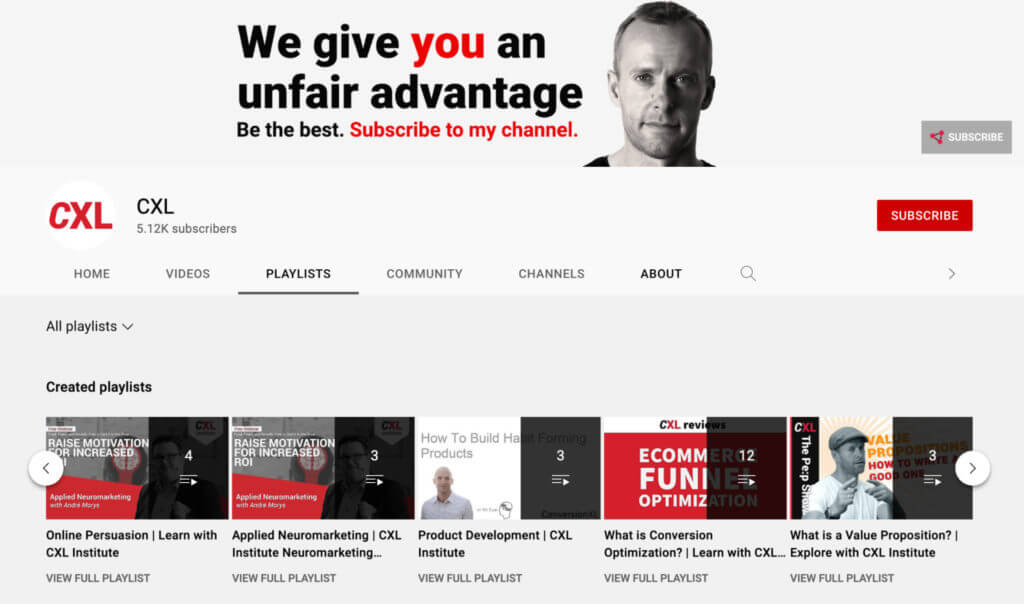
Also, make sure your playlists align with your core messaging. Who is your channel for? What is that person trying to achieve? We target experienced marketers looking to scale and drive conversions, so our playlists speak to the topics they care about:
Audience metrics
The audience tab will show you who is watching your content. Here’s what you’ll find:
- Unique viewers
- Returning viewers
- Watch time from subscribers
- When viewers are on YouTube
- Audience demographics
- Top geographies
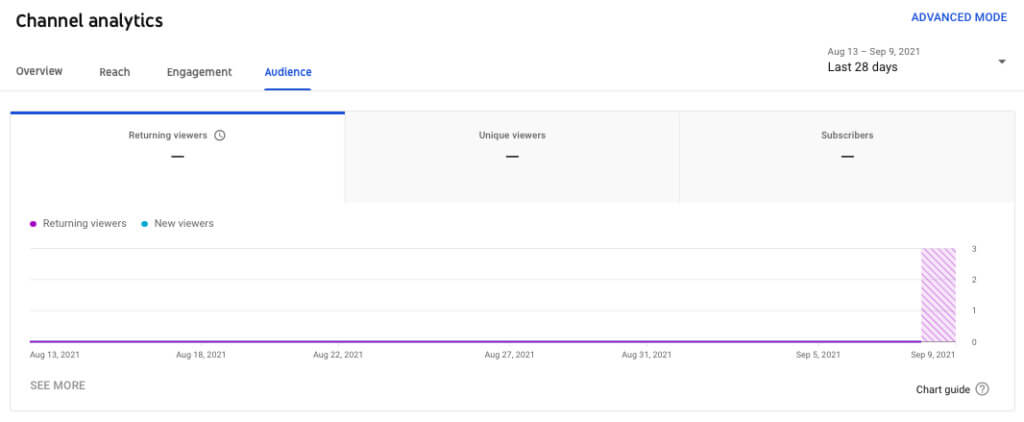
We mentioned watch time from subscribers earlier. This metric matters because subscribers alone can be a vanity metric.
But subscribers that engage are like rewards members that make frequent purchases. Their intent (subscribing, or signing up for a program) actually matches their behavior (watching videos, or making purchases to unlock rewards).
To increase subscribers, make sure you have a great UVP. Potential subscribers must understand:
- Who you are
- Why they should care
- What makes you different
- What value they’ll get from subscribing
Create a compelling trailer that answers these questions right off the bat. And make sure to include CTAs at the end of every video.
Revenue metrics
This tab isn’t available for everyone’s YouTube analytics. If your account is eligible for monetization features, then this tab helps you track your earnings. To become eligible, you have to be accepted into the YouTube Partner Program (YPP).
To qualify to join YPP and run ads on YouTube videos, you need to have more than 1,000 subscribers and more than 4,000 valid public watch hours in the last 12 months.
Here are some of the reports that live within monetization:
- Estimated revenue and estimated ad revenue
- Revenue Per Mille (RPM)
- Transaction revenue
- Estimated monetized playbacks
Earlier, we noted that View rate, CTR, and Earnings per view matter above all. You can access key YouTube Ads metrics by creating reports from within your Google Ads account:

If your ads aren’t effective, they’ll have a low view rate, which signifies people are skipping them. A low CTR means few people are clicking on your ad, so it’s not generating interest. Low earnings per view can mean a number of things.
If you have high view rates and CTR, but low earnings, there’s clearly a barrier to purchase. For example, a CTA that prompts putting money down in a TOFU ad (the CTA here should be to learn more, not hand over money just yet). Or, your landing page could be broken, or have broken CTAs within it.
As for the revenue you can see from YouTube Analytics, RPM is important because it gives you a snapshot of ad earnings per 1,000 views. It represents revenue after YouTube takes their share, so it’s net earnings rather than gross:
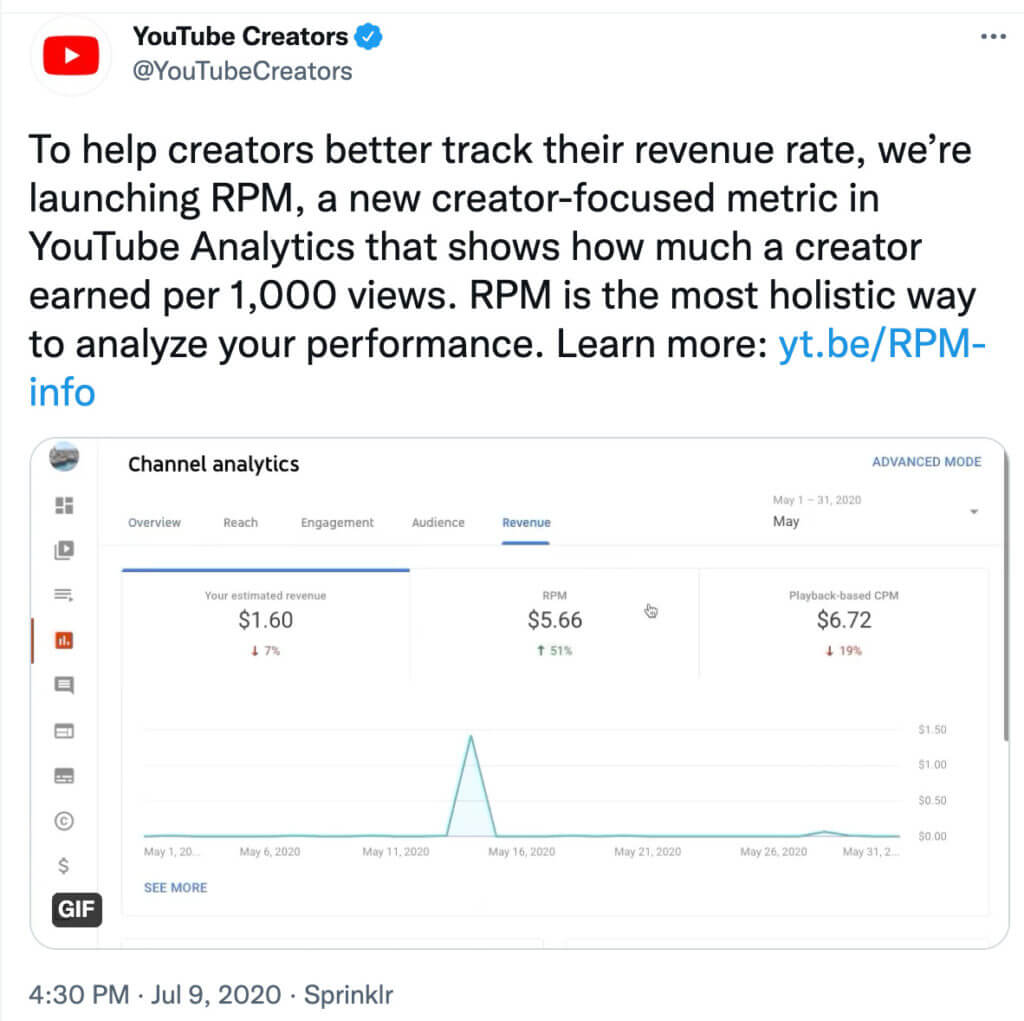
With this data, you can better contextualize earnings while still measuring which videos have the most impact.
How to optimize video content by analyzing your competitors
Comparing your content to competitors in your industry helps identify gaps and opportunities in your strategy. You can find what’s trending in your niche, what type of audience base your competitors have, and what elements are successful in their videos.
You don’t need additional software or expensive tools to conduct a competitor analysis.
Identify competitors in your industry
Find competitors on YouTube by searching for similar products, services, locations, and keywords. Make a list of a few competitors that have an active presence and a strong following.
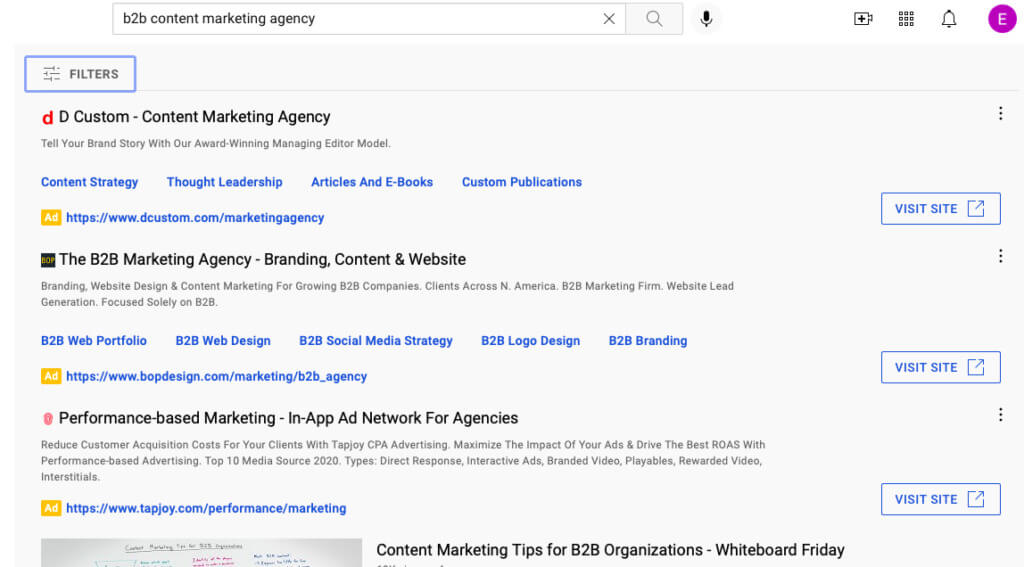
For example, if you owned a content marketing agency, you could look for “B2B content marketing agency” or “content marketing” to see who has videos that rank:
You can also use keyword research tools, like Ahrefs and SEMrush, to augment your competitor research.
In Ahrefs, set the Keyword Explorer Report to YouTube and search for “content marketing”. This will let you view search volume and identify potential ancillary keywords to target:
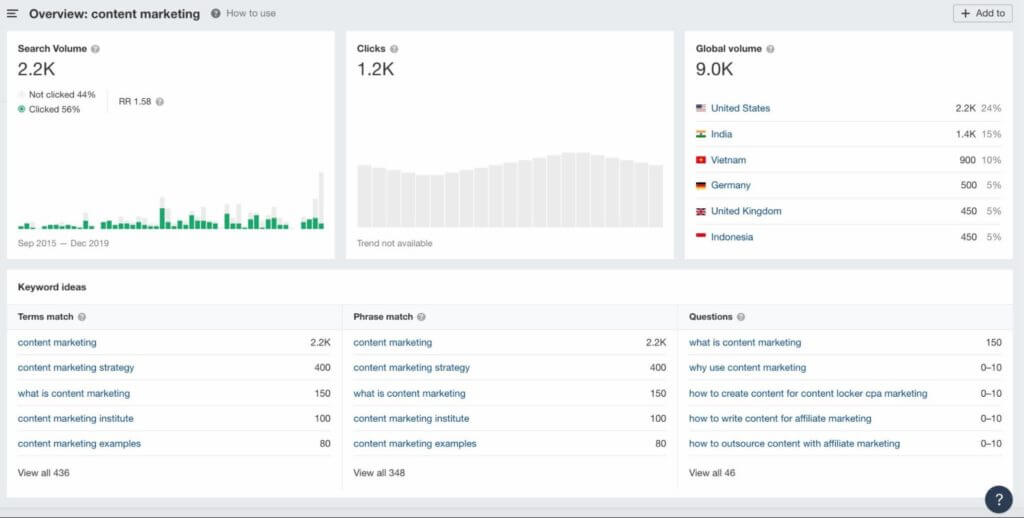
You can’t leverage this to see who’s currently ranking for these keywords, but you can use it to identify what content to produce next. (Remember, videos that are tied to top-ranking keywords are easier to rank for yourself.)
Review their video content
Look through the competition’s videos, and analyze the following:
- What type of content is getting high engagement?
- What type of videos are they creating?
Take outdoor-products brand Yeti. Their YouTube page is built for brand storytelling. Almost every video tells a story, and only sometimes features their products.
Importantly, every video involves somebody doing something in nature, and people that spend time outdoors are their target audience:
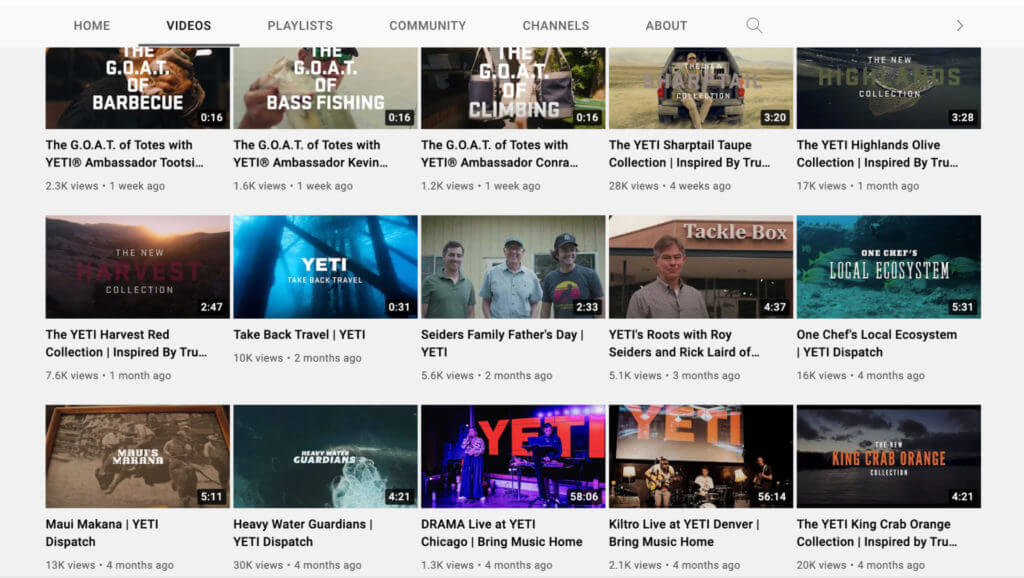
Clearly, it’s working. Not only do they have high view counts, they have extremely positive engagement:
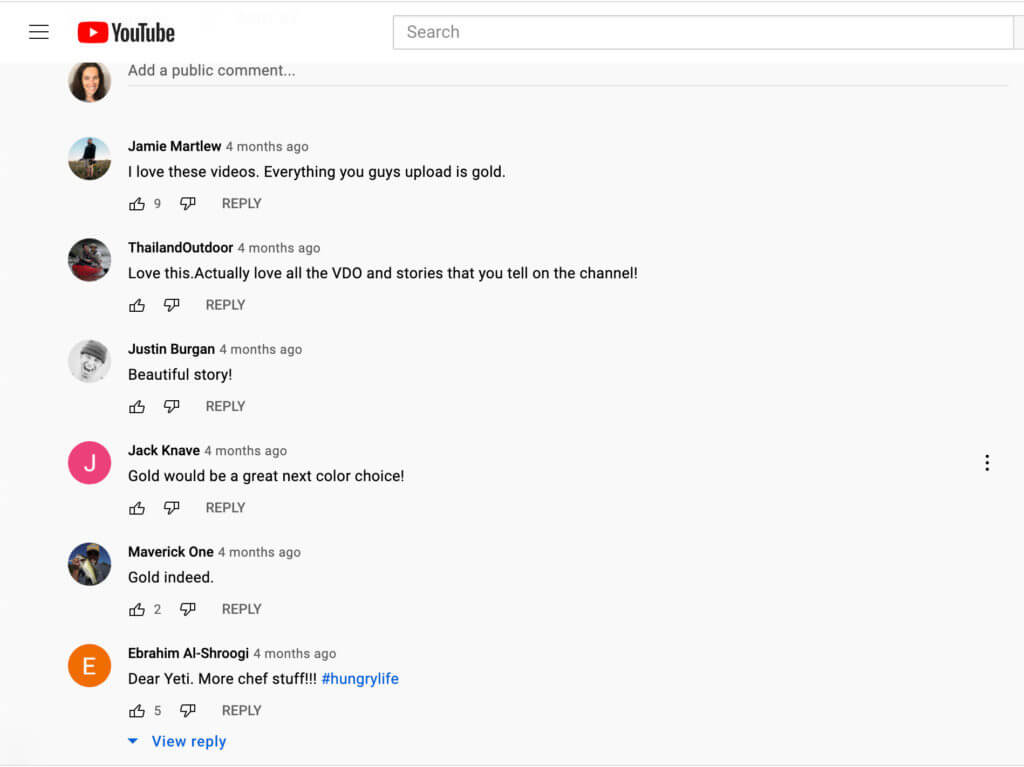
If Yeti was one of your competitors, it would be worth seeing if storytelling resonates with your audience, too.
Freemium tools like BuzzSumo can help you turbocharge this research. You can analyze all of their content, see what gets the most shares, analyze the keywords they are ranking for, monitor content performance, and explore untapped growth opportunities (that they are ignoring).
And, Tubebuddy is well-known among Youtube marketers as the browser extension of choice for more views and subscribers. The platform is designed to help you research, publish, optimize, promote, and test content quickly. The extension comes with advanced keyword research, time-saving templates and tools, and simplified A/B testing.
Conclusion
YouTube is an excellent platform to build brand awareness, engage an audience, and generate revenue.
On its own, YouTube analytics is a powerful tool that can be used to grow your reach and revenue. Paired with Google Analytics and data-gathering tools, you can focus on metrics that matter and hone in on what’s working (and where there’s room for improvement).
Be sure to regularly monitor your metrics to stay on top of trends and keep tabs on your competitors to take advantage of opportunities in your niche.


