We spent a lot of time talking about bounce rates, but Google Analytics has another mysterious metric to offer: exit rates.
Unfortunately, the two metrics are often misunderstood and used interchangeably, when it is their subtle differences that make them useful metrics.
This article will walk you through the difference between bounce rate and exit rate, the importance of the two metrics, and how to reduce exit rate.
Table of contents
What is bounce rate?
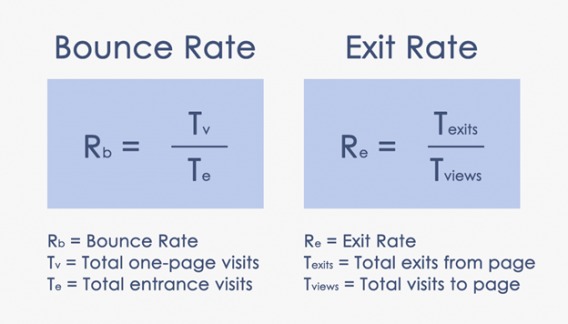
As Google defines it, bounce rate is determined by calculating the number of bounces over the total number of pageviews to a page.
A bounce occurs whenever a user enters the page and subsequently exits without visiting another page on the website or interacting with any of the elements on the page (e.g. commenting).
What is exit rate?
The exit rate, on the other hand, is determined by the number of people who exit your website after landing on a page and compares it to the total number of views the page received.
What is the difference between bounce rate and exit rate?
We already have the definitions:
- Bounce Rate: the percentage of single-engagement sessions
- Exit Rate: the percentage of exits on a page
Unfortunately, Google’s definitions of these metrics make it very easy to confuse the two since they sound so similar. After all, the basic goal of these metrics is the same: calculate the percentage of people who leave a page after opening it. There is one significant difference.
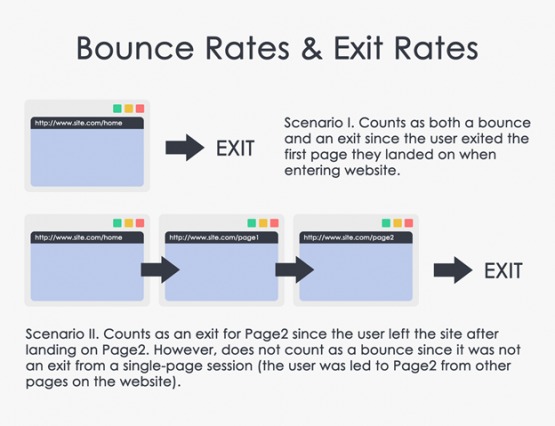
Exit rate is the percentage of visits that were the last in the session whereas bounce rate is the percentage of visits that were the only one of the session.
This means, bounces are only recorded if a user exits directly from the page they entered while exit rates are recorded regardless of a user’s prior activity on your website. Therefore, all bounces are exits but not all exits are bounces.
To clarify the difference, we can consider a simple website with four pages: Home Page, Product Page, Confirmation Page, and Contact Us Page. We can imagine five different sessions to this website over the course of a week.
- Monday: New Visitor > Home Page > EXIT
- Tuesday: New Visitor > Home Page > Product Page > Confirmation Page > EXIT
- Wednesday: New Visitor > Home Page > Product Page > EXIT
- Thursday: New Visitor > Contact Us Page > EXIT
- Friday: New Visitor > Confirmation Page > Contact Us Page > EXIT
Out of the above five sessions, there were only two bounces.
Even though exits occurred on all five days, bounces occurred only on Monday and Thursday because those were the only two days where the visitor exited as soon as they entered the site. On every other day, the visitor visited at least two pages before exiting.
For these five sessions, the following Google Analytics report would be produced.
- HOME PAGE: 3 entrances | 3 page views | 33% bounce rate | 33% exit rate
- PRODUCT PAGE: 0 entrances | 2 page views | 0% bounce rate | 50% exit rate
- CONFIRMATION PAGE: 1 entrance | 2 page views | 0% bounce rate | 50% exit rate
- CONTACT US PAGE: 1 entrance | 2 page views | 100% bounce rate | 100% exit rate
Therefore, a high exit rate doesn’t necessarily equate to a high bounce rate since users might have landed on the page from somewhere else on the site. Similarly, a low bounce rate does not mean a low exit rate since bounce rate doesn’t account for most exits, only those that occur on the first page the user lands on.
Always remember that exits can be more than one-page visits while bounces are always one-page visits.
Which metric is more important?
Short answer: both.
The thing about bounce rate and exit rate is that they sound extremely useful in concept and in the abstract, but are difficult to interpret correctly.
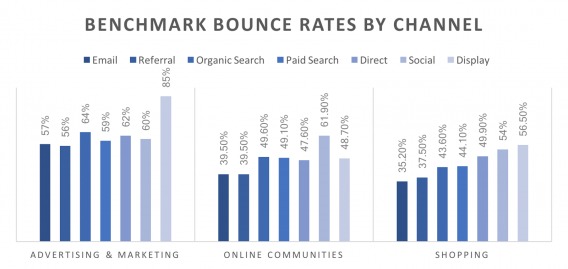
For example, average bounce rates don’t give you much actionable insight since some pages might benefit from higher bounce rates (e.g. contact information pages) and some types of website might be predisposed to higher bounce rates (e.g. blogs). Check out Bounce Rate Benchmarks: What is a Good Bounce Rate? for a more in-depth discussion of what baselines you should be shooting for.
That being said, let’s go back to the original question: Which metric is more important?
It should be unsurprising to you that both metrics are important depending on purpose. While a high bounce rate usually signals problems with user satisfaction – whether it be in context of content, site quality, loading speed, etc. – a high exit rate usually signals problems in your conversion funnel. Therefore, you should choose the metric you optimize for based on the problem area you are trying to tackle.
Let’s focus on exit rate for a second, though, since we have covered bounce rate extensively in other sections of this guide.
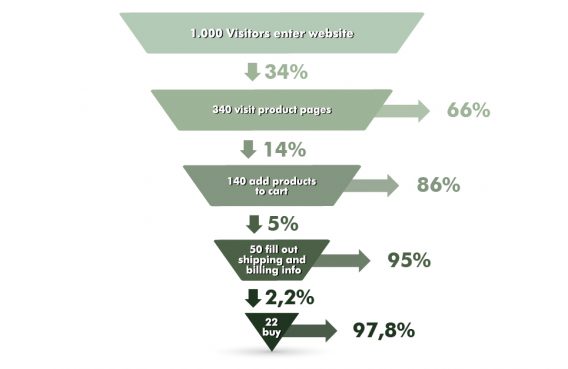
There is reason to prefer exit rate in place of bounce rate when analyzing your website funnel and user journey. While bounce rate only records loss of users when users landed on that page directly, exit rate accounts for all exits. The following scenario helps clarify the implications of this difference.
Consider an eCommerce website…
Most users will arrive at the site from the home page.
From here, they will then travel to a product page featuring an item they are interested in buying.
Your exit rate here will reveal greater insights. If your exit rate is high on a page like this, it means something is wrong with either your product page or even the product itself that causes originally interested buyers to leave after checking out your product.
Therefore, be cautious not to ignore exit rate in favor of bounce rate.
How do you reduce exit rate?
If your webpage has a high exit rate when the intent of the page is to push the user further down your conversion funnel (e.g. lead them to a different part of the website), you might want to make some adjustments.
First, you’ll need to determine why people are leaving. A couple of common explanations are:
- Distracting Content: music, video, and obtrusive pop-ups can cause early exits
- Slow Load Speeds: users (especially mobile users) will give up after about 3 seconds
- Bad UI/UX: poor page design and structure can leave your users confused
- Navigation Issues: unclear pathing and/or lack of linked content spells “dead-end”
Second, you need to give your users a reason to stay.
This doesn’t mean simply fixing navigation issues or site design. Rather, you might want to consider revisiting your conversion funnel.
For example, it is typically accepted that eCommerce confirmation pages have high exit rates, but do they need to? Of course not. There is always room for improvement. For example, you might want to link related products the buyer might be interested in to guide them further down the funnel.
Here are some useful conversion funnel articles you might want to check out:
- Funnel Analysis: Finding and Fixing Conversion Problems with Google Analytics
- How to Design an eCommerce Checkout Flow That Converts
- eCommerce Checkout Funnel Review
Third, you may want to consider installing live-tracking and/or heat-mapping software to help you understand how users interact with your site, where they are clicking, and where their focus is. Software like Inspectlet, Hotjar, Clicktale, and FullStory are good places to start.
Conclusion
In the end, which metric you use depends on the context of your analysis and your optimization goals.
Do avoid, however, focusing on aggregate bounce rates and error rates. Instead, segment your data and target specific pages to find holes in your funnel and problematic areas.
Lastly, consider exit rate within the context of your overall site structure and design. Pages that don’t lead to further clicks are often perfect spots for optimization.
Read Next Lesson or Download guide as PDF
-
Bounce Rate in Google Analytics
Since Google Analytics is far and away the most popular web analytics tool, it pays to know exactly how bounce rate is calculated in Google Analytics. -
Bounce Rate Benchmarks: What’s a Good Bounce Rate, Anyway?
"What's a good bounce rate?"...common question, not a super clearcut answer. This piece will explore bounce rate benchmarks and give you a good baseline understanding of where you may stand. -
Email Bounce Rate: How to Manage Soft & Hard Email Bounces for Better Performance
While most people think of bounce rates in terms of website analytics, email bounce rates are a thing, too. -
The Top 4 Ways to Lower Bounce Rate
Now for the meat of the guide: how do we lower bounce rates? -
The SEO Impact of Bounce Rate (What You Need to Know)
Does bounce rate affect SEO? Some say yes, some say no, but this article spits the truth of the matter. -
Bounce Rate vs. Exit Rate: What’s the Difference?
Unfortunately, the two metrics are often misunderstood and used interchangeably, when it is their subtle differences that make them useful metrics. -
Conclusion
Summary and wrap up.
