In the big picture, “conversion optimization” boils down to getting more of the right people clicking on the things you want them to click.
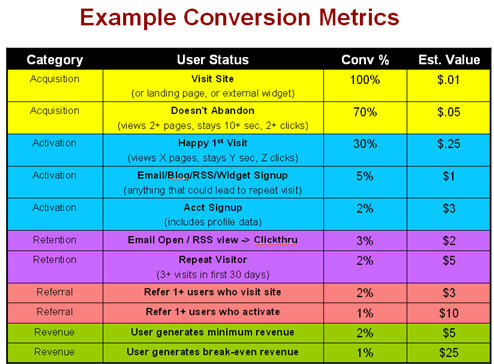
Dave McClure’s conversion metrics visualize where different conversion optimization opportunities lie—including those for acquisition.
Acquisition focuses on how to grab attention in a very crowded content environment. Strategies span a range of methods, but we’re going to focus on PPC, social media, and search.
Table of contents
- What is Traffic Acquisition Cost (TAC)?
- You’d better understand—really understand—your target market
- Getting visitors at the top of the funnel
- Yes, capture attention—but don’t be irrelevant (or offensive)
- Finding your target market for PPC and display ads
- Lure in your market by split-testing ad creative
- A data-driven approach to social media marketing
- Use data to find the best way to publish on Facebook
- Use data to improve your Twitter headlines
- Re-optimizing for search traffic
- Conclusion
What is Traffic Acquisition Cost (TAC)?
Traffic Acquisition Cost refers to the incurred costs of a company in order to obtain high-quality traffic.
You’d better understand—really understand—your target market
Your success online is directly proportional to how well you understand your target market.
If you don’t know anything about your best customers, how can you acquire more like them? How can you expect to get referrals or understand what prospects will click if you’re just guessing?
If you have only a few customers, one of the easiest wins is to find areas within your funnel that are primed for building feedback loops.
This areas might include:
- Welcome emails;
- Purchase receipts;
- Thank you pages;
- Surveys for customers who’ve been with you for 3/6/12 months;
- Unsubscribe pages.
Build these feedback loops to understand the people behind the order numbers and email addresses. What do they need? Where do they “hang out” online?
This feedback can improve your acquisition strategies, your value proposition, and your processes on every level.
If you don’t have customers, our articles on customer development and how to write compelling copy without customers can help you get started.
Recommended reading:
- It’s Not a Conversion Problem, It’s a Customer Development Problem
- How to Structure (and get the most out of) Customer Development Interviews
- How To Identify Your Target Market & Make More Sales
- Personas
Getting visitors at the top of the funnel
Now that you have a deep understanding of your customer, I’ll tell you something that you’re not going to like: People aren’t searching Google to click your text ad or browsing Facebook to see your sponsored story.
To get attention, you must create something that speaks directly to your target user’s needs and is worth interrupting their usual browsing patterns.
Pringles, for example, created a banner ad that told a fun little story and encouraged visitors to click over 90 times. The result? Massive coverage on Twitter, Reddit, and other relevant sites (as well as a Gold Cyber Lion from Cannes).
The Australian Air Force ran a banner ad on an Australian IT news website with a clever incentive to click:
Upon inspecting the source code, visitors would find the following:
Even with a limited budget, this ad won an advertising award, massively increased job inquires for the Australian Air Force, and reduced the average cost per enlistment.
Considering that the “ad” was hidden in the source code of the page, it spoke exclusively to the target market—nobody else could see it!
Yes, capture attention—but don’t be irrelevant (or offensive)
It’s tempting to do the digital equivalent of shouting from the rooftops, but remember that you’re after quality traffic, not just random visitors.
Avoid sensationalist headlines or “shock” graphics unless those tactics align with your overall brand messaging.
The above is a good example of what not to do. It got attention (and probably some clicks), but at what cost? It’s too bad, because Tradesy is normally on point with their brand messaging.
Controversy for controversy’s sake is rarely a good idea.
Finding your target market for PPC and display ads
It’s tempting for PPC managers to go after the highest number of clicks, but without measuring the lifetime value of the customers who come from those clicks, you’ll waste a lot of time and money.
- Do most people look at the page and close it right away?
- Are you satisfied with the conversion rate from visitors to leads?
- Of those leads, are you satisfied with the conversion rate from leads to customers?
You want clicks from people who are will move through your sales funnel with the least amount of friction.
Most of the battle is doing the market research to understand what potential visitors might search for, what synergistic “interests” they might have, and where they hang out.
If you don’t understand where your target market spends time online, how can you test anything to bring them to you?
Recommended reading:
- Pay-Per-Click Marketing: More Than Just The Right Keywords
- 4 Advanced Facebook Targeting Techniques Every Facebook Advertiser Should Know
- The Definitive Guide To Ads Display Targeting
Lure in your market by split-testing ad creative
Only once you understand where your market “lives,” and the segments within it (e.g., problem aware, solution aware, etc.), start testing your ad creative to see what gets their attention.
To avoid burning a ton of money, start testing your ad creative on a sample group that’s large enough to get reliable data but not so large to cost you a fortune.
Once you’ve found some ads that convert reasonably well given the whole picture (i.e. impressions, CTR, conversions, profitability), increase the budget and roll them out to more people to see.
HubSpot has an article on split-testing tips for Facebook ads—they’re great guidelines for your ad campaigns. Let’s walk through them.
1. Change one variable at a time.
Your main variables are the title, the picture (if any), the copy, and the targeting.
Given your research, you should test radically different approaches for each segment of your market, as well as gradual iterations that test one variable at a time.
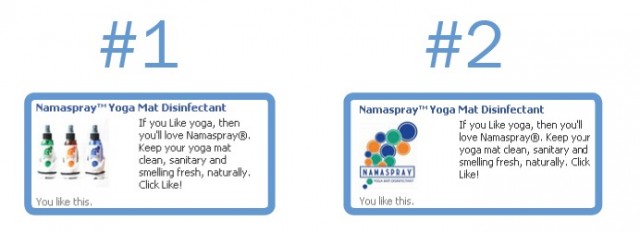
In the example from Facebook below, the picture is the only variable that changes:
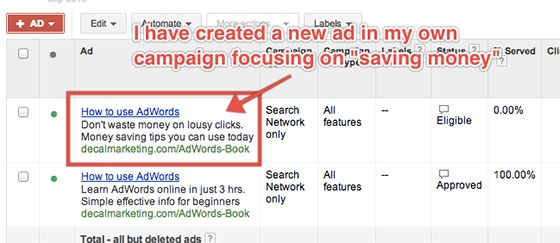
Decal Marketing changed the body copy in their ad to focus more on “saving money,” while the second used language to target beginners:
2. Keep similar ad conditions.
Similar conditions means the same time of the day, same bid (although bid prices vary), same length of time, etc.
Pro tip: Compare only those ads that ran in similar conditions (e.g., location, devices, start and end dates, etc.). If you change them, it’s impossible to know for sure which variable did the trick. Don’t overlook this.
3. Glean insight from your reports.
On the surface, it might look like one variation is winning, but that doesn’t mean that it’s the best one.
What matters is not just the number of people who clicked your ad but, of those visitors, how many responded to your call to action on the destination page.
Long term, you should look into the lifetime value of customers who came from specific ads, or if visitors from one ad converted faster than others.
While that’s a conversation for another day, even here, “optimization” doesn’t just occur once on a single page. It can impact the entire customer lifecycle.
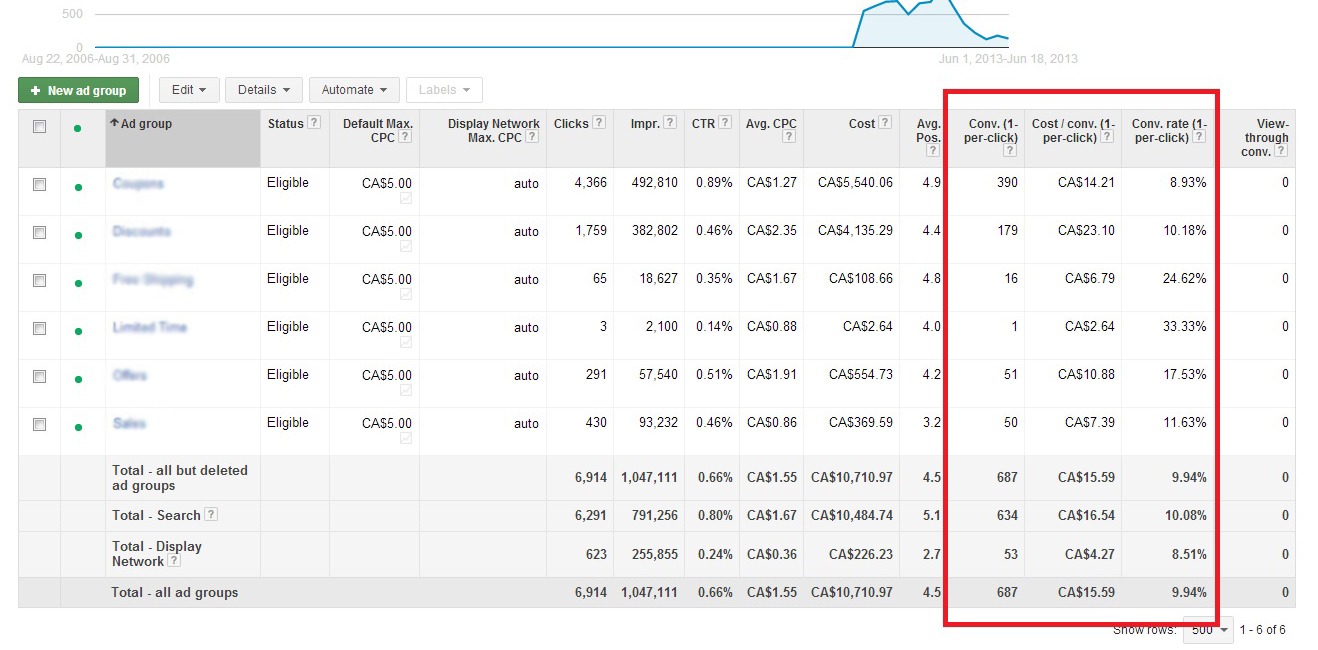
On the above picture, you can see how your ads convert, how much it costs to acquire that conversion, and the conversion rate.
At first glance, the second ad group seems to be converting better. But it also costs double to get those conversions. You may notice the second ad group is for “Discounts,” so even if the conversions are good, the profit margin is less.
If these ads don’t bring in customers who buy at full price, you’re spending money that you won’t get back.
4. Realize when it’s time to create a new ad.
It’s tempting to endlessly tweak an under-performing ad. Sometimes new body copy or adding a symbol can make all the difference in the world.
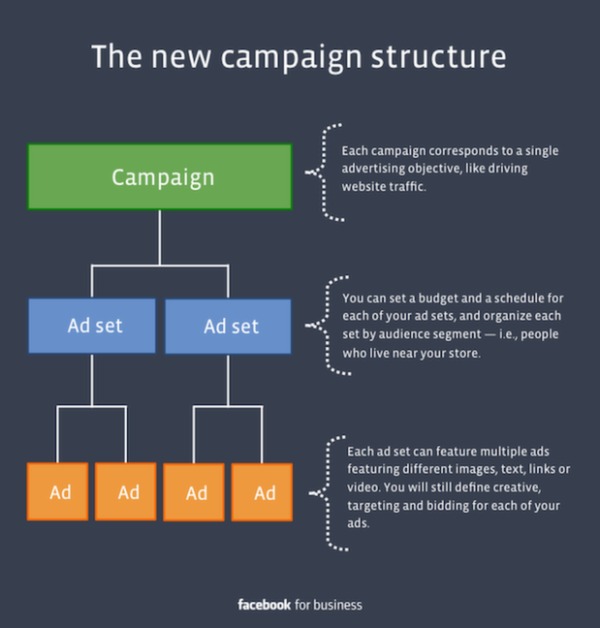
Other times, you need to know when to kill your darlings. Fortunately, in Google Ads, you can target on the campaign and ad group level, so you can write ads specifically for that target group. Facebook has a similar structure.
With this level of granularity, it’s possible to test multiple ads that target the exact same people. If you feel like an ad isn’t performing properly, switch the “likes and interests” targeting while maintaining other targeting parameters, like gender and location.
5. Rotate your ads often.
Even a well-performing ad will wear out its welcome.
How often you rotate an ad depends on factors like the medium, number of unique impressions from that medium, and how many variations you’re running in the same ad set.
Facebook users and popular blog readers, for example, tend to visit more frequently. Therefore, they’re exposed to your display ad more often.
If you’re split-testing two or three ads in a set and notice that one slides off the radar, pause it when it performs around 20% worse than the others (or sooner).
However, if the ad that’s slipping in CTR is a killer at converting, it might be unwise to dump it until it’s under a 1% CTR.
Measuring performance against yourself is still more important than arbitrary benchmarks. Your ad could be a low-performer due to seasonal changes, events, or simply that you’re measuring against a temporary traffic spike. Don’t approach PPC with a “set it and forget it” attitude.
6. Understand what’s visually appealing to your market.
Why create display ads in the dark when you have a wealth of data about what your market finds visually appealing?
What do I mean?
A graph search on Facebook shows you the general visual style that appeals to people.
A search for “favorite bands of fans of Peep Laja” reveals a darker, grittier theme among the visuals. This is relevant because the people connected to the page have already indicated:
- They’re interested in the band.
- How the various bands, movies, television shows, etc., speak to a larger visual preference.
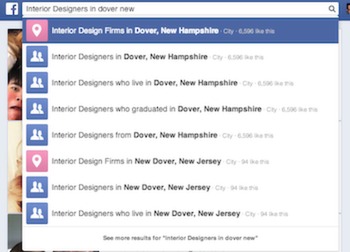
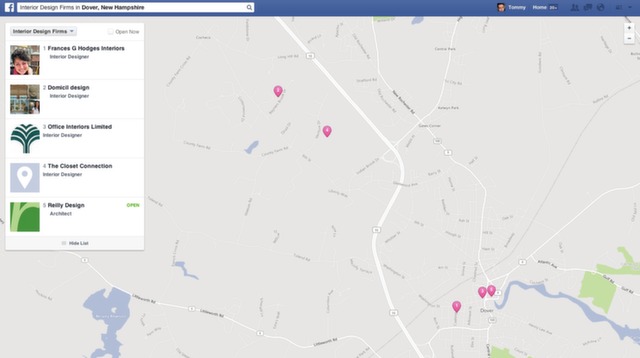
Let’s look at how to apply this in a real-world situation. Imagine you had a client who sold interior design services and wanted to run a display campaign.
Instead of guessing which styles might appeal to your core (or local) market, you can do a little competitive analysis to see what resonates with people nearby.
First, see who your competition is:
Once you have a list of who your Facebook Savvy competitors are, a search like “Photos posted by [Competitor]” will show you all of the most well-received images posted by the page:
At first glance, this might not seem like much, but it looks like fireplace, bathroom, and living-room designs get the most attention. There’s also a rustic feel to these photos, which gives some indication of this particular audience’s preferences.
Looking at the most-liked photos starts to reveal a theme. With a little creative thinking, you have a possible direction for a display campaign:
This isn’t the only way to go about finding inspiration, but it gives you indirect market feedback to come up with more informed ways to get your market’s attention.
Tangential Bonus: If you do a graph search for “Pages liked by fans of [competitor page]” and add those pages to a dedicated Facebook list, you can get a real-time feed of the images everyone is using to grab your market’s attention.
Recommended reading:
- Finding High Converting PPC Keywords That Are Right Under Your Nose
- Using Negative Keywords To Attract Highly Qualified Customers
- Google Conversion Tracking: Complete Guide to Conversion Tracking in Ads
- Infographic: 26 Ideas For Split Testing Your Search Ads
A data-driven approach to social media marketing
When it comes to social media, the first thing you need to figure out is where your ideal customer is “hanging out” and to whom they’re connected.
Second, realize that there’s a whole world of “social media” beyond Facebook pages and branded Twitter accounts:
- Facebook groups;
- Twitter hashtag chats;
- Instagram hashtags;
- Shared Pinterest boards;
- Specialized forums;
- Comment sections on blogs.
These are just a few places where your target market interacts with one another.
Where and how you engage depends on who your target market is and how ready individuals in those groups are to hear your “pitch.”
Beyond that, different people conduct themselves differently on various platforms. As a byproduct, they also expect different kinds of content to fit within the culture of the platform.
I’ve got to do something different in Tumblr than I do in Facebook because the audience is different. If you want to win, you need to roll different. We’re in slang marketing now. You have to know the slang of the room you’re storytelling in. Otherwise you’re out. You can act really out of touch real quick.
Gary Vaynerchuk
Use data to find the best way to publish on Facebook
Assuming you have some people who aren’t your friends and family connected to your social media accounts, analytics dashboards can show you how each piece of content performed.
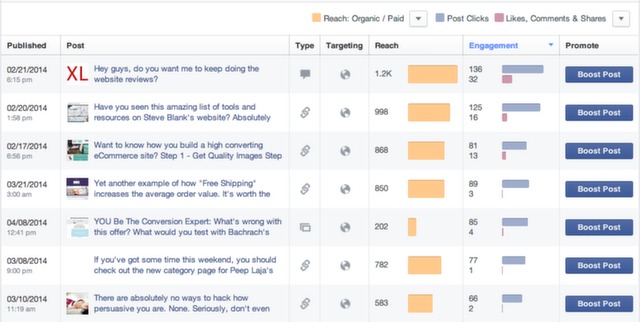
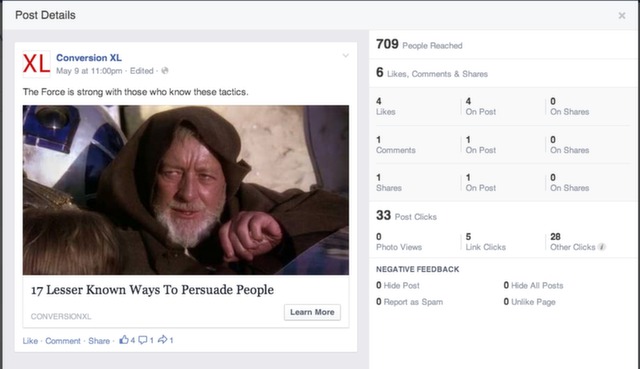
Facebook, for example, gives you loads of info, including how many people saw the post (Reach), the type of content (links, photos, status, etc.) that got the most interactions, how much engagement each post gets, and more.
With this data, you can move away from the “post everything we publish” Facebook strategy and instead curate high-performing content based on past performance.
In the CXL example above, the top seven posts:
- Asked for interaction (1. website reviews; 5. you be the conversion expert);
- Gave valuable tool lists (2. Steve Blank resources; 6. category page for website reviews);
- Related to ecommerce or design (3. high converting ecommerce site; 4. free shipping; 7. persuasive design).
Beyond that, there’s also something to be learned from the image types, how the post was worded, and the subject matter.
For example, I’ve learned that UX & Persuasive Design articles perform better on Facebook, while analytics posts perform better on Twitter.
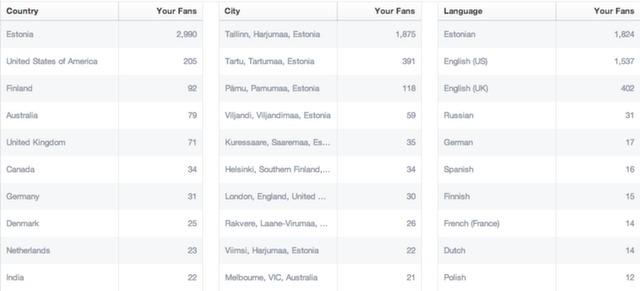
Outside of content, Facebook insights also help you understand when your fans are most active, where they are, common languages, and demographics.
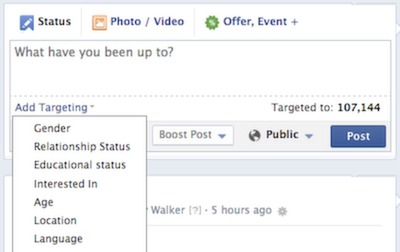
This data combined with Facebook’s advanced targeting lets you display posts to specific genders, relationship status, age, location, etc. You can publish the right content to the right people at the right time.
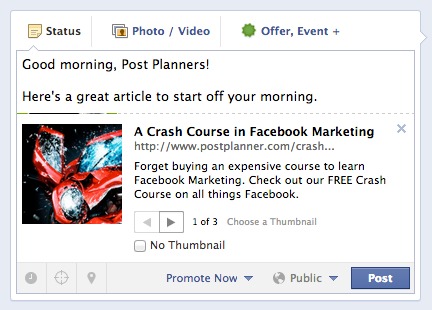
The team over at Post-Planner experimented with a post that said “good-morning” to their Facebook audience at 7 a.m. in local time zones and languages.
Early reports showed an increase in organic reach of 10–20%, which is huge considering Facebook’s efforts to drive organic reach down.
It comes down to understanding how the channel actually operates—not how you’d like it to operate. If you do that, you can continuously refine the way you present your content to get more clicks, comments, shares, reach.
Recommended reading:
- How to Analyze Your Facebook Metrics To Improve Your Marketing
- Improve Your Content Strategy With Facebook Analytics
Use data to improve your Twitter headlines
On Twitter, the headline you tweet out with your article can have huge impact. Buffer has test Twitter headlines recommends this process:
- Come up with two headlines for an article that you’re about to send out.
- Tweet both of them out at roughly the same time (i.e. both in the AM or PM) but at least one hour apart.
- Compare the data and choose the winner.
First tweet:
Second tweet:
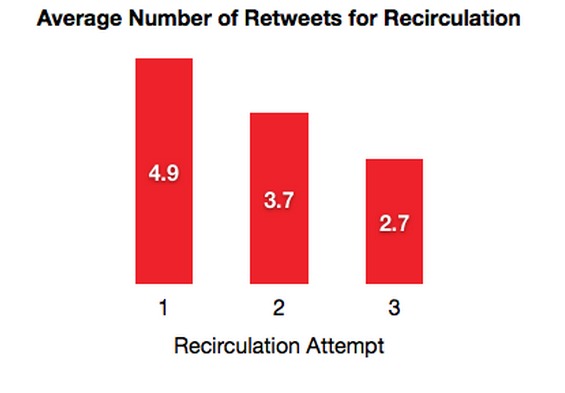
The second tweet got much more engagement, so they recycled it later. (Sharing tweets more than once typically leads to better performance the second time around.)
Twitter has a pretty robust (free) dashboard that tells you all about your top-performing tweets:
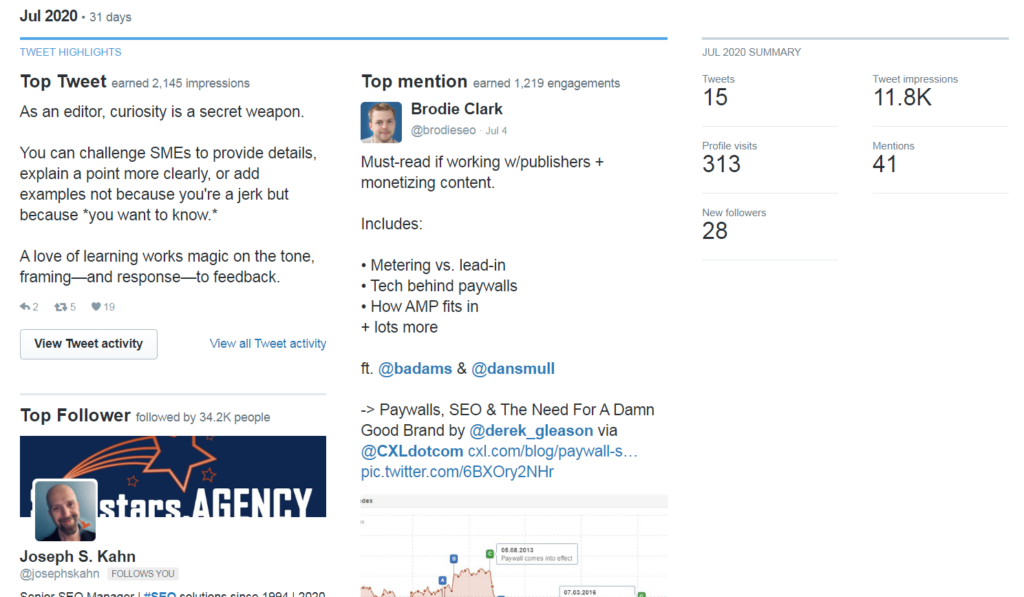
If you want to take Twitter Analytics a step further—and you have Twitter Cards installed—you can check out the Card Analytics data, which shows the relationship between impressions and clicks, changes over time, etc.
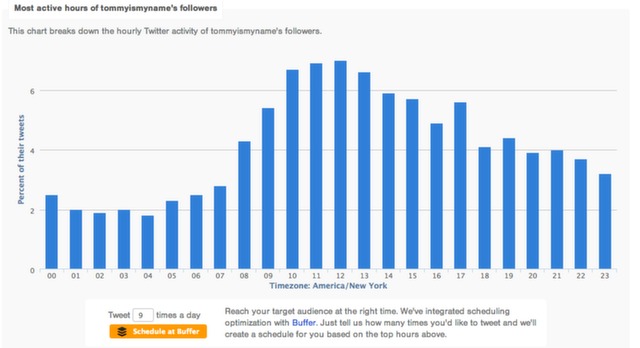
Beyond improving headlines and images on Twitter, it’s vital to distribute content when followers are most likely to see it.
This is where my favorite tool, Followerwonk, comes in. Using the time of day report, I can easily see when most of my followers (or other influencers) are online.
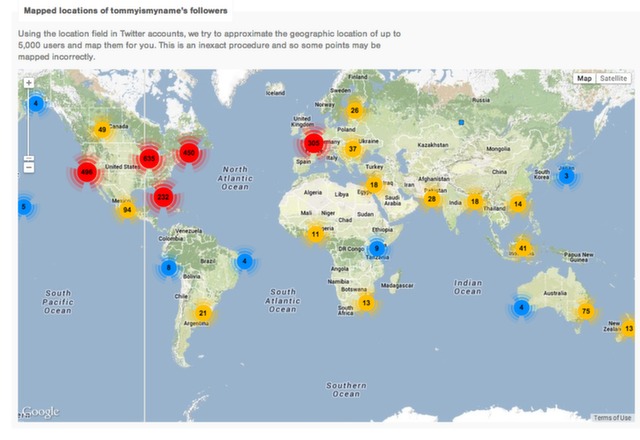
I’m also able to see roughly where in the world my followers tweet from:
Search Twitter bios for targeted keywords, locations, and min–max followers:
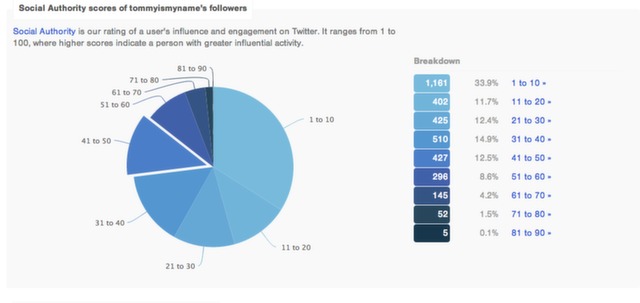
As well as segment mine—or anyone else’s—followers by social authority.
Build a solid network of relevant tweeters with similar audiences to help distribute and amplify your message.
I organize who I follow into Twitter Lists, then use TweetDeck to keep track of each list in real time.
Using this basic technique, I’ve built specific lists for newsletters I’d like CXL to be featured in, relevant industry people, and a few other strategic goals.
That’s helped me share content with influencers when they’re talking about something relevant and similar.
The best acquisition is about getting the right message, in front of the right people, at the right time. These techniques on Twitter help you do that.
Recommended reading:
- Increase Your Website Traffic & Engagement With Twitter Cards
- 15 Ways To Increase The Clickthrough Rates On Your Tweets
Other social networks
It doesn’t make sense to go into all social networks’ analytics data, but realize you’ll learn a lot about your audience when you really pay attention to the analytics native to each platform.
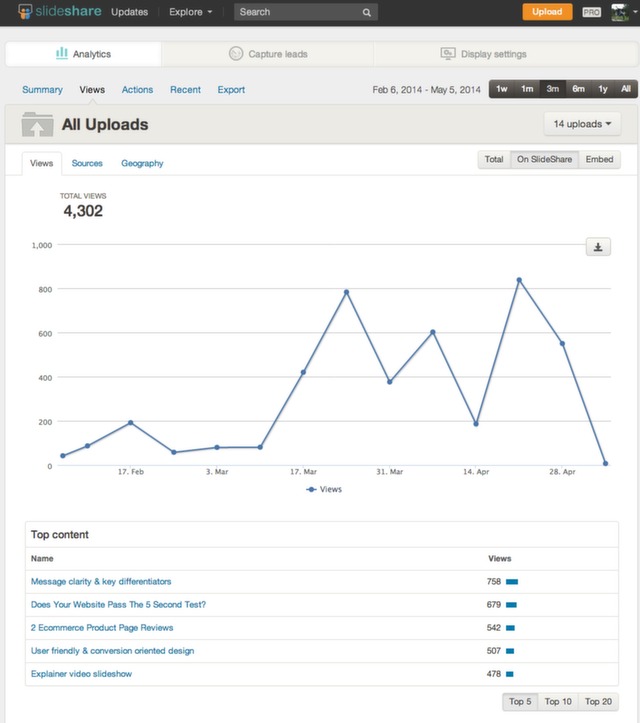
Our slideshare:
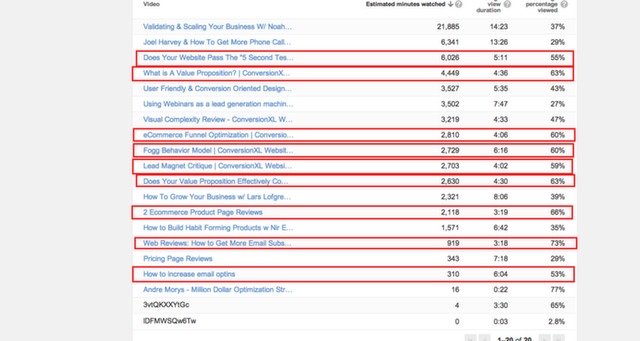
Our top-performing YouTube content:
What to look for in social data?
Analyze two things:
- How successful is that channel at driving high-quality traffic?
- What type of content performs best?
You’ll start to see patterns in the data. Getting social right is all about experimentation. Look at the data. Learn. Double down on what works.
Recommended reading:
- Gary Vaynerchuk Reveals Content Marketing’s ‘Massive Mistake’
- 10 Surprising Social Media Statistics That Will Make You Rethink Your Social Strategies
- Jab, Jab, Jab Right Hook: How To Tell Your Story In a Noisy Social World
- Using Google Analytics on Tumblr
- A Scientific Guide to Writing Great Headlines on Twitter, Facebook, and Your Blog
Re-optimizing for search traffic
Re-optimizing title tags and meta descriptions to be more “click worthy” on a busy search results page can have massive results on your bottom line, as can things like rich snippets.
Use Google Search Console to find high-impression, low-CTR queries
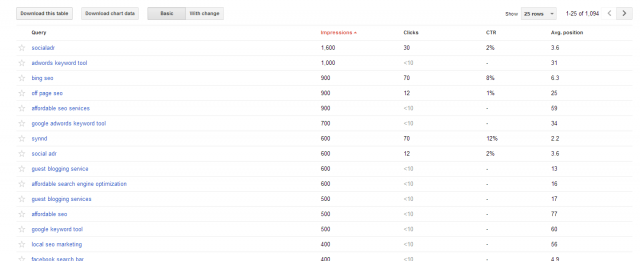
After navigating on the left hand side Search Traffic -> Search Queries section, you will see the average Impressions, Clicks, CTR, and Position for all of the keywords you appear in search for.
Have the data, time to optimize
What you need to pay attention to are Impressions, Clicks and CTR and in addition to that look at GA for things like bounce rate and time on site for the pages that correspond to those specific keywords.
High number of impressions and a solid CTR rate?
So far so good. Move into Google Analytics for that specific keyword. Low bounce rate, high time on site? Everything’s good here, move on to the next one.
What if I have high bounce rate (relative to the goal of the page) but impressions and clicks are decent? If they don’t bother spending time on the page, how can we expect them to convert further down the funnel?
Most like what people are looking for and what you’re offering do not match.
In this case you have four options:
- You can try tweaking the Title and the Title Meta tags. OR build more links to the page to increase rankings.
- OR go after a different keyword;
- OR rewrite the content itself.
Before I determine which tactic will likely perform best, I have to do more research.
It could be disastrous if you just went and re-wrote all of your title tags without knowing the overall effect it might have.
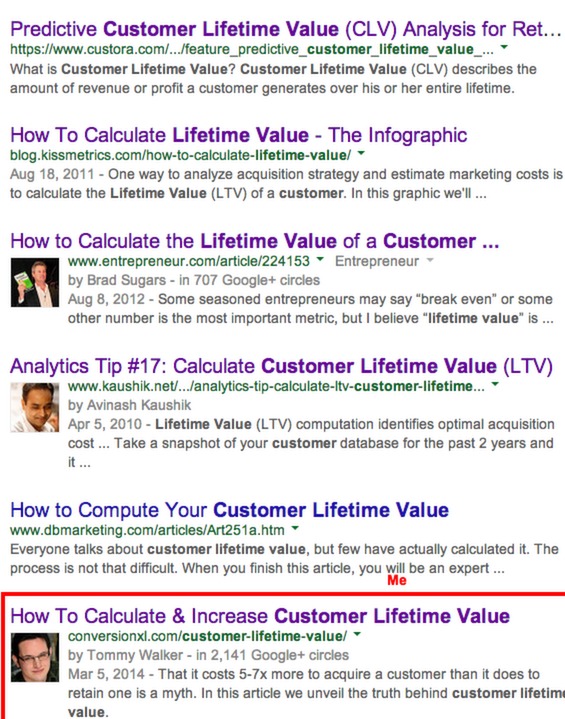
In an ideal world, I’d want to start with the tactic that takes the least amount of effort, I’ll check the Search Results Page (Serp) for Customer Lifetime Value & see there’s already a ton of content around “calculating” customer lifetime value.
If I’m going to rewrite this title tag, the idea would be try to use language that speaks more closely to the user’s search intent.
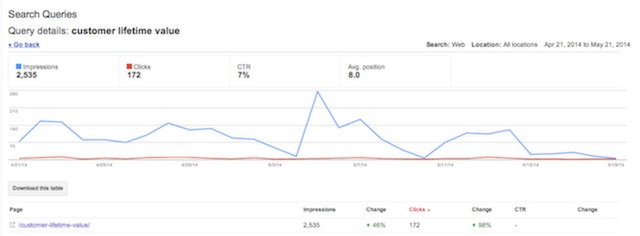
Digging into the webmaster data again, I see how else visitors are arriving to this content.
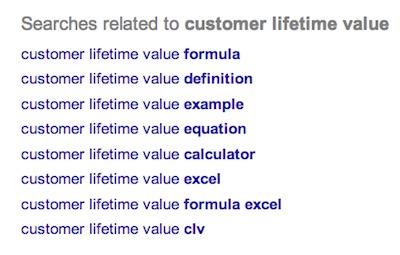
This along with the related searches at the bottom of the main Customer Lifetime Value search indicate that moving away from “calculating” language might not be the best idea.
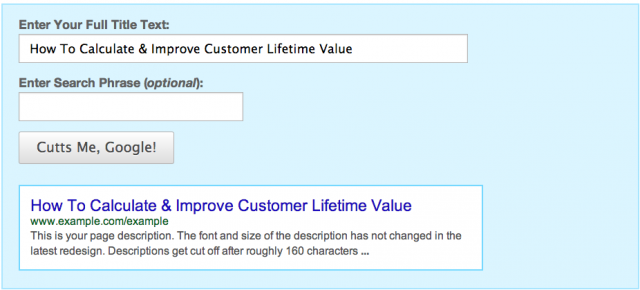
Though, I might test something more compelling like “How to Calculate & Improve Customer Lifetime Value” & play with the meta description to be more clickable. Rewriting the meta descriptions to include calls to action was one of the things Redstar did to bring 200% growth for a client.
(Note: Due to some visual changes Google’s been testing, I’d use Moz’s Title Tag Preview Tool for proper formatting)
Considering that rewriting titles probably won’t better match user intent, my next option is to increase the number of links that point to this particular url in hopes that it might increase the page’s ranking.
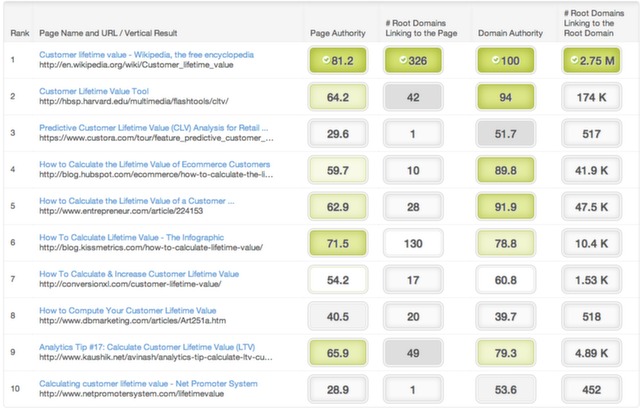
To understand what my competition looks like, I use Moz’s keyword difficulty tool to get an overview of how my “competitors” in this search stack up in terms of backlinks & overall domain authority.
Looking at this analysis, it’s not too difficult to understand why Wikipedia or Harvard Business School take up the top 2 spots.
In the number 3 spot is Custora, which if we’re measuring by backlinks, makes no sense, however because most of their content is customer centric Google might place it higher due to their domain expertise. After that, there’s a fairly standard correlation between domain/page authority and ranking position.
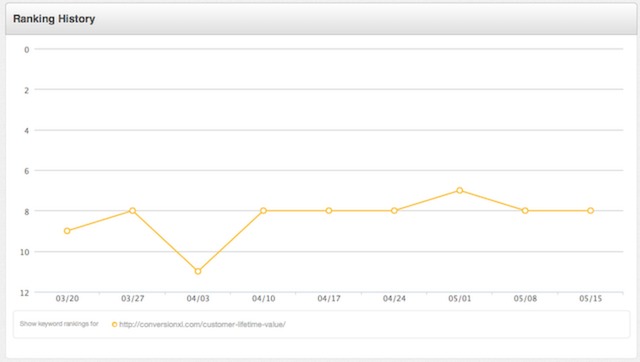
Hubspot, Entrepreneur, and CXL all write on a variety of topics related to business & online marketing & these positions likely fluctuate pretty regularly. In fact my rank tracking data confirms that.
I suspect if I were to build more links to the customer lifetime value article, and perhaps make it a little more “beginner friendly” (due to low Time on Site and high bounce data) this page, in time, would edge it’s way up in the ranking closer to the #3 or #4 position.
This shouldn’t be too difficult considering the relationships I’m building with the Twitter techniques from earlier.
Adding rich snippets to improve visibility in crowded SERPS
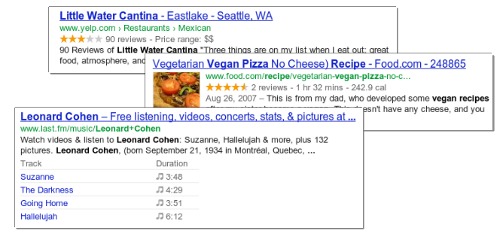
In addition to Title and Meta tags that you see on the SERP, there are also other visual extras like images, authors, video, events, products etc – all these are collectively called rich snippets.
Rich snippets provide extra credibility and typically increase CTR—up to 30% more —by including extra “bits” of information in the search result page.
Implementing rich snippets
Google itself suggests using Microdata BUT it accepts all three kinds of structured data.The 3 supported markup formats are:
To help you with the implementation, Google has made an Structured Data Markup Helper.
In addition to author photos & reviews, Google also recognizes markup for video content. Read all about it here. To make sure everything is setup the right way and it actually works, you can use the structured data testing tool from Google.
I’m not going to lie, implementing structured data is a lot to wrap your head around at first, but the team at Moz has put together a graphical guide into the world of microdata and rich snippets that should prove useful—check it out here.
CXL uses Yoast SEO & Video SEO to make getting video thumbnails into the search results much easier. We will also be experimenting with using new video thumbnails to test the impact on average CTR on video content.
A quick word of warning: Google has started cracking down on rich snippet spam, and doesn’t guarantee that every ranking will include rich snippet data. However, if implemented in a useful way, it can help you to improve the clicks that come from organic traffic.
Recommended reading:
Conclusion
In this article, we’ve just barely scratched the surface of what’s possible when you use data to guide your acquisition strategies.
If you’ve just been throwing stuff at your Facebook wall or Twitter stream, or if you’ve been blindly publishing articles hoping that traffic will come from the search engines, stop.
Take a step back, analyze your data, and see where you can improve.
Because if you can’t get people to visit you in the first place, how are they ever going to buy from you?
Big thanks to our new staff writer Ott Niggulis for the help on this article.



















Amazing article! practically a manual for growth hacking :)
I like how you suggested the use of feedback to understand better your users with surveys and polls.
This is exactly what we do: http://www.pick1.com :) check it out.
We are also SurveyMonkey partners. We enrich survey respondents data, big data for opinions and retargeting.
Happy to know your blunt thoughts on our product and how to be better!
thanks!
Awesome article !
The “user intent” part was very beneficial to me as i’m getting started with Ads. It will help me develop better ads and landing pages that speaks to where customers are at in the buying cycle.
Make your days great
Yassin
Wow, this is amazing. Can’t wait to see what’s next in the series. Thanks for posting this.
Thanks Becky!
I’m glad you enjoyed it :-D