Mediocre marketing teams guess: “Our latest run of Facebook ads seems to be working.”
Good teams know: “The Facebook ad set drives first visits, but the retargeting campaign and the nurture emails are what close the sale.”
Marketing attribution is how you get from the first sentence to the second. Attribution models are the rules that decide which touchpoint gets credit, and the model you pick changes the answer. Pick the wrong one and you will defund the channel that actually fills your pipeline.
This guide covers what marketing attribution is, why it got harder, every common attribution model (with a side-by-side comparison), data-driven attribution, when to use which model, and how marketing mix modeling, incrementality tests, and self-reported attribution fill the gaps that click tracking can’t.
Table of contents
- What is marketing attribution?
- Why marketing attribution is harder than it used to be
- Single-touch attribution models
- Multi-touch attribution models
- Attribution models compared
- Data-driven attribution
- How to choose the right attribution model
- Marketing mix modeling and incrementality testing
- Self-reported attribution
- How to implement marketing attribution
- Common marketing attribution mistakes
- FAQ
- Conclusion
What is marketing attribution?
Marketing attribution is the practice of figuring out which marketing touchpoints contributed to a conversion, and how much. A touchpoint is any interaction a buyer has with you: an ad, a search result, a blog post, an email, a webinar, a sales call.
An attribution model is the set of rules that assigns conversion credit to those touchpoints. It answers the question “which channel or campaign generated this lead, opportunity, or sale?”
Attribution data is what backs statements like:
- Google Ads is our biggest revenue driver.
- This email nurture campaign doesn’t move anyone and needs rebuilding.
- Most of our customers discover us through organic content.
Why it matters: say you have to grow pipeline 25% next quarter. Without attribution data, the obvious move is to pull budget from content and pour it into paid search, because paid search shows up as the last click before demo requests. With attribution data, you might see that organic content is the most common first touch in your buyers’ journeys. Cut it, and paid search dries up a few months later because nobody is searching for you anymore.
In the old days attribution was simple. A customer walked into your store holding a newspaper clipping, and you credited the newspaper ad. Today it looks like this:
Why marketing attribution is harder than it used to be
Attribution models assume you can see the journey. Increasingly, you can’t. Five forces are eroding that visibility.
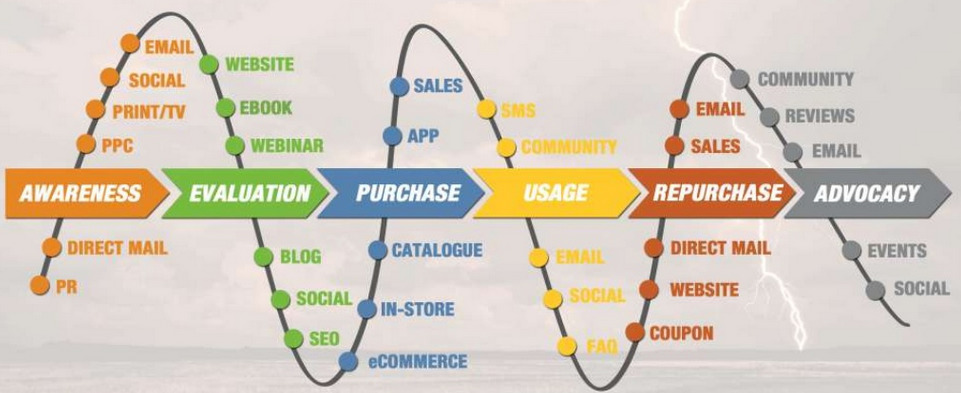
Journeys are long and non-linear
Buyers bounce between social media, search, review sites, email, and sales conversations, often over weeks or months. Here’s a customer journey map from digital sales consultancy Columbia Road with 10 touchpoints on the way to a decision:
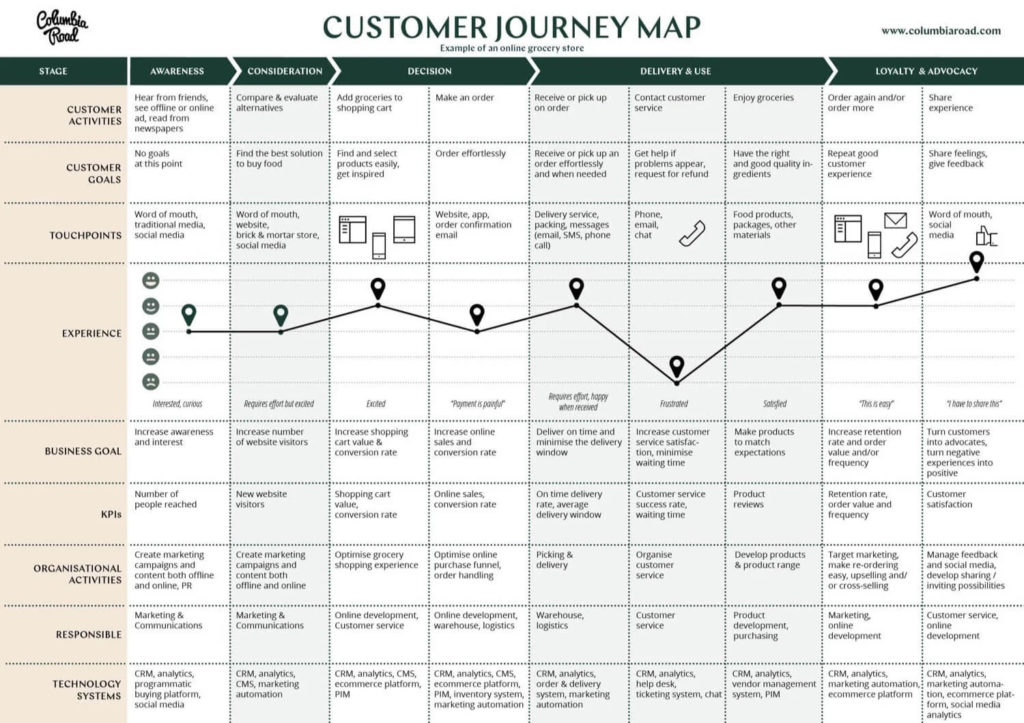
In B2B, multiply that by a buying committee. The person who reads your blog is rarely the person who fills in the demo form, and neither of them signs the contract. Linear funnels are a simplification at best.
Privacy rules and consent
Consent requirements under laws like GDPR mean a share of your visitors never get tracked at all. Apple’s App Tracking Transparency (introduced with iOS 14.5 in 2021) made cross-app tracking opt-in, which gutted a lot of mobile ad attribution. Analytics and ad platforms now fill the gaps with modeled conversions, which are estimates, not observations.
Cookie restrictions
Safari and Firefox block third-party tracking cookies by default, and Safari’s Intelligent Tracking Prevention also shortens the lifespan of many first-party cookies set by scripts. Google backed away from removing third-party cookies in Chrome, but that doesn’t help with the large share of traffic on other browsers. The practical effect: a returning visitor often looks like a brand-new one, so long journeys get chopped into disconnected fragments and the “first touch” you see is often not the real first touch.
Dark social and the dark funnel
A prospect sees your CEO’s LinkedIn post, hears you mentioned on a podcast, and gets a Slack message from a peer saying “we use these guys.” None of it is clickable or trackable. When that prospect finally types your URL, your analytics records “direct.” This is the dark funnel, and for many B2B companies it’s where most demand is created. If you want to build that demand on purpose, see our guide to the demand generation funnel.
AI search and zero-click research
Buyers now ask ChatGPT, Perplexity, Gemini, or Google’s AI Overviews to explain a problem and shortlist vendors. Much of that research never produces a click. When it does, it may arrive with an AI referrer or UTM tag, or it may land as direct traffic or a branded search days later. Either way, the touchpoint that put you on the shortlist is invisible to click-based models, and branded search or direct gets the credit instead.
None of this makes attribution models useless. It means you should treat them as one input, add methods that don’t depend on tracking individual clicks, and stop expecting any single report to be “the truth.”
Single-touch attribution models
Single-touch models give 100% of the credit to one touchpoint. They’re crude, but they’re easy to understand and each answers one specific question well.
We’ll use this ecommerce journey as the running example:
- A customer clicks your Google Ad while searching for a product you sell.
- They add the product to their cart but don’t buy.
- You send a cart abandonment email, which they open but don’t click.
- They see a Facebook retargeting ad, click it, and buy.
Last-touch attribution
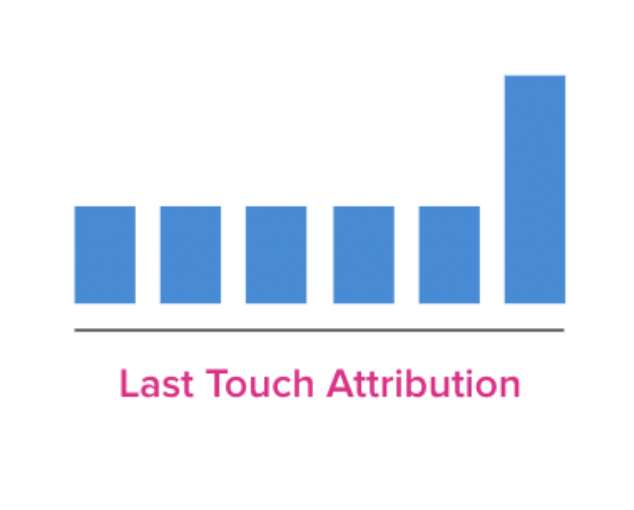
Last-touch (or last-click) attribution gives all the credit to the final interaction before conversion. In our example, the Facebook retargeting ad gets 100%.
It’s the default in many ad platforms and still the most widely used model, because it’s simple and it lines up with what platforms report. It is also badly biased toward bottom-of-funnel channels like retargeting and branded search, which harvest demand other channels created. As Avinash Kaushik put it, “The only use for last click attribution now is to get you fired. Avoid it.”
When it’s acceptable: short, impulsive buying cycles with few touchpoints, such as low-priced consumer goods. Wish, the marketplace known for oddball products bought on a whim from a Facebook ad, is a good example. Avoid it for long cycles, high-ticket purchases, or buying committees.
First-touch attribution
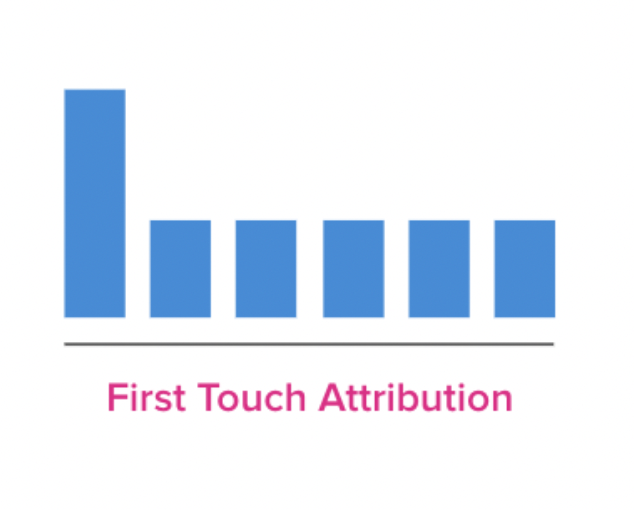
First-touch attribution is the mirror image: all credit goes to the first interaction. In our example, the original Google Ad gets 100%.
There’s logic to it (nothing else happens without the first touch), but buyers rarely convert because of one blog post or one ad. As Avinash wrote, “First click attribution is akin to giving my first girlfriend 100% of the credit for me marrying my wife.”
When it’s useful: as a lens on which channels bring new people in. If you’re a market newcomer or your main goal is reach, a first-touch view tells you where new audiences come from. Remember that cookie loss means the “first” touch you see is often not the real one.
Last non-direct click attribution
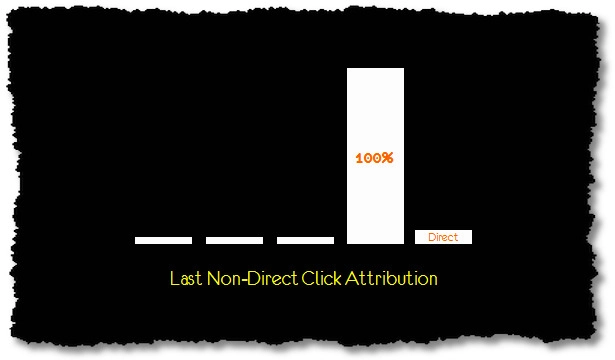
Last non-direct click works like last-touch but ignores direct visits. Change the end of our example: instead of clicking a retargeting ad, the customer types your URL and buys. Last-touch credits “direct.” Last non-direct click credits the cart abandonment email, the last marketing touch before the direct visit. Google Analytics’ “paid and organic last click” model works on the same principle.
When it’s useful: when customers convert quickly once they’re on your site, and you want to stop “direct” from swallowing credit. It still ignores everything except one touch, and as Avinash asked, “Why undervalue Direct? Why undervalue a marketer’s efforts to create brand recognition and brand value?”
Multi-touch attribution models
Multi-touch attribution (MTA) spreads credit across every tracked touchpoint. The models differ in how they split it.
Running example, a B2B buyer evaluating a project management tool like Asana:
- They see a YouTube ad and click through to the landing page, but don’t convert.
- Still thinking about the problem from the ad (managing freelancers), they Google “managing freelancers” and click the brand’s blog post because they recognize the name.
- Later, a LinkedIn ad offers an ebook, which they download.
- A nurture email sequence follows. The last email offers a free first month on an annual plan, and they sign up.

That’s six touchpoints: YouTube ad, landing page, organic content, LinkedIn ad, ebook, and email nurture. A single-touch model ignores five of them.
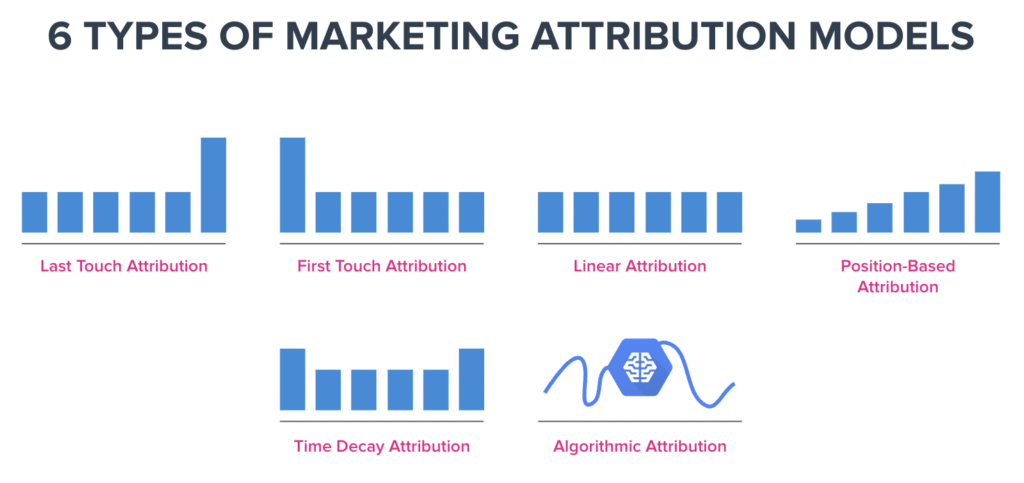
Linear attribution
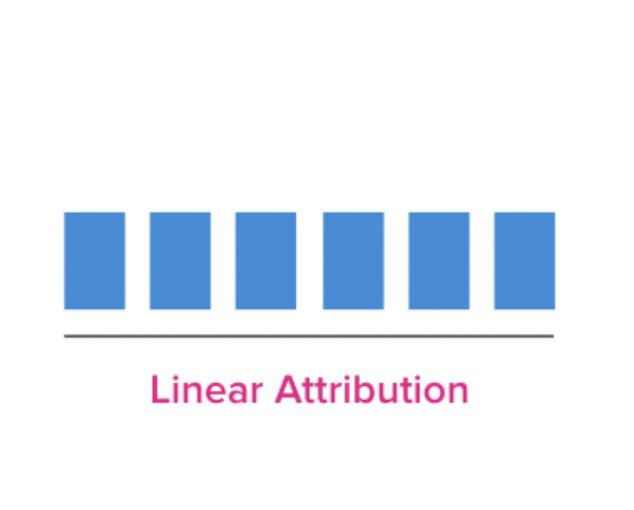
Linear attribution splits credit evenly. Each of the six touchpoints gets 16.67%.
Everyone gets a participation trophy, whether they earned it or not. A newsletter the buyer never opened gets the same credit as the influencer post that actually sold them. Linear is a reasonable step up from single-touch when you lack the data for anything smarter, but don’t split budget evenly just because the model splits credit evenly.
Position-based (U-shaped) attribution
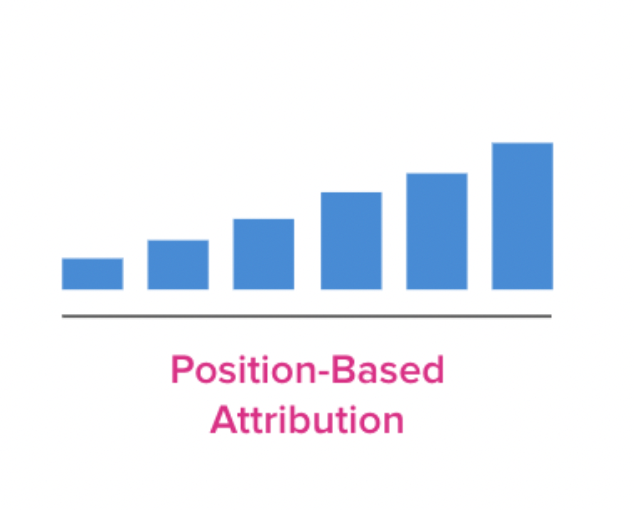
Position-based attribution gives most of the credit to the first and last touches and spreads the rest across the middle. The common split is 40% first, 40% last, 20% shared. In the Asana example:
- YouTube ad: 40%
- Landing page: 5%
- Organic content: 5%
- LinkedIn ad: 5%
- Ebook: 5%
- Email nurture: 40%
It recognizes the two moments that usually matter most (getting discovered and closing) while keeping the middle in view. It suits long sales cycles with many touchpoints. The weakness: why 40/20/40 and not 30/40/30? Nobody knows. The weights are a judgment call.
W-shaped attribution
W-shaped attribution is the B2B version of U-shaped. It adds a third anchor at lead creation (the form fill or ebook download that turns an anonymous visitor into a known contact). A common split gives 30% each to first touch, lead creation, and opportunity creation, and spreads the remaining 10% across everything else. Some teams add a fourth anchor at closed-won (sometimes called full-path or Z-shaped). These models usually live in your CRM or a B2B attribution tool, because web analytics doesn’t know when an opportunity was created.
Time-decay attribution
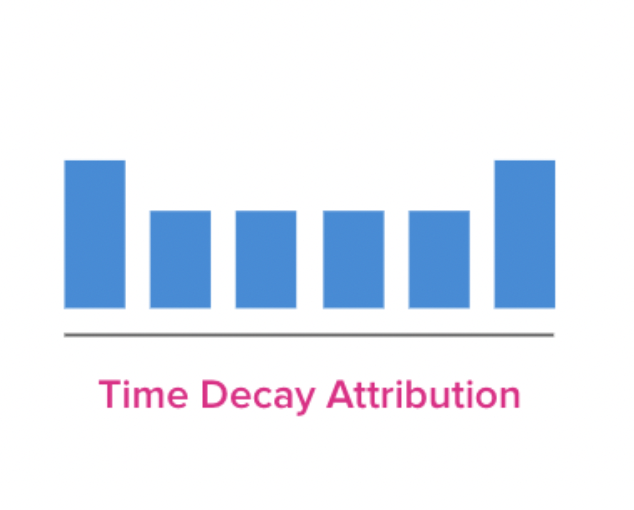
Time-decay attribution gives more credit to touches closer to the conversion. In the Asana example, it might look like this:
- YouTube ad: 5%
- Landing page: 7.5%
- Organic content: 12.5%
- LinkedIn ad: 20%
- Ebook: 25%
- Email nurture: 30%
It fits sales processes where late-stage relationship building does the heavy lifting, such as long B2B sales cycles. Its blind spot is the opposite of first-touch: it systematically undervalues the top-of-funnel work that introduced the buyer to you. If brand building matters to your growth, use position-based instead.
Attribution models compared
| Model | How credit is split | Best for | Main blind spot |
|---|---|---|---|
| Last-touch | 100% to the final touch | Short, impulsive purchases | Over-credits retargeting and branded search |
| First-touch | 100% to the first touch | Seeing which channels bring in new audiences | Ignores everything that closed the deal |
| Last non-direct click | 100% to the last non-direct touch | Quick on-site conversions where “direct” hides the source | Still one touch; undervalues brand |
| Linear | Equal share to every touch | Teams with little data who need a multi-touch baseline | Treats a skipped email like a deciding demo |
| Position-based (U-shaped) | 40% first, 40% last, 20% middle | Long cycles where discovery and close both matter | Arbitrary weights |
| W-shaped | 30% first touch, lead creation, opportunity creation; 10% rest | B2B with a CRM tracking lead and opportunity stages | Needs clean CRM data; weights still arbitrary |
| Time-decay | More credit the closer to conversion | Relationship-driven, late-stage-heavy sales | Undervalues top-of-funnel |
| Data-driven | Algorithm estimates each touch’s contribution | Accounts with enough conversion volume | Black box; only sees trackable touches |
Data-driven attribution
Every rule-based model above has the same flaw: a marketer decided the weights based on gut feel. Data-driven (algorithmic) attribution lets the data decide.

At a high level, data-driven attribution compares the paths of people who converted with the paths of people who didn’t. If journeys that include a webinar convert far more often than otherwise similar journeys without one, the webinar earns more credit. Two common techniques under the hood:
- Markov chains model the probability of moving from one touchpoint to the next, then measure each channel’s “removal effect”: how many conversions would be lost if that channel disappeared from the paths.
- Shapley values, from cooperative game theory, calculate each channel’s average marginal contribution across all the combinations it appears in.

Markov models have been praised in the attribution literature for objectivity (no gut feelings), predictive accuracy, robustness, interpretability, and versatility across datasets. A good data analyst can build one in R or Python on top of exported path data.
Bill Macaitis, former CMO of Slack, described the trade-off well:
“Today, algorithmic attribution has become the best practice for data-driven marketers and companies. […] It’s not perfect, and it’s not easy. It gets difficult with word of mouth referrals, dark social, and other ‘hidden touches.’ But, it drives a much deeper understanding of the buyer’s journey and which of your marketing efforts are paying off.”
Bill Macaitis, former CMO of Slack
Data-driven attribution in GA4
Data-driven attribution used to be locked behind enterprise tools. Now it’s the default in Google Analytics 4. GA4’s attribution reports offer three models: data-driven, paid and organic last click, and Google paid channels last click. According to Google, the first click, linear, time decay, and position-based models have not been available since November 2023. If you want those views, you’ll need a CRM, a dedicated attribution tool, or your own analysis on exported data.
Limits of data-driven attribution
- It only sees what’s tracked. The podcast, the peer referral, and the ChatGPT answer that shortlisted you still get zero credit. The algorithm is precise about a partial picture.
- It’s a black box. You get weights, not reasons, which makes it hard to challenge or explain to finance.
- It needs volume. Low-volume B2B accounts with a few dozen deals a quarter don’t give the model much to learn from.
- Platforms grade their own homework. Google Ads, Meta, and LinkedIn each run their own attribution, and each tends to credit itself. Add up platform-reported conversions and you’ll often get more than you actually sold.
- It’s still correlation. It finds touchpoints that appear in converting paths. It can’t prove the touchpoint caused the conversion. That’s what experiments are for.
How to choose the right attribution model
No attribution model is “correct.” The right one depends on your sales cycle, data volume, and the decision you’re trying to make. Use this as a starting point:
| Your situation | Primary model | Add |
|---|---|---|
| Ecommerce or low-ticket, buyers convert in days | Data-driven (GA4) or last non-direct click | Incrementality tests on retargeting and branded search |
| New brand, goal is reach and awareness | First-touch view alongside data-driven | Self-reported attribution, brand search trends |
| B2B, long cycle, buying committee | W-shaped or position-based in your CRM | Self-reported attribution, account-level reporting |
| High conversion volume, multiple paid channels | Data-driven | Marketing mix modeling and lift tests to calibrate |
| Significant offline, TV, or retail sales | Marketing mix modeling | Geo experiments, loyalty or CRM data to link offline sales |
Two rules of thumb:
Compare models, don’t crown one. Each model answers a different question. If Google Ads looks great under first-touch but weak under last-touch, it’s doing discovery, not closing. Doubling its budget will fill the top of the funnel without converting anyone faster. Read several views side by side and look for channels whose story changes between them.
Match the model to the decision. If new customer acquisition is the priority this quarter, weight your decisions toward what closes. If building awareness and top-of-funnel momentum matters more, weight toward what opens.
Marketing mix modeling and incrementality testing
Multi-touch attribution works bottom-up from individual user paths. As tracking erodes, more teams pair it with two methods that don’t depend on following individual users.
Marketing mix modeling (MMM)
MMM is a top-down statistical model. It looks at aggregate spend per channel over time (usually weekly) alongside outcomes like revenue or signups, controls for things like seasonality and promotions, and estimates how much each channel contributes and where returns start to diminish.
- Strengths: needs no cookies or user-level tracking, covers offline channels like TV, radio, and events, and answers budget questions (“what happens if we move 20% from search to YouTube?”).
- Weaknesses: needs a long history of spend and outcome data with enough variation, works at the channel level rather than the campaign level, and is slow to react.
- Tools: open-source options include Google’s Meridian and Meta’s Robyn. Some attribution platforms, such as Ruler Analytics, also offer MMM features.
Incrementality testing
Incrementality tests answer the question attribution models can’t: did this channel cause conversions that wouldn’t have happened anyway? You hold out a group (a region, an audience, or a time period), turn the channel off or on for that group only, and compare results. Common formats are geo holdout tests, platform conversion lift studies, and simple on/off “existence tests.”
Jim Novo, founder of The Drilling Down Project, made the case for existence testing on a Digital Analytics Podcast episode:

“If you think [display] is so valuable in terms of helping other campaigns, why don’t you just kill it for a week or two weeks and see what happens? And then add it back. Can’t you do that kind of testing? Is it worth it to you to invest that money elsewhere? How serious are you about figuring out the value of display?”
Jim Novo
Time-based cohorts help too. If the cohort that signed up in March, during a new campaign, converts from free to paid much better than the January cohort, that’s at least a correlational signal worth testing properly. Combine cohort analysis with controlled experiments for more confidence.
How the three fit together
- Multi-touch attribution for day-to-day optimization of campaigns, ads, and content.
- Marketing mix modeling for quarterly or annual budget allocation across channels.
- Incrementality tests to check and calibrate both, especially for channels you suspect are taking credit for sales that would have happened anyway.
Self-reported attribution
The cheapest attribution method is also one of the most revealing: ask people. Add a required open-text field to your demo or signup form that asks “How did you hear about us?” and have sales ask the same question on first calls.
Self-reported answers surface what software can’t see: “a podcast,” “my colleague sent me your LinkedIn post,” “ChatGPT recommended you.” Tag the responses in your CRM by theme (podcast, peer referral, LinkedIn, AI assistant, event) and track them over time. When software attribution says “direct” and buyers say “podcast,” believe the buyers, then investigate.
Use open text rather than a dropdown. Dropdowns anchor people to your channel list and invite them to pick the first plausible option.
Post-purchase surveys can also correct for in-market bias. Take this Shopify ad on Facebook:

If it targets people who engage with ecommerce communities, many of them may have already decided on Shopify before the ad appeared. The ad gets the click and the credit, but it didn’t change the decision. Go beyond “How did you hear about us?” and ask “What made you decide to buy from us?” You can even reference the touchpoint: “Before signing up, you clicked this Facebook ad. How much did it influence your decision?” on a 1 to 5 scale.
Self-reported data has its own biases (people remember the most recent or most memorable touch), so treat it as one stream alongside software attribution. Our three-pillar framework for B2B marketing attribution shows how to combine channel influence, self-reported, and software attribution into one view.
How to implement marketing attribution
1. Define the conversion and the question
Decide what you’re attributing. For B2B, that should be pipeline and revenue, not form fills. Then write down the decision the data needs to support, such as “Should we shift budget from paid search to LinkedIn?” Attribution without a decision attached becomes a reporting hobby.
2. Fix tracking hygiene
- Create a UTM naming convention and enforce it on every campaign link.
- Set up conversion events properly in GA4 and your ad platforms, and deduplicate them.
- Implement consent handling correctly, and consider server-side tagging to reduce data loss from browser restrictions.
- Use vanity URLs or unique codes for offline channels like print, events, and direct mail.
3. Connect attribution to revenue
Pass source data into your CRM so touchpoints connect to deals and revenue, not just conversions. Tools like Ruler Analytics do this by pulling CRM revenue back into the attribution model.
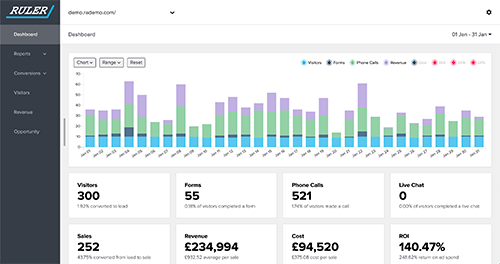
Here’s why it matters. Imagine two conversion paths. Path one carries 70% of customers, each worth $4,500 a year. Path two carries 30%, including every enterprise client, each worth far more. Optimize for conversion volume and you’d invest in path one. Optimize for revenue and you’d do the opposite.
4. Add a self-reported field
Add “How did you hear about us?” as a required open-text field on high-intent forms, and store the answers in the CRM next to the software-reported source.
5. Pick a primary model and a comparison view
Use the table above to choose a primary model for reporting, and keep at least one contrasting view (for example, data-driven plus a first-touch view from your CRM). Agree on the model with sales and finance before you present numbers, not after.
6. Account for offline touchpoints
If buyers research online and buy offline (or the reverse, “showrooming”), digital-only models miss part of the journey. Loyalty programs that customers activate online can link in-store purchases to digital profiles. Some brands deliberately lead customers offline in a trackable way. Furniture maker VOX lets customers design a room in its VOXBOX app, then books them into an in-store consultation, so the online and offline touches stay connected.

7. Validate with experiments, then act
Pick the one or two channels where a wrong answer would cost you the most and run an incrementality test. Then turn findings into changes: budget shifts, rebuilt nurture sequences, more realistic customer journey maps. Review the setup every quarter, because your channel mix and tracking environment will keep changing.
Attribution tools to consider
- Google Analytics 4: free, data-driven attribution by default, good baseline for web conversions across paid, organic, referral, social, and email.
- Ruler Analytics: connects attribution to CRM revenue, so you can see which touchpoints drive revenue rather than conversions.
- Oktopost: a B2B social media management platform with analytics on how social activity contributes to engagement and conversion.
- AppsFlyer: attribution for mobile apps, from ad engagement to install to in-app conversion.
- Your CRM: for B2B, often the most important attribution tool, because it’s the only place that knows about opportunities, deal size, and buying committees.
Common marketing attribution mistakes
- Treating last-click as the truth. It systematically rewards the channels that harvest demand and starves the ones that create it.
- Adding up platform-reported conversions. Each ad platform claims credit for the same sale. Reconcile against your own analytics and CRM.
- Choosing weights by gut feel and forgetting you did. A 40/20/40 split is a hypothesis, not a finding. Revisit it as data comes in.
- Attributing leads instead of revenue. Channels that produce cheap form fills often produce expensive pipeline.
- Ignoring in-market bias. Targeting people who were already going to buy makes a channel look brilliant. Test incrementality before scaling it.
- Blaming the channel when the message is the problem. If LinkedIn underperforms, your buyers may be there and your message may simply not land. Before cutting a channel, test a message that works elsewhere (say, your best-performing Google Ads copy) and see if credit shifts.
- Cutting what you can’t measure. Podcasts, community, and founder-led content often show up only in self-reported data. Zero attributed revenue is not the same as zero impact.
- Waiting for perfect data. You’ll never get it. Directionally right and acted on beats precisely wrong and ignored.
FAQ
What is a marketing attribution model?
A marketing attribution model is a set of rules (or an algorithm) that decides how much credit each marketing touchpoint gets for a conversion. Examples include last-touch, first-touch, linear, position-based, W-shaped, time-decay, and data-driven attribution.
What is the best attribution model?
There isn’t one. Data-driven attribution is the best default when you have enough conversion volume. For B2B with long sales cycles, a W-shaped or position-based model in your CRM, plus self-reported attribution, usually tells you more. For budget allocation across channels, marketing mix modeling is better suited than any click-based model.
What is the difference between single-touch and multi-touch attribution?
Single-touch attribution gives 100% of the credit to one touchpoint (usually the first or last). Multi-touch attribution splits credit across every tracked touchpoint in the journey, using fixed rules or an algorithm.
Which attribution models does GA4 support?
GA4 offers data-driven attribution (the default), paid and organic last click, and Google paid channels last click. First click, linear, time decay, and position-based were removed in November 2023.
Is marketing mix modeling better than multi-touch attribution?
They answer different questions. Multi-touch attribution is granular and fast, good for optimizing campaigns, but depends on user-level tracking. MMM is privacy-proof and covers offline channels, good for allocating budget, but it’s slower and less granular. Mature teams use both and calibrate them with incrementality tests.
How do you attribute conversions from AI search and dark social?
Mostly, you can’t with click tracking alone. Track AI referrers where they exist, watch branded search and direct traffic trends, and rely on self-reported attribution (“How did you hear about us?”) to capture podcasts, peer recommendations, LinkedIn posts, and AI assistant mentions.
Conclusion
Attribution models are lenses, not verdicts. Last-touch shows what closes, first-touch shows what opens, data-driven attribution estimates the in-between, and none of them see the conversations, podcasts, and AI answers where much of today’s buying actually starts.
So build a system, not a single report: clean tracking tied to revenue, a primary model plus a comparison view, a “How did you hear about us?” field, and experiments on the channels where being wrong is expensive. Then use it to make decisions.
Want to go deeper? CXL’s attribution course walks through building and validating attribution models in practice.
Related Posts
-

If I were to tell you - what would you do with that information? Honestly,…
-

What's a good conversion rate? A conversion rate that's better than the one you currently…
-

Somebody asked me the other day, what are all the possible ways to increase the…
-

The success of an online business is measured by various indicators. The data required comes…