LinkedIn reach is declining for most B2B marketers, with median impressions down 13% between Q4 2024 and Q1 2025. But the top 1% of posts are breaking records.
The gap isn’t about effort or posting frequency. It’s about understanding what the algorithm actually rewards now versus what worked three years ago.
Tactics like text-heavy posts, hashtag stuffing, and random scheduling, that worked in 2023, don’t just underperform anymore. They actively hurt your reach. LinkedIn’s algorithm now heavily favors specific content types while penalizing others.
Here’s what an analysis of over 100,000 LinkedIn posts reveals, along with the tactics you can leverage to get significant results.
Table of contents
- 13 LinkedIn tactics that actually work
- 1. Use carousel posts for 11x more impressions
- 2. Create infographics for 5x higher engagement
- 3. Switch to vertical video format
- 4. Optimize your post length
- 5. Craft better opening hooks
- 6. Comment with purpose and length
- 7. Post when your audience is online
- 8. Stop overusing hashtags
- 9. Follow the 40-30-20 content mix
- 10. Track what actually matters
- 11. Post consistently
- 12. Design everything for mobile
- 13. Add useful links
- What’s changed on LinkedIn (Q3 2025 → Now)
- How to create addictive LinkedIn posts
- Before you hit publish
13 LinkedIn tactics that actually work
1. Use carousel posts for 11x more impressions
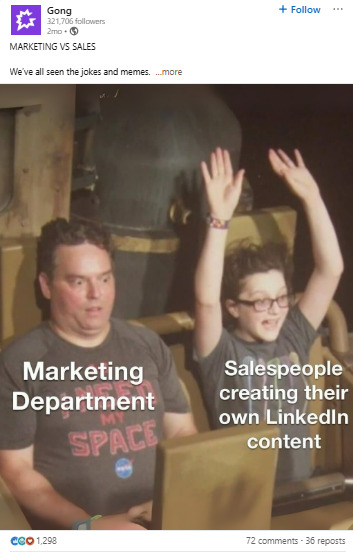
Carousel posts generate 11.2× more impressions than text-only updates. In a study of 1.3 million company posts, they remained the highest-engagement format. Gong.ai leverages various types of carousel posts, most of which are informational.
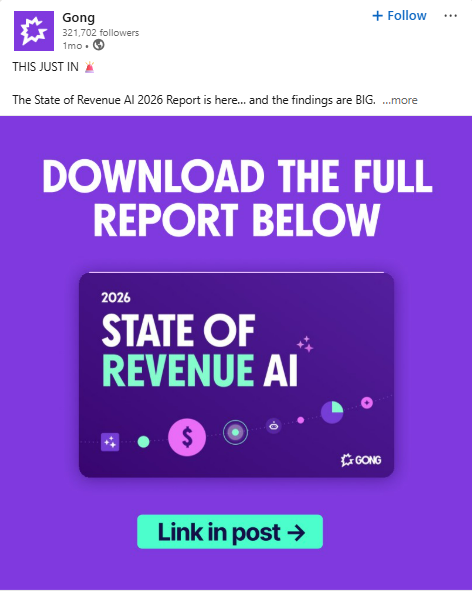
But these don’t have to be purely educational. In fact, Q3 2025 data reveal that storytelling is outperforming other formats. Gong used a series of GIFs to drive home the importance of sales and marketing alignment.
Do this: Create 5–8 slide carousels with a strong hook and clear, problem-solution flow.
| Carousel Performance | Engagement Rate | Impressions vs. Text | Comment Rate |
| 5–8 slides | 2.4% | 11.2× higher | 3.7× higher |
| 9–12 slides | 2.1% | 8.6× higher | 3.1× higher |
| 13+ slides | 1.7% | 5.3× higher | 2.2× higher |
Source: SayWhat “State of the Algorithm”, 2025
2. Create infographics for 5x higher engagement
Infographics deliver 5.4× more impressions than standard text posts. They’re highly savable and shareable, which boosts algorithmic reach. Hristo Butchvarov shares four effective design templates:
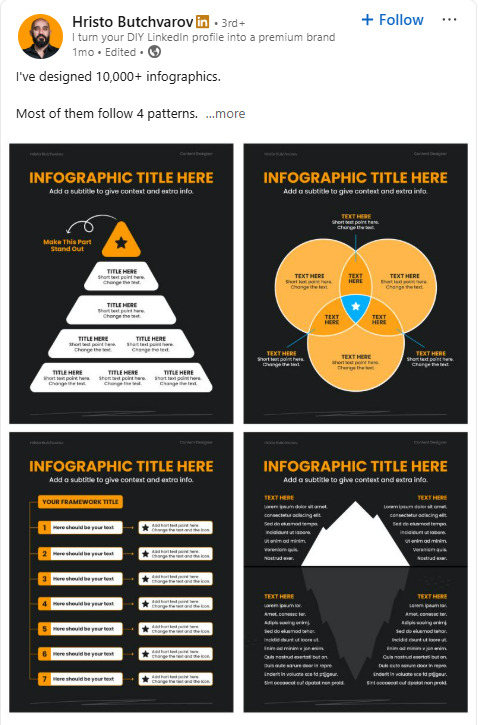
Do this: Use visual hierarchy and break complex topics into clean, actionable blocks.
3. Switch to vertical video format
Vertical videos generate 71% more impressions than horizontal ones. Over 57% of LinkedIn users engage via mobile, which makes mobile-first video essential. Adobe understands that its audience is visually-oriented, using video to showcase the creative capabilities of its software.
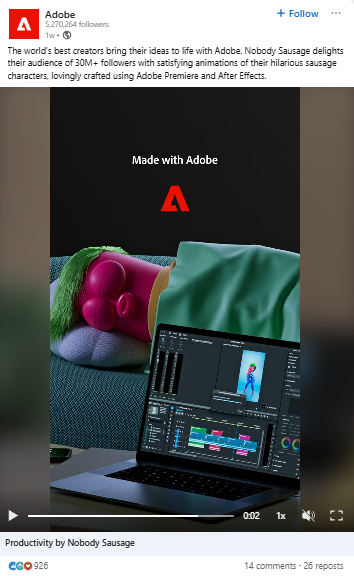
Do this: Use the 9:16 format, keep videos under 45 seconds, and include captions.
| Video Format | Impression Lift | Avg. View Duration | Completion Rate |
| Vertical | +71% | 17.3 seconds | 41% |
| Square | +22% | 12.8 seconds | 33% |
| Horizontal | Baseline | 9.2 seconds | 27% |
Source: LinkedIn Business Solutions, 2025
4. Optimize your post length
Posts between 1,242 and 2,500 characters (roughly 200–400 words) performed 32% better than longer or shorter content. However, new insights show that conversational posts with 1.3k-3k characters perform 38% better.
Do this: Use 14+ short paragraphs and keep the language simple.
| Post Length | Performance vs. Avg | CTR | Comment Rate |
| <800 characters | -17% | 1.1% | 0.8% |
| 800–1,241 | -3% | 1.7% | 1.2% |
| 1,242–2,500 | +32% | 2.3% | 2.1% |
| 2,501+ | -12% | 1.9% | 1.6% |
Source: SayWhat Analysis, 2025
5. Craft better opening hooks
Counter-intuitive hooks lift reach by 49%. In contrast, vague or generic openings reduce engagement. Justin Welsh is a master at engaging hooks, leaning primarily on storytelling, statistics, and contrarian formats.
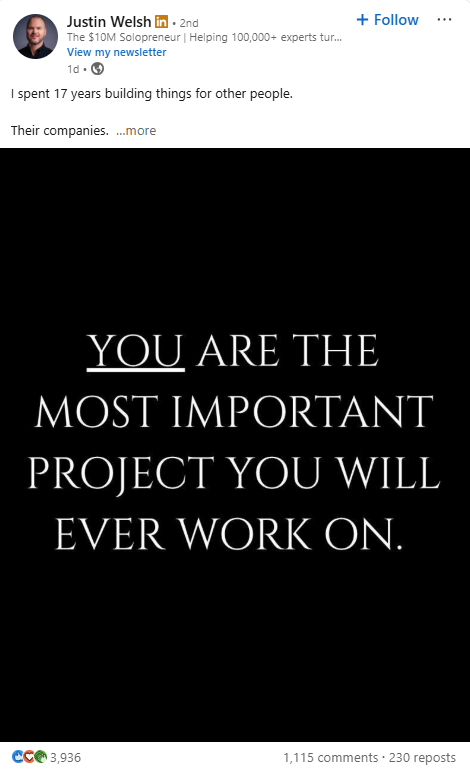
Do this: Start with bold, contrarian statements that challenge accepted beliefs.
| Hook Type | Performance vs. Avg | Scroll-Stop Rate | Engagement Rate |
| Contrarian statement | +49% | 6.2% | 3.1% |
| Surprising statistic | +37% | 5.4% | 2.7% |
| Personal story | +21% | 4.1% | 2.4% |
| Question | -11% | 2.7% | 1.8% |
| Generic statement | -23% | 1.9% | 1.3% |
Source: SayWhat LinkedIn Hook Analysis, 2025
Since posting, new data suggests that mediocre contrarian hooks have lost their novelty, while personal storytelling and authority hooks are making more of an impact.
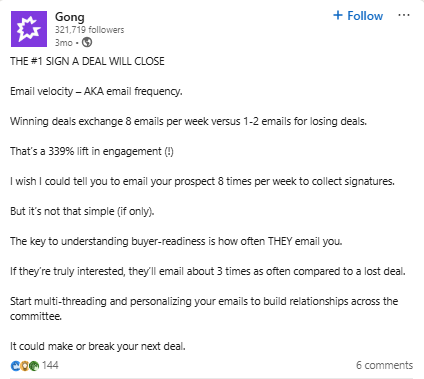
6. Comment with purpose and length
Comments longer than 9 words boost the parent post’s impressions by 3x. Creators who engage actively see stronger performance across their own content. Top 5% creators leave picture and personal story comments (+150 comments/week).
Do this: Leave 10–20 meaningful comments per day. Prioritize engagement over visibility.
| Comment Level | Reach Lift | New Connection Rate | Profile Views |
| Top 10% (20+/day) | +41% | +67% | +85% |
| Top 25% (10–19/day) | +29% | +43% | +58% |
| Middle 50% (3–9/day) | +11% | +19% | +27% |
| Bottom 25% (<3/day) | Baseline | Baseline | Baseline |
Source: The Creator Accelerator Study, 2025
7. Post when your audience is online
Weekend posts consistently outperform weekday content. Sunday is now the highest-performing day on LinkedIn.
Do this: Schedule posts for 4–5 AM GMT or 11 AM–1 PM GMT to maximize global reach.
| Day | Median Impressions | Engagement Rate |
| Sunday | 1,998 | 2.7% |
| Saturday | 1,836 | 2.5% |
| Wednesday | 1,475 | 1.9% |
| Tuesday | 1,123 | 1.4% |
Source: Postunreel, Q1 2025
8. Stop overusing hashtags
Using more than 3 hashtags results in a major drop in reach and engagement. Focus on searchable keywords instead.
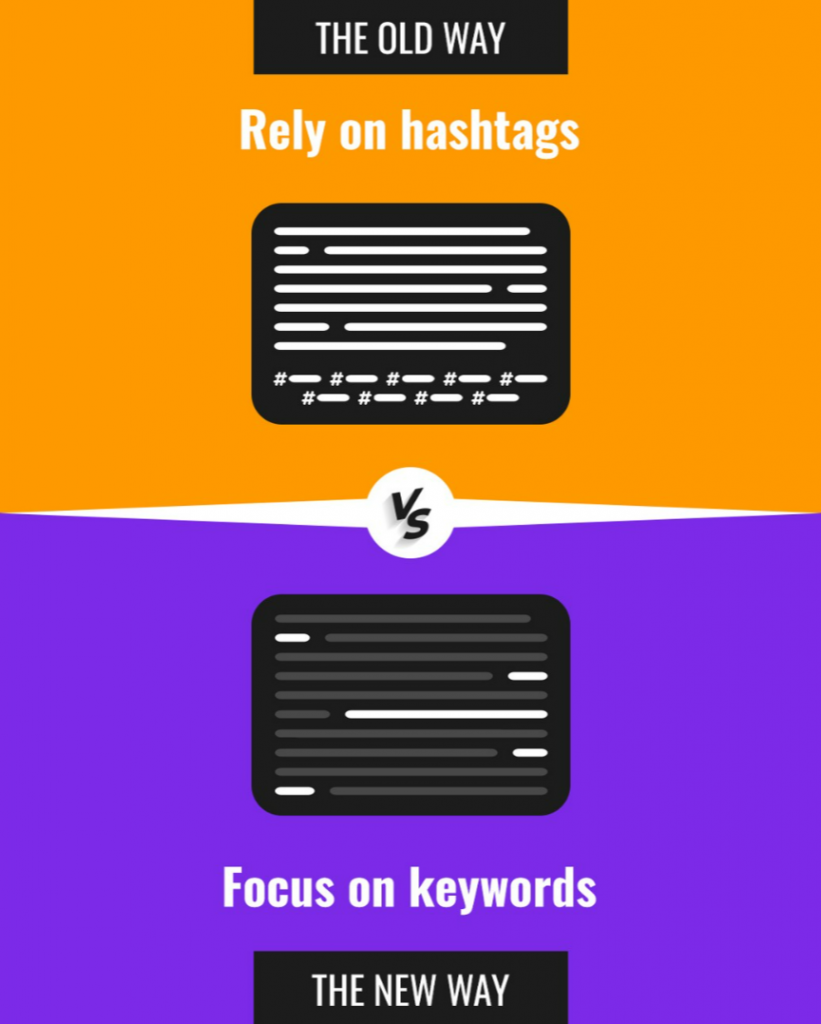
Do this: Limit hashtags to 1–2, and include keywords in the first two lines (ensure they’re visible before “See more”. Never rely on auto-generated tags from AI scheduling tools.
| Hashtag Count | Reach Impact | Comment Impact |
| 1–2 | +7% | +12% |
| 3 | +2% | +5% |
| 4–5 | -37% | -22% |
| 6+ | -81% | -64% |
Source: Creator Accelerator / LinkedIn Internal Data, 2025
9. Follow the 40-30-20 content mix
Top creators stick to this performance-driven ratio:
- 40% carousel posts
- 30% vertical video
- 20% text posts
Gong.io used a vertical video series + carousels to boost:
- Followers by 85%
- Comments by 6,893%
- Saves by 739%
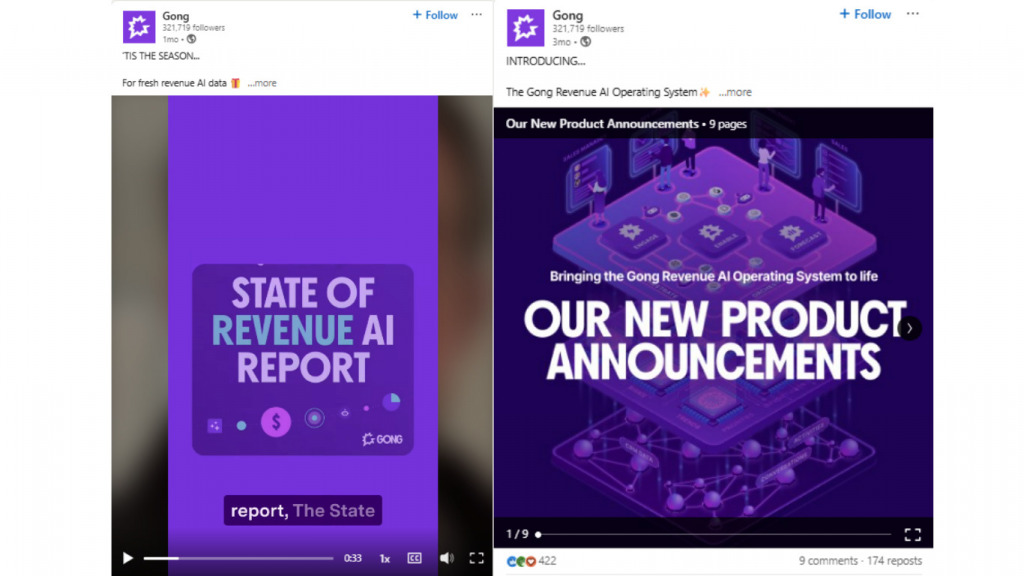
(Image Sources: Video, Carousel, Text )
Do this: Use carousels and videos to anchor your strategy, and save text for contextual support.
Source: LinkedIn Business Solutions Case Study, Q1 2025
10. Track what actually matters
Measuring performance is more than likes.
Do this: Focus on impressions per follower, save rate, shares, view-through on video, and comment-to-impression ratio.
| Metric | Top Performers |
| Save rate (carousels) | 7.5%+ |
| View-through rate (video) | 41%+ |
| Comment-to-impression | 1.4%+ |
Source: Rival IQ Benchmarks, 2025
11. Post consistently
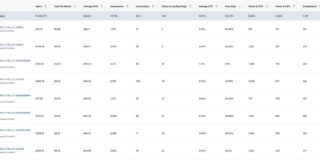
Analysis across 94,000+ LinkedIn accounts and 2 million+ posts shows:
- Posting 2–5 times/week tends to generate ~1,000 more impressions per post.
- Posting 6–10 times/week boosts that to ~5,000 extra impressions per post.
- Publishing 11+ posts/week can lift impressions by ~16,000+ per post versus inconsistent activity.
But your work doesn’t end after you hit publish. Hristo Butchvarov shares his posting routine:
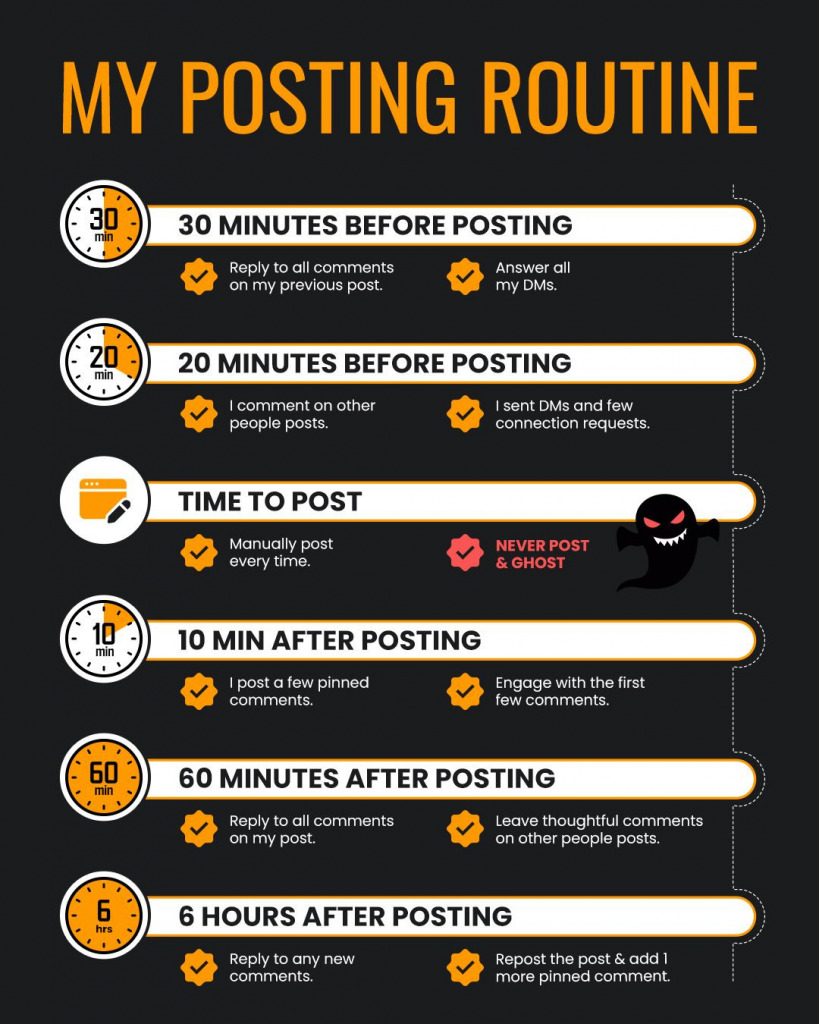
Do this: Launch a weekly branded content series and use slides for deep dives. Set up a routine that’s focused on engagement and is sustainable, even if that means reducing your posting frequency.
12. Design everything for mobile
Over 60% of LinkedIn traffic is mobile. Ensure your format is optimized for both mobile and desktop where possible.
Do this: Use the 9:16 format, high-contrast overlays, 40pt+ fonts, and progress bars.
| Mobile Design Feature | Engagement Uplift |
| 9:16 aspect ratio | +57% |
| Captioned video | +86% |
| High-contrast overlays | +31% |
Source: LinkedIn UX Research, 2025
13. Add useful links
LinkedIn has shifted its priorities from time on platform to content usefulness. Posts with 3+ useful links perform 236% better.
Do this: Include 1–3 high-quality links directly in the post body. Use them to support your point, expand on the idea, or provide tools and proof.
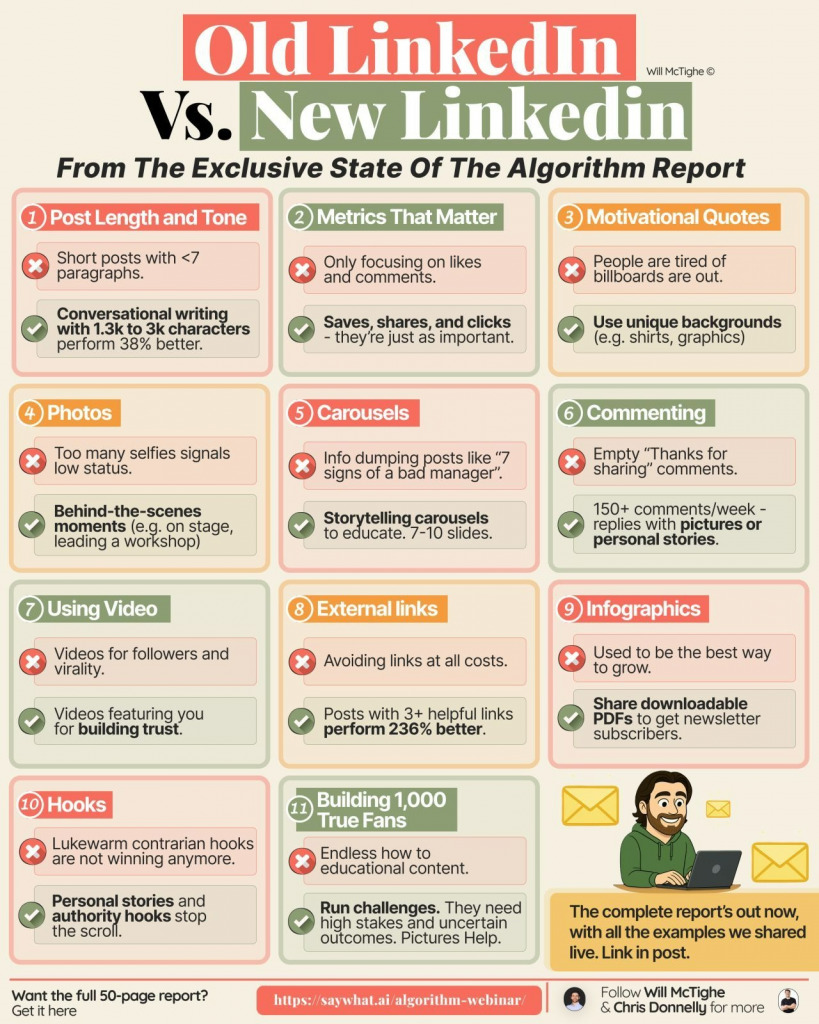
What’s changed on LinkedIn (Q3 2025 → Now)
Last quarter, The Creator Accelerator analyzed 318,842 LinkedIn posts to understand how the platform is evolving.
Organic reach is down ~65% from peak, and average creator follower growth dropped 20% since Q2 2025. At the same time, the top 1% of creators are growing 157× faster than everyone else.
That gap explains almost everything.
LinkedIn hasn’t stopped rewarding creators; it’s stopped rewarding volume. Growth now favors content that generates strong engagement signals, trust, and repeat attention.
Here’s what’s changed in practice:
- Carousels still work, but purely educational slide decks have plateaued. Story-driven carousels earn more saves and shares.
- Likes and comments matter less on their own. Saves, shares, clicks, and profile actions now carry more weight.
- Generic motivational quotes have faded. Quotes tied to real experience and brand context still perform.
- Contrarian hooks lost novelty. Personal stories and authority-led insights stop the scroll.
- Video shifted from viral to valuable. Trust-building, personality-driven videos outperform reach-chasing clips.
- Commenting is about quality, not volume. Top creators leave fewer, more meaningful comments, often with stories or visuals.
- Links aren’t penalized. Posts with 3+ helpful links performed 236% better when the links added real value.
The takeaway: the 2025 benchmarks still hold directionally, but the algorithm now rewards signal quality over activity level.
LinkedIn growth in 2026 may not be easier, but it’s certainly a lot clearer.
Test aggressively. Double down selectively.
How to create addictive LinkedIn posts
LinkedIn reach is dropping for everyone. But there are some small hacks to keep your content alive:
- Cut the fat: Remove anything that doesn’t earn its place. Clear copy signals confidence while confident posts get saved.
- Show a clear transformation: Don’t just share the result. Show the shift that got you there. People remember journeys, not conclusions.
- Optimize for the mobile scroll: Short sentences. Frequent line breaks. If it’s hard to scan on a phone, it’s dead on arrival.
- Start with the pain: Negative hooks create instant tension. Content connects faster when it names what people are already frustrated by.
- Go deeper on emotion: “Happy” is forgettable. “Relieved,” “frustrated,” or “thrilled” actually land. If you can feel it, it performs.
- Break the pattern with numbers: Unexpected numbers stop the scroll. 9, 13, or 17 feel more credible than a perfectly rounded 10.
- Make the reposter look smart: Create content people are proud to share. Useful, clean, and instantly understandable beats clever every time.
The goal isn’t to go viral, it’s to be memorable enough to earn a save, a share, or a repost. That’s what compounds reach now.
Before you hit publish
LinkedIn rewards strategic, scroll-stopping content and mobile-first formats. So, before you start posting, ask:
Does this post start with a bold hook, use a visual format, and spark action?
If not, it won’t survive the new feed.
For more practical LinkedIn tactics based on real-world, expert insights, explore CXL’s live and on-demand courses to help boost engagement and leads:
Improve ad efficiency with LinkedIn thought leader ads
Validate and scale your LinkedIn
Related Posts
-

By changing traditional B2B LinkedIn ads and making them more colorful and entertaining, Video Brothers…
-
B2B marketing has changed. Most marketers haven’t. Most B2B marketers still think in funnels. Buyers…
-
Marketing is flooded with empty talk about “more leads, more MQLs.” Most of it is…
-

Are you in B2B / lead gen? Qualifying leads a challenge? There's a new (non-enterprise)…