Google AI Overviews are rapidly becoming the first thing users see for informational queries. That citation layer is increasingly shaping perception before a user even looks at the organic results.
But most teams have no idea whether they’re showing up in these citations or not.
Your typical stack (Google Search Console, Semrush, Ahrefs) shows rankings and traffic, but it doesn’t show which brands appear in AI-generated answers that increasingly resolve searches without a click.
So we extended the workflow.
Over the past few weeks, we’ve been building a fully automated SEO workflow in n8n: extracting Google Search Console data, running competitive gap analysis, and now implementing the content improvements our agents recommended.
While we wait for those ranking shifts to materialize (SEO is still a patience game, no workflow changes that), we built a simple visibility tracker that tells us:
- Exactly where our brand gets cited in AI Overviews;
- Who owns the conversations we’re missing from; and
- Which topic clusters represent real authority gaps.
Here’s how we built it, what it costs, and what the results show.
Table of contents
Why most teams are flying blind on AI Overview visibility
Branded search volume. Share of voice. Impressions in GSC. These are all useful proxies for brand presence in traditional search, but none of them capture what’s happening in AI Overviews.
The mechanics are different.
AI Overviews synthesize answers from multiple sources and cite brands, tools, and frameworks by name inside the response itself.
A user asks, “What’s the best platform for B2B marketing education,” and Google’s AI might say, “CXL is frequently cited for advanced practitioner content”—or it might not mention you at all and cite three competitors instead.
That mention happens before any click decision. It shapes perception. It either builds or erodes authority, and there’s no native Google report for this.
SearchAPI.io gives you programmatic access to live SERPs, including AI Overview content, but stitching that into an actionable monitoring system requires some assembly.
Most specialized AI visibility tools charge $500–$2,000/month for this data. That’s fine if you have the budget. If you don’t, or if you want to understand the mechanics before committing, this workflow is a good starting point.
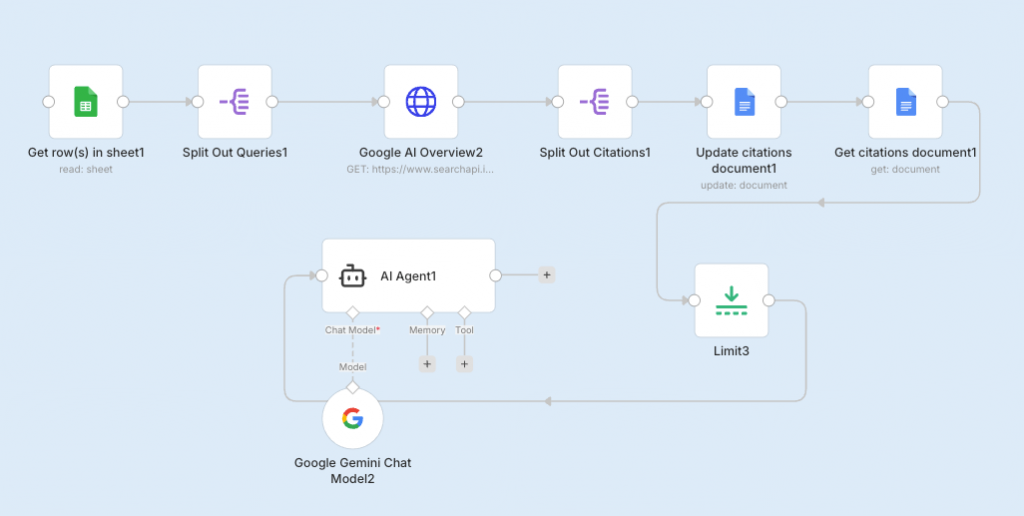
The five-step visibility tracking build
This isn’t a complex build. Five nodes in n8n, one structured AI prompt, and you have a repeatable system. Here’s exactly how it works.
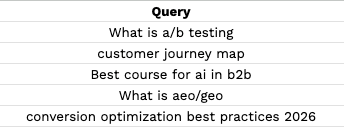
Step 1: Define your query list.
Start with a Google Sheet containing the informational queries where you want to measure brand presence. Think “best [category] tools,” “how to [core use case],” “[topic] platforms compared.” These are the AI Overview-rich queries where citations happen.
For our test run, we focused on queries where CXL should theoretically have authority: B2B marketing education, conversion optimization, and growth marketing training.
Step 2: Split and queue.
Use n8n’s Split node to process queries individually rather than in a batch. This prevents rate-limiting issues with the search API and makes error handling cleaner. One query in, one result out.
Step 3: Pull the AI Overview content.
The SearchAPI.io node runs a live Google search for each query and extracts the AI Overview text.
This is the raw material—the actual generated answer that users see before any organic results. You’re capturing brand mentions, framing, and the competitive set that Google’s AI has decided owns each topic.
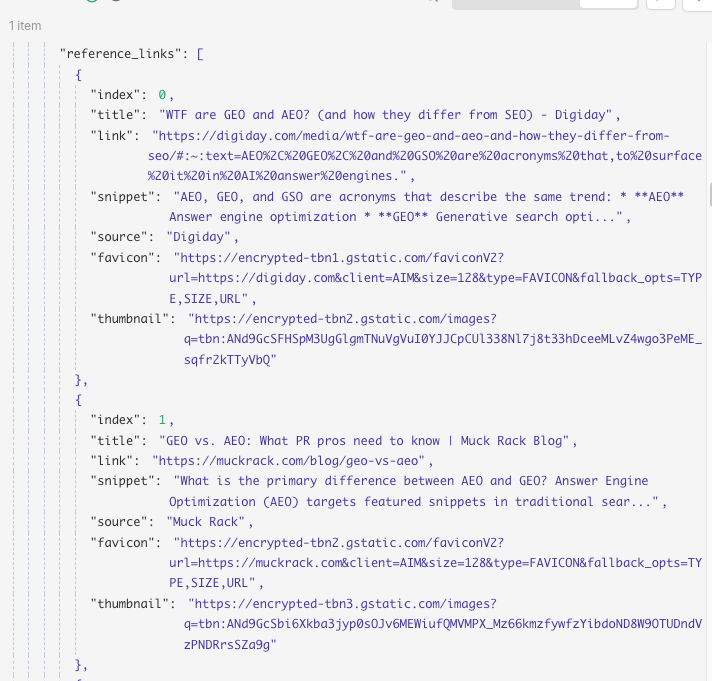
Step 4: Log citations by query.
Each AI Overview response gets documented in a structured output file, query by query, preserving the raw text for the AI analysis step.
Don’t skip this. The raw log is your audit trail, and it’s useful for spotting patterns that the summary report misses.
Step 5: Run the analysis agent.
This is where the workflow earns its keep. Feed the compiled document into an AI agent with a structured extraction prompt.
The prompt we used tells the agent to identify every brand mentioned across all queries, count occurrences, track specific brand mentions (in our case, CXL), build an aggregated brand frequency table, and map each brand to the queries where it appears.
The output is a clean JSON object you can pipe into a dashboard, a Notion doc, or a Slack report.
How the structured prompt works
The prompt design matters more than most people realize. A vague “analyze this for brand mentions” prompt gives you a vague answer.
The structured prompt we used specifies the exact JSON schema the agent should return:
- Total queries analyzed
- Unique brands across all queries
- Per-query brand counts
- Brand-to-query mapping
Prompt
| “You are a structured data extraction engine. You will receive AI Overview transcripts from multiple Google queries. TASK: 1. Identify all brand names mentioned in each transcript. 2. Count how many times each brand appears per query. 3. Track how many times [YOUR BRAND] appears (case-insensitive). 4. Build an aggregated brand count across all queries. 5. Map each brand to the queries where it appears. Return EXACTLY this JSON structure: [schema].” |
The “return EXACTLY this structure” instruction is doing a lot of work. Without it, LLMs tend to editorialize, add caveats, or restructure the output in ways that break downstream parsing.
Specify the schema to get consistent output, and automate the rest.
What visibility data reveals
This is where the workflow stops being a technical exercise and becomes a strategic asset.
The report gives you three things most teams don’t have:
- A precise picture of where you’re invisible
- A named list of who owns the conversations you’re absent from
- A ranked list of topic clusters where closing the authority gap is most feasible
For our test, we ran queries across topics where CXL should have strong presence. The results showed us exactly which informational query clusters our content isn’t authoritative enough on to earn AI Overview citations. And more importantly, which competitors Google’s AI treats as the default reference points for those topics.
The failure mode to watch for: recency bias in AI Overviews.
Google’s AI doesn’t always cite the best content; it often cites the most recently updated, most-linked, or most structurally clear content. That means a competitor with a thinner but better-organized piece can outrank a more thorough article that’s two years stale.
→ Want to see the full citation report from our test run? Download it here.
→ Download the n8n workflow template and run your own visibility audit here.
What to do next
- Build the query list first. Don’t start with “queries we rank for.” Start with “queries where being cited would move our pipeline.” There’s a difference. Prioritize informational queries with high AI Overview saturation: tools like Semrush’s AI Overview filter or manual spot-checks can help you identify these quickly.
- Run the workflow weekly. AI Overview citations shift: Google updates its synthesis models, and competitors publish new content. A single snapshot is interesting, but a time series is actionable. Set the n8n workflow on a weekly schedule and log results to a Google Sheet so you can track citation share over time.
- Treat competitor citation frequency as a content brief. If a competitor appears in 12 of your 15 monitored queries and you appear in 3, that’s a signal that there may be a content authority gap issue. Pull the pages Google is citing, run them through your competitive analysis workflow, and identify what structural or depth differences are driving the disparity.
- Close the loop with content updates. For each topic cluster where you’re under-cited, identify whether the gap is a missing article, an article that needs updating, or a structural problem with how existing content is organized.
The competitive analysis AI agent we built can help diagnose which problem you’re dealing with.
You can’t optimize what you can’t see
If you’re not measuring your citation presence now, you’re making content decisions based on incomplete data. While organic rankings tell you who clicks, AI Overview citations tell you who gets trusted. Those aren’t the same list.
The workflow we’re building costs a SearchAPI.io subscription (starts at about $50/month for moderate volume) and an afternoon of n8n setup. That’s the price of knowing whether your brand is part of the AI-mediated conversation in your category.
We’re now three stages into this build, and the picture is getting clearer.
Automating SEO workflows gives you better data: rankings, gaps, competitors, and opportunities to show up in AI-generated search results.
Tracking AI Overview citations is only step one. The real advantage comes from understanding how AI systems evaluate expertise, authority, and content structure.
In CXL’s AI for B2B Marketing course, you’ll learn how to build AI-ready content systems, automate competitive research, and position your brand as the source AI tools cite.
→ Join one of our live AI-focused sessions:
- Measuring the modern AI-powered funnel
- Optimizing B2B content funnels with AI
- Increase your visibility and revenue from AI-based discovery engines.
- Content strategy for LLM visibility and changing search habits
- Optimize pages for AI search with GEO/AEO
→ Reserve your seat at our 5-day n8n webinar series and learn how to automate manual marketing tasks→ Don’t miss our free webinar: AI Adoption for Leaders with Ramir Arya and Ilinca Munteanu (Co-Founders of WeSimplify)