
William A. Foster once said, “Quality is never an accident; it is always the result of high intention, sincere effort, intelligent direction, and skillful execution; it represents the wise choice of many alternatives.”
Yet, we continue to see businesses pushing leads through doors, pushing customers through funnels… just hoping that they’ll create a high quality, engaged audience by accident.
Unfortunately, it doesn’t work that way. A high quality, engaged audience is anything but accidental. It requires that optimizers put in the effort to create user state models, dig into cohort analysis and correlative metrics, run experiments for different user states, etc.
It’s not the easy choice, but if you’re looking for long-term revenue growth, it’s the only choice.
What Are User State Models?
Josh Aberant of SparkPost gave a great definition of user state models during his eMetrics San Francisco presentation earlier this year…

Josh Aberant, SparkPost:
“User state models simplify working with a lot of metrics by aggregating them into meaningful models that can be used to quickly make decisions on the health of an experimental result.”
Essentially, user state models allow you to measure quality, not just quantity. When optimizers talk about A/B testing and experimentation, they’re focused on increasing conversions. That’s not a bad thing to be focused on, but it’s important to take advantage of user state models if your goal is long-term growth.
Two popular examples of user state models are healthy vs. unhealthy users and casual vs. core users.
Pinterest, for example, uses the casual vs. core user state model. Back in 2014, they blogged about how their users transition from one state to another. Here’s an example graph…
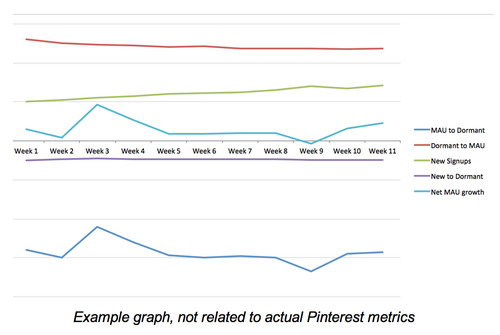
So, the possible transitions are…
- New Signup: When a new person starts using Pinterest.
- New to Dormant: When a new Pinterest user doesn’t use Pinterest in the 28 days following signup.
- MAU to Dormant: When a Pinterest user was a MAU, but didn’t use Pinterest for 28 days.
- Dormant to MAU: When a Pinterest user used Pinterest after having been inactive for 28+ days.
Then, you end up with a graph like this…
With these user states graphed, Pinterest can start to measure quality and understand long-term growth issues, giving them greater insight into which parts of the user lifecycle they need to focus their optimization efforts on…
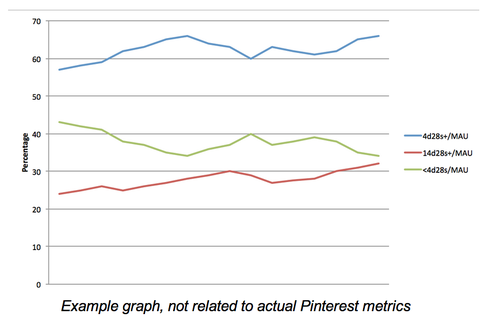
There are many ways people can use Pinterest, so there’s no one specific thing Pinners do to gain value. We use Xd28s as a proxy for the amount of value a person is getting from the service. We segment into three major categories: 14d28s+ are core Pinners who are deriving a lot of value; 4d28s+ are casual and getting some value, and anyone below 4d28 is a marginal Pinner who’s likely at risk of churning because they’re not receiving much value. By monitoring the ratio between the different groups, we can determine how much value people are getting and see how it changes over time. If one of the less desirable segments (such as marginal users or casual users) begin to increase, we can focus on understanding why that’s happening and determine what we can do to fix it.
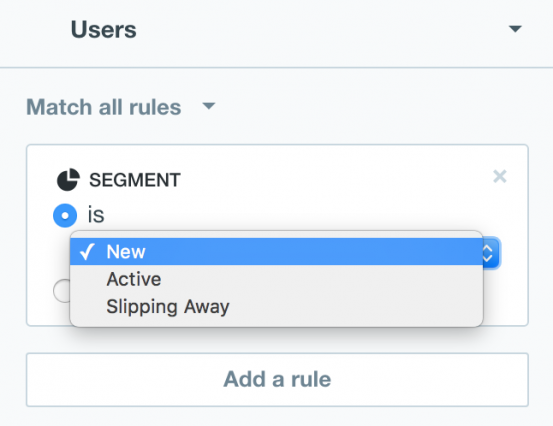
The healthy vs. unhealthy user state model is perhaps more commonly found. Here Intercom.io is using a similar model, for example…
Essentially, there are three categories in the traditional model: healthy, at risk, unhealthy (or transitioning out). Josh shared a graphical version of the model during his presentation…
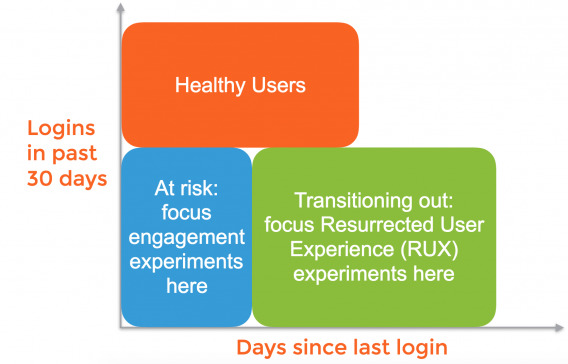
You have to choose the model that’s right for you and your product, but since healthy vs. unhealthy is likely more familiar, we’ll focus on that model throughout this article.
Healthy Users
Healthy users are the people exhibiting behavior that indicates they are active and likely to stick around. Pretty simple, right?
When you think about healthy user behavior, think about Facebook’s 7 friends in 10 days metric. Or Dropbox’s getting a new user to upload a file. Or Zynga’s getting a new user to return the next day (i.e. day 1 retention). Or Slack’s 2,000 messages.
These companies identified a behavior that strongly indicates that a new user will become a long-term, active user. You can do the same and then begin optimizing for that behavior.
Engagement and returning to the site are important healthy user metrics for the companies above because of their business models. Your business model might be different and there is no best practice for choosing a healthy user metric… it’s whatever is best for your bottom line.
For example, Plenty of Fish spoke to over 1,000 women who married someone they met on the dating site. Here’s the question and the most popular answers…
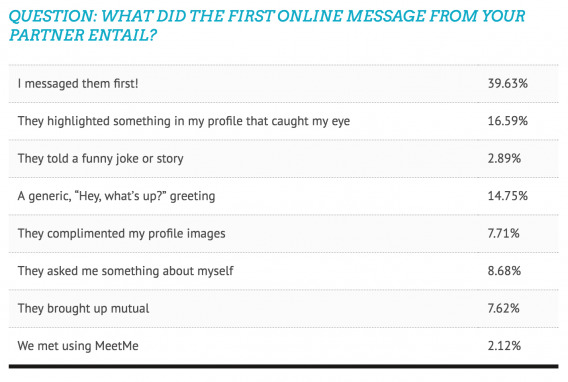
If Plenty of Fish’s primary focus were ensuring their users find long-lasting love, they would want to optimize their site in a way that encourages women to message men first more often.
Some common metrics you might define healthy user behavior by include…
- Days since last login.
- Number of logins in the past 30 days.
- Session length.
- Interactions.
- App screens per session.
Which will indicate that a user is healthy? Which phase of the funnel are those metrics? The answers to these questions will help guide your optimization efforts. You want to optimize so that…
- New users adopt healthy behaviors quickly.
- Healthy users stay in this state.
At Risk & Transitioning Out Users
At risk users are those who aren’t demonstrating the healthy user behavior often as of late. For example, only 1-2 logins in the last 14 days when a healthy user might’ve logged in 7-10 times.
Transitioning out users are similar to at risk users, but they have been exhibiting the unhealthy behavior for a longer period of time. For example, only 1-2 logins in the last 30 days. Here’s how Josh defines transitioning out users…
Josh Aberant, SparkPost:
“Users transitioning out are about to be churned users. Apply resurrection messaging & experiments to them before they leave while it is still much easier to reach them.”
So, at both of these stages, you’ll want to optimize to push unhealthy users back to the healthy user state.
It’s worth noting that there is some controversy surrounding these middle states. Are they meaningful? Aren’t they all transitioning out if they’re not healthy? In my humble opinion, middle states are merely important for understanding the type of resurrection experimentation required.
Someone who is at risk doesn’t require the same type of resurrection experiment as someone who is transitioning out. For the at risk user, a simple activity notification email might be enough. For the transitioning out user, an entire email drip campaign might be more fitting.
If those two states were lumped together, you might go too far or fall too short.
Testing Your User State Model
If you’re unfamiliar with cohort analysis, take a few minutes to read through this detailed article. Cohort analysis is important for testing your user state model and finding meaningful correlations.
Now, open a spreadsheet, get a cohort of users and start inputting data. Among the data, include your healthy user metric and a number of others (e.g. downloads, content consumed / created, etc.)
With that, you can run correlations and see what tends to correlate with your healthy user metric.
Now, your findings are just a hypothesis about what drives that healthy user metric at this point. Where there’s correlation does not mean there is causation.
Running the Regression
Now you’ll need to run a regression to confirm your hypothesis. Ty Magnin of Appcues explains how…

Ty Magnin, Appcues:
“Suppose your app is a website uptime monitoring service like Pingdom. By running this analysis, we can see that receiving a text 6 or more times (the behavior) is positively correlated with long-term retention.
It may seem like a small correlation at only +0.1471 (correlation runs from +1, perfectly correlated, to -1, perfectly negatively correlated), but any positive correlation means that this is part of the puzzle.
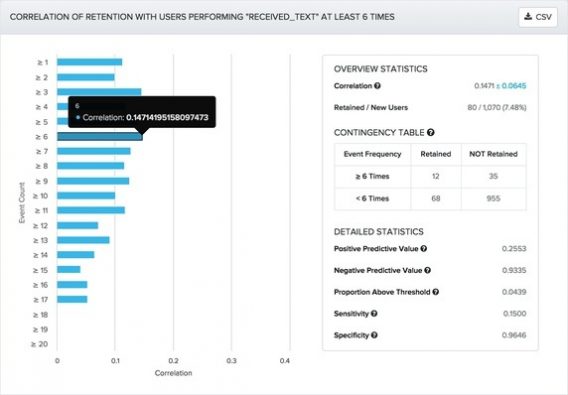
Correlation is a measure of how two numbers are related to each other. In this case receiving a certain amount of texts and the number of people retained. The blue +/- 0.0645 shows how confident you can be in your number. The closer this is to 0, the more likely your correlation calculation is on the money.
There are a few other numbers here that will help you identify your WOW moment and help move people towards it. In particular the Positive and Negative Predictive Values help you assess whether this behavior is something to push people towards.
In this case receiving 6 texts has a PPV of 26% and an NPV of 93%. A PPV of 26% means that receiving 6 texts leads to the person being retained 1 in 4 times, which makes for a pretty solid foundation for building further retention.
What’s more, an NPV of 93% means that people not exhibiting this behavior are almost definitely going to churn, lending further evidence to the need to get people receiving the texts.
Lastly, the Proportion Above Threshold number shows how many of your users overall are already exhibiting the behavior. In this case a low number, such as the 4.3% here, shows that there is still plenty of room to maneuver with this particular behavior, and you can drive more people towards this moment.” (via Quora)
If you don’t use Amplitude (the tool Ty shows in the screenshot above) or a similar tool, you’ll need to do the work yourself.
David Cook, a growth marketing expert who has worked for companies like Atlassian, explains how you can do just that in How to Find Correlative Metrics For Conversion Optimization.
If you’re especially interested in correlative metrics and want to dive deeper into the topic, I suggest you take the time to read that article and learn about the various statistical models you can use to run a regression manually.
Once you confirm your hypothesis, you can begin optimizing to increase the metrics that correlate with your healthy user metric.
Considering Counter Metrics
Before you double down on this new model, please test it. Andrew Chen of Uber explains why this step is important…

Andrew Chen, Uber:
“After you’ve found the model that works for you, then the next step is to try and A/B test it. Do something that prioritizes the input variable and increases it, possibly at the expense of something else. See if those users are more successful as a result. If you see a big difference in your success metric, then you’re on to something. If not, then maybe it’s not a very good model.” (via Quora)
Andrew mentions “possibly at the expense of something else”, which is an important note to make. When working with user state models, you have to be aware of counter metrics.
Josh recommends assigning counter metrics ahead of time because there’s always a risk that your user state model doesn’t apply to the experiment well…
Josh Aberant, SparkPost:
“Best practice: Pair every metric with appropriate counter metric.
- Signups with activations
- Activations with churn
- New paid customers with total revenue
This encourages a holistic approach to growth & will help keep you on the right track with your user state models.”
Every user state model has its limits, which you need to be aware of.
Conclusion
While more leads through the door and more customers through the funnel is a positive, it’s not the only positive optimizers should be focused on. Experimentation paired with user state models means you can manage quality alongside quantity.
On the surface, user state models seem pretty simple…
- Optimize for new users to adopt healthy behaviors quickly and for healthy users to stay in that state.
- Optimize for at risk and transitioning out users to begin demonstrating healthy behaviors again.
But when you get down to it, building a user state model that’s right for your business model and accurate is easier said than done. Here’s how you can get started…
- Choose a healthy user metric, one that is closely tied to your bottom line.
- Use cohort analysis to run correlations and see what tends to correlate with your healthy user metric. That’s your hypothesis.
- Run a regression using a tool like Amplitude (or learn about correlative metrics and run a regression manually) to verify your hypothesis.
- Test your user state model to find its limitations and identify counter metrics early on to keep a holistic growth mindset.
- Begin optimizing to increase the metrics that correlate with your healthy user metric and continue to run resurrection experiments on at risk and transitioning out users.
Related Posts
-

A study by Google had two key findings: Users will judge websites as beautiful or…
-

Tommy evaluates Cheap Recipe Blog, and The Murray Group, an independent insurance agency out of Rochester…
-
What's user experience (UX) got to do with conversions? Everything. Great user experience is a…
-
User flow is the path a user follows through your website interface to complete a…


Shanelle, you never cease to impress me. This article is gold, thanks for writing this as there is so little on the topic…
User state models are overlooked in optimization, I see companies (especially SaaS) often ignore them completely and test without thinking of / identifying their different user models. When they think they’ve got a winning experiment, without any models, they realize later the win came at the expense of other, more valuable metrics and user models. Not the most efficient thing to do…
Ah, and I love Josh’s tip on pairing counter metrics!
Thanks again for sharing.
Thanks a lot, Raphael.
“they realize later the win came at the expense of other, more valuable metrics”… very well said.
One way you could look at user state optimization is as follows:
Assume your company had as many sales as it needed to be fully operational and comfortable… what would you then focus on moreso than if you were struggling to keep the lights on? Lead Quality
But people who want to grow fast usually only focus on lead volume which doesn’t really build lasting systems you can build off of productively.
Well said, Corey. It’s especially important for those in the SaaS space, whether they have as many sales as they need to be comfortable yet or not.