With all the talk about A/B testing, it’s easy to forget there are other methods of measuring the effects of experimentations, such as cohort analysis.
Table of contents
Cohort Analysis 101
Cohort analysis sounds complicated, but it really isn’t. A cohort is basically just a group of subjects that share a common experience during a time span. Here’s the Wikipedia definition:
“In statistics and demography, a cohort is a group of subjects who have shared a particular event together during a particular time span[1] (e.g., people born in Europe between 1918 and 1939; survivors of an aircrash; truck drivers who smoked between age 30 and 40).”
Instead of truckers who smoked at a certain age, however, our cohorts might look something like this:
- Free trial signups in March
- Activated users in February
- Customers acquired by direct mail
You get the picture.
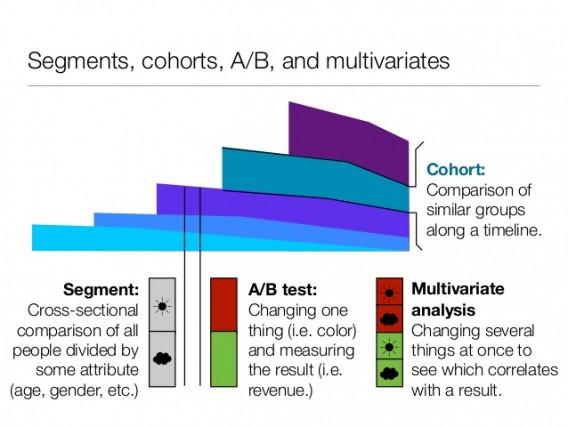
Whereas an A/B test is a cross-sectional study, a cohort experiment is a longitudinal study. They’re commonly used in academia, where they’re used to track changes over time in medicine, psychology, sociology, etc. Still, cohort experiments are invaluable to optimization as well.
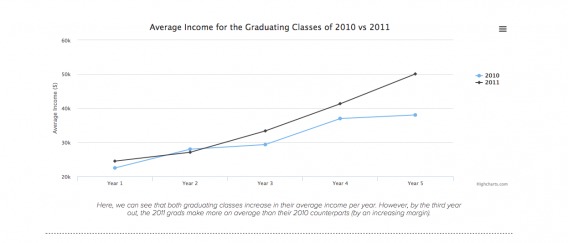
Here’s an example from RJMetrics on cohortanalysis.com:
The class of 2010 is a cohort, because every student in the group graduated in 2010. This is their commonality. Same thing with the class of 2011, except they’re a different cohort because they share a different common experience in a time period.
With cohort analysis, we can find relationships between the characteristics of a population and that population’s behavior. As the above chart shows, we can compare the average income of the class of 2010 and 2011 over the same relative interval (5 years after graduation) for an apple-to-apples comparison. The question we can answer with this is whether or not there is a relationship between a student’s year of graduation and their income.
From this correlation, we can then dive deeper and investigate which exact factors are the cause for their performance differences.
What Kind of Questions Can Cohort Analysis Answer?
Not only can we compare smoking truck drivers and graduating classes, but we can also compare user groups over time to analyze the effectiveness of site changes. Iterative testing is a core component of an optimization program, and therefore, someone who joins this year will not have the same experience as someone who joins next year. Cohort analysis lets you compare these two groups and discover any trends.
In Lean Analytics, Alistair Croll and Benjamin Yoskovitz gave a great example of the value of cohorts, using data from a hypothetical online retailer:
| January | February | March | April | May | |
|---|---|---|---|---|---|
| Total Customers | 1,000 | 2,000 | 3,000 | 4,000 | 5,000 |
| Average Revenue Per Customer | $5.00 | $4.50 | $4.33 | $4.25 | $4.50 |
You can’t learn much from the above table. It’s hard to tell if things are getting better or worse for new customers vs old customers, because you’re lumping them all together in the data.
However, if you laid it out in a chart like the one below, you could see that new users in May are spending much more on average than new users in January did:
| January | February | March | April | May | |
|---|---|---|---|---|---|
| New users | 1,000 | 1,000 | 1,000 | 1,000 | 1,000 |
| Total users | 1,000 | 2,000 | 3,000 | 4,000 | 5,000 |
| Month 1 | $5.00 | $3.00 | $2.00 | $1.00 | $0.50 |
| Month 2 | $6.00 | $4.00 | $2.00 | $1.00 | |
| Month 3 | $7.00 | $6.00 | $5.00 | ||
| Month 4 | $8.00 | $7.00 | |||
| Month 5 | $9.00 |
So by segmenting your data, you can learn things you couldn’t from the aggregate data. These insights can fuel better tests, because you can hone in on trends from specific groups over time.
Of course, cohorts can be used to answer many different questions, it just depends what you seek to know. Some things cohorts can answer:
- How did customers who came in from the Christmas campaign behave differently than those at other times of the year?
- Did one group see one marketing message that the other didn’t? How did that effect their average order value?
- Are free trial users who submit support tickets more likely to convert to customers?
- How does retention differ among different acquisition channels?
- How “sticky” is your product for new users?
One particular useful cohorts can answer is how to find your ideal customer profile. Here’s Lincoln Murphy from Sixteen Ventures explaining:

Lincoln Murphy:
There are lots of ways to leverage cohort analysis, but one of my favorites is as inputs for your Ideal Customer Profile framework.
First, you have to set the parameters for this Ideal Customer: at least the time frame and the goal for that time frame.
Then, if you have existing customer data and you want to get from that who your ideal customer is, cohort analysis is the way to do that.
It starts by looking at the 7 inputs, grouping customers by asking the right questions, and then finding the customers that exist across inputs as the ideal customer cohort.
1. Ready
- Customers that converted in the last year that came in through a bottom-of-the-funnel marketing campaign
- Customers that converted in the last year that signed-up after only x touches
2. Willing
- Customers that converted in the last year that originally reached out for a demo
- Customers that converted in the last year that didn’t have a known catalyst driving the decision (M&A, regulatory)
3. Able
- Customers that converted in the last year that didn’t get a discount
- Customers that converted in the last year that paid up-front
4. Success Potential
- Customers that converted in the last year that achieved first value delivered in under x days
- Customers that converted in the last year that had an NPS score of 9 or 10
5. Acquisition Efficiency
- Customers that converted in the last year that had a sales cycle of less than x weeks
- Customers that converted in the last year where the cost of a click was less than $x
6. Expansion Potential
- Customers that converted in the last year that have added more than x seats
- Customers that converted in the last year that have onboarded at least two new departments
7. Advocacy Potential
- Customers that converted in the last year that have positively reviewed us on at least one third-party site
- Customers that converted in the last year that have been a reference for us at least twice”
Cohort Analysis for CRO
Cohort analysis can give you information that A/B tests results alone cannot, because it tracks different user segments. Amin Ariana gave a great example on Quora of how this can work:

Amin Ariana:
“An A/B test compares two samples of a population for a specific outcome based on a different selection criteria.
A cohort analysis is an A/B test controlled for dependencies such as time and place.
For example, you may hypothesize that red buttons cause users to sign up more than blue buttons. You design an A/B test where the A group sees a red button and the B group sees a blue one. You discover that indeed the A group signs up a lot more often when they see the red button.
But then you decide to do a cohort analysis instead. You segment users by the month they signed up and their zip code. You learn that except for a certain large group of users who signed up in the Summer near the coastal areas, every other A/B test actually indicates inconclusive results for a color preference.
You investigate further into that particular cohort; through them you discover that most of your original non-cohort split test had been biased for the red button because that Summer, your users spent too much time near the ocean and had become blind to the color blue. They could only see red buttons.
For the other normal humans, however, the difference of color is insignificant. If you simply relied on A/B tests, you’d make the incorrect conclusion that the color red is better.”
Not only can cohort analysis provide a better interpretation of your A/B tests, but it can also feed into forming better test ideas as well. You’re essentially learning about your customers from another angle, providing you with valuable quantitative insights.
If you look at your existing customers and can tell, via cohort trends, what their shared characteristics and experiences are, you can infer what parts of that experience are leading to upward or downward trends. As Lincoln Murphy put it, this will “allow you to run top-of-the-funnel tests that are much more effective since you’re starting at such a strong baseline.”
However, cohort analysis without controlled experimentation (e.g. A/B testing or Multivariate testing) is similar to sequential testing. In sequential testing, you simply change things on your site and note how your conversion rate changes over time. The value of A/B testing is that it eliminates the confounding variable of time in analysis.
Used together, A/B testing and cohort analysis can tell you a lot about how you’re growing and what’s working or not. (click to tweet!)
Cohort Analysis for SaaS
Especially for SaaS, cohort analysis can help you optimize different stages of the funnel. Aside from a monthly cohort, there are a few different ways you can slice up your data to get interesting answers.
1. Free Trials
Here’s Lincoln Murphy explaining a few different cohorts you can look at to analyze free trials for your SaaS company:

Lincoln Murphy:
“If you’re testing the Trial length, you can watch the cohort that got the 15-day trial as they move through their lifecycle vs. those that got the 30 days trial. Which converted at a higher rate? At what price level did they convert? Who stayed around after 90-days?
You can also look at prospects in the trial that got a certain email follow-up sequence or went through a particular customer onboarding process. Which ones turned into customers and how much were those customers worth over time?
Or those that signed-up for the trial and selected a certain pricing tier. At what price did they convert? How long until they upgraded to the next level?
Finally, there’s this concept of Common Conversion Activities (CCAs) that shows what prospects in your Free Trial did right before they became a customer. Once you know that, you can work to orchestrate those activities with new prospects.
While I think you should sanity check that against what you believe a prospect would need to do to get to a point where becoming a paying customer is the most logical next step, CCAs are a powerful outcome of a simple cohort analysis on those that converted. You could refine the cohort to only include those that converted at the highest level, those that stayed past 90 days, or those that gave you a high NPS score for example.
2. Pricing
There are a variety of ways you can analyze and test different cohorts in relation to pricing, as well. Notably, you can look at your customers on the highest pricing tear and distinguish their characteristics, such as the marketing channel that brought them in, their time to purchase, and other information.
You can also look at customers that paid up front instead of monthly on an ongoing basis. Check out what brought them in, when, and what type of company they are. Look for any unique characteristics.
3. Revenue
When optimizing for retention, it’s important to look at customers that spend the most over time via upsells.

Lincoln Murphy:
Customers that spend more over time through upsells or other expansion are (probably) your best customers. So it’s good to look at those customers to see everything from where they came from (sales or marketing channel) to how long they stay, their NPS or other Customer Health score, etc.
From there you can decide how actually valuable they are vs. the cost/effort to acquire, whether that cohort would be willing to be an advocate for you, etc.
4. Sales
Optimizing the sales process is a tricky topic, as there are many ways to do it. One way that isn’t talked about often, yet is important, is optimizing for SALs (or Sales Accepted Leads). As Lincoln explains:

Lincoln Murphy:
It is a lead that the sales person has accepted from marketing or the BDA/SDR group as a lead they think they can close. It meets the right criteria, has (probably) been vetted, etc.
SALs are the goal for many enterprise marketing and sales groups, but knowing which channel brought them in is the key to really scaling your sales velocity.”
Which Cohorts Should You Track?
Because you can track any number of cohorts, to preserve your time and sanity you’ll have to be selective. Though this won’t be the same for everyone (it depends on your goals and KPIs), KISSMetrics laid out some questions to ask yourself when thinking about which cohorts to track:
- Will the data I get from these cohorts produce insights that can change my marketing strategy?
- Will I be able to clearly know what’s working and what’s not when it comes to marketing?
- What targets do I need to hit this year? Will this cohort help me improve that metric?”
That said, I asked Lincoln Murphy what some of his favorite cohorts are. They may or may not apply to your company (but they probably will if you’re SaaS):

Lincoln Murphy:
“Some of my favorite cohorts are based on:
Customer Health – I want to see customers that are healthy and may become an advocate or buy more, customers that are doing well but may need some attention, and those that are at-risk for churning out.
Meaningfully active – I’ve said before that “Active Users” is a Vanity Metric; you want customers that aren’t just active, but doing things that will allow them to achieve their Desired Outcome. That’s being “meaningfully active” and you want to look at customers that fit that bill to ensure they’re on the right track. If they’re not, you need to intervene to ensure they’re moving forward. You can look at customers that fit that description on a daily, weekly, or monthly basis and take the appropriate action.
Stick point – There’s a point – a time frame, a functional touchstone, a result, etc. – where if the customer achieves that, they will likely stay at least the average customer lifetime. For activity or results-based stick points, looking at customers that haven’t yet achieved the stick point will allow you to intervene to help get them to the right place. For those on time-based stick points you can just see the cohort that hasn’t hit the stick point yet and know that you shouldn’t include those customers as actual customers yet.
Industry/Use case – One thing I always encourage the SaaS companies I work with to do is get their customers to tell them what industry they’re in or what they intend to do with the product; maybe both. If I can know that you’re in the Logistics industry and you are trying to improve your workflows, I can create messaging for you, see how this group stacks-up against other cohorts, or to figure out if there’s a particular use case that leads to faster account expansion so I can go acquire more of that type of customer.
Revenue potential – Many SaaS companies segment customers based on current revenue, but that’s missing a huge opportunity. While current revenue is good, with SaaS – especially in a land-and-expand scenario where a few people, a department, or even a division can bring you into the company but you could eventually spread across the enterprise – revenue potential is a much more meaningful metric. And to be able to look across a swath of customers that have a revenue potential of $100k/ARR or 10x their current ARR (regardless), that becomes something much more interesting.”
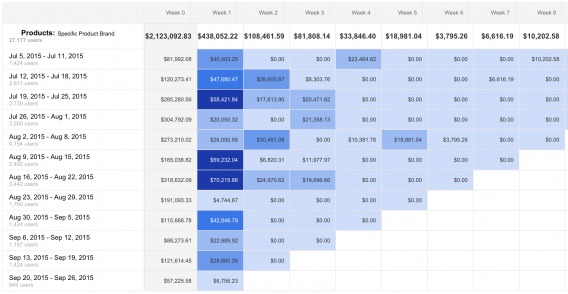
Let’s look at an example from an eCommerce company and what cohorts are valuable to them. In this example, PPC Hero chose to create a segment to include only users who purchased a specific brand. Their metric was revenue:
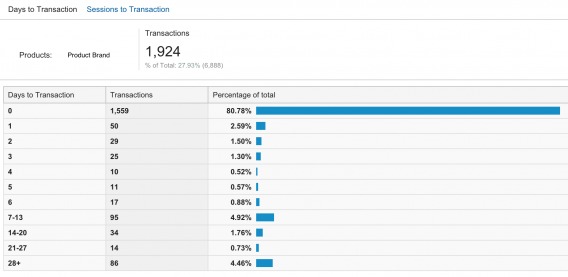
Most of the revenue, of course, occurred during week 0 (acquisition), but there is also a decent amount in weeks 1 and 2. So PPC Hero looked at days to transaction for this segment:
From this, they could tell that 4.95% of transactions happen between days 7-13. They could also see fluctuations in conversions, which might allude to some form of external promotion. Using this data, they can also better plan for their remarketing campaign, honing in on the times that customers are most likely to purchase.
Finally, Ryan Farley, co-founder of on-demand lawn mowing service LawnStarter, mentioned that his favorite cohort to track is measured by acquisition channel.

Ryan Farley:
“One of our most powerful cohorts is our retention by acquisition channel. For example, people from direct mail tend to stay far longer, so we can afford to have a higher CAC than say Ads, which has a much lower retention rate.”
Conclusion
At its simplest, cohorts are groups that share a common experience across a time span. They are people that signed up in February, or free trial users that began in March, etc. Used in collaboration with a robust testing program, the insights and results gained can be phenomenal. (click to tweet!)
As you can see from the article, however, there are unlimited ways that you can layer on segments for advanced and particular insight. You can get lost in a labyrinth of possibilities, so when you’re choosing which cohorts to analyze, use KISSmetrics’ questions:
- Will the data I get from these cohorts produce insights that can change my marketing strategy?
- Will I be able to clearly know what’s working and what’s not when it comes to marketing?
- What targets do I need to hit this year? Will this cohort help me improve that metric?”


great article Alex! Now i have to figure out how to use the analysis cohort to make a better ecommerce personalization.
Maybe this kind of analysis works better for Saas, isn’t it?