Free trials are to SaaS applications as keys are to locks. The right one gets you in right away, but sometimes you have to try a few before you find the one that works.
For many SaaS and cloud service providers, 100% of customers sign up for a free trial as part of the sales process — yet one study suggested that even the best-in-class of SaaS marketers were losing a staggering 75% of those who signed up for a free trial before they entered their credit card details.
Why the gap between signup and conversion? Let me take a guess: it’s in the quality of your leads and the signup process you’re guiding them through.
Table of contents
- Your free trial signups are hardly equal
- How the signup funnel works
- Who’s coming to your site?
- Using past data to qualify leads
- The complexity of your service makes a difference
- The free trial signup process and how it influences conversions
- How we’ve optimized the free trial funnel at Flow
- The bells and whistles
- Keeping the magic alive
- Always be testing
- Conclusion
Your free trial signups are hardly equal
For the purpose of this post, we’re assuming two things: your product is great (it is, right?) and you’re executing targeted marketing campaigns that are garnering traffic.
With that in mind, know this first: the user-commitment levels you find in the people who’ve completed the initial sign up for a free trial will vastly vary in range from “tire kickers” to “true evaluators.”
The chart below, a benchmark study done by Totango, shows the typical ratio of tire kickers to true evaluators:
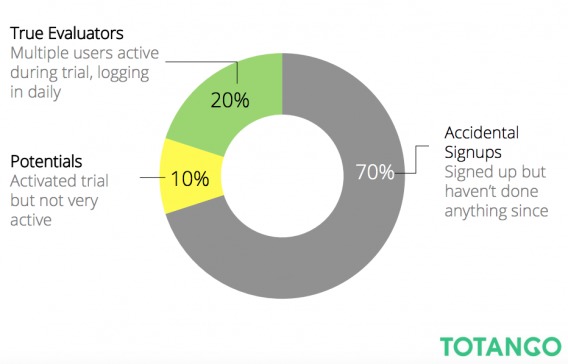
As you can probably assume, it’s the true evaluators that show the greatest conversion rates. With that in mind, understanding the commitment levels of the people in your signup funnel is key to building out a lead generation model that increases the number of true evaluators in your signup pool in the first place.
How the signup funnel works
The basic free trial funnel can be thought of in four steps:
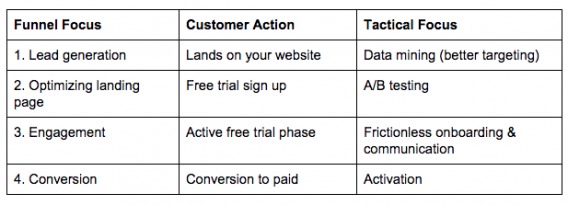
We’d all rather shoot fish in a barrel when it comes to customer conversion. The first step in getting there is attracting more qualified leads. The strongest conversions have started even before a customer lands on your site, through strategic SEO practices and targeted inbound marketing.
With a goal of attracting a greater number of true evaluators, gathering data on who’s converted in the past and charting their entire purchase process gives you a foundation to work from.
Here are a few questions you should be able to answer based on the information gathered in your sign up form and/or via analytics:
- What was the traffic source for converted users?
- What demographics data can you extrapolate from your paying users?
- Is there an industry or job title (i.e. Manager, IT, Marketing) that is converting at a much higher rate? Is there an industry or role you are targeting that isn’t converting to your expectations?
- How many pages did converted users view before signing up?
Once you’ve built up at least one profile of converted users, you can then work to improve the lead gen process and implement A/B tests on signup forms and processes to: 1) attract and onboard more true evaluators, and 2) convert a higher number of them.
Who’s coming to your site?
One of the most important rules of any salesperson or marketer is know your audience. Gathering key data, and building goals around it, can prove incredibly valuable in optimizing the signup process if done properly.
An important characteristic of your audience will be the traffic source: direct, organic, referral or social. Your converted customer will inevitably pass through one (or more) of these sources with varying degrees of success. If you aren’t building landing pages for each, you are missing out on an opportunity to increase your conversions from the outset, as well as make tracking more manageable.
Another way to accurately track visitor source is by asking users to submit certain info in the free signup form. (i.e. How did you find us?) There are pros and cons to this approach. On one hand, you’re likely to get an accurate answer. On the other hand, it goes against the idea of frictionless signups. (More on that, later.)
Depending on your cost per lead acquisition, as well as conversion rates per traffic source, you’ll want to spend time A/B testing the amount of information asked for, the way it’s asked, and the order it’s asked in (among other things), while prioritizing specific sources.
A side note: your paid traffic should be highly qualified (assuming you are employing a proper PPC campaign), but can also result in a potentially high customer acquisition cost (CAC). If you’re finding the leads unqualified and tough to convert, it’s likely you’re either using the wrong keywords or need to completely re-evaluate your campaign.
Using past data to qualify leads
Using a comprehensive analytics platform is key to gathering and interpreting data to create, revise, and test both your lead gen and signup funnel. Be it Google Analytics (by far the most popular analytics provider), Adobe, Kiss, Moz, Marketo, Hubspot, Mixpanel, or any other options, the software is only as useful as you make it.
KISSmetrics is a very powerful tool to experiment with, and can provide insights into individual users.
Once you’ve established measurable targets you’d like to work toward, you can create goals in your analytics to track what you’ve designated as key data points. (Check out this post on how to set up goals and conversion tracking in Google Analytics.)
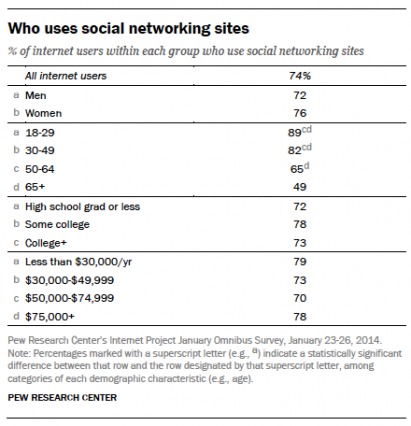
In the initial signup phase, you can use a tool like Pew (see image below) to explore socio-demographics data from specific social or referral sources. During the signup process itself, tools like Mixpanel and CrazyEgg offer event/action-based tracking and heatmap/eye-tracking tools, respectively, so you can better understand where you’re losing customers in the process.
Once you’ve converted a sample size of converted users, a new set of data can be drawn to analyze the difference between those who convert and those who drop off. Consider common traits amongst those who convert:
- Do they mostly come from a specific traffic source? What keywords? What content?
- How many emails did they receive? Open?
- Did they have a personalized demo?
- If you collected data in the free trial form, what data do they share that seems to have similarities?
- How many page views were required to get them to convert?
- What messaging may have triggered the conversion?
Once you have the data, you can track your leads through the process from lead to free trial to paying customer and look for improvements through A/B testing at each step of the way, from landing pages to calls to action and emails to direct support.
The complexity of your service makes a difference
When it comes to selling SaaS solutions, there are several factors regarding the software itself and your brand that impact the signup process. The complexity of the SaaS and level of service required, for example, is a huge factor. Consider the following:
- Do users require training or can they use the software out of the box?
- What level of financial commitment does buying your software require?
- What industry are you operating in? Is there an inherent level of risk aversion within this industry?
- Is your SaaS business-critical? Does your SaaS provide an immediate and direct impact on customer relationships (Salesforce)? Does it improve accounting processes (Freshbooks)? Or is it a “nice-to-have” (Buffer or Evernote)?
- Does your brand have significant name recognition amongst potential users?
Each of these factors will determine the level of information and — for lack of a better term — hand-holding that’s needed in the signup process, ultimately either widening or narrowing your funnel. This will determine what kind of relationship you need to build and how narrow, top to bottom, your funnel will be.
A software with little complexity and a low price point will require less sales and service to onboard, allowing you to cast the net much wider at the top of your funnel. A high complexity, business-critical SaaS solution, on other hand, where the price model requires high service levels means your unqualified (organic) traffic will require a much higher degree of attention (and hand holding), and should therefore be more targeted.
The free trial signup process and how it influences conversions
With interested customers (from tire kickers to true evaluators) onboard, the focus shifts to the actual signup process. There are at least three steps I’ve identified to be crucial to gathering what’s needed, engaging the customer, and inspiring action. Only once you’ve solidified the necessary steps can you go about optimizing each one.
1. Information gathering. How much information do you request at the outset? This can range from a single-field form that requests an email address to a more detailed form that requires company, source, credit card info, and more.
Knowing that this is the first step for a potential customer once they’ve landed on your site, your goal here is to strike a balance between minimizing friction and collecting enough data to use later in customizing communications and tracking the conversion process.
The less fields, the better? Not always. Some may argue increased friction increases the quality of leads, balancing the ratio of true evaluators to tire kickers.
Consider this: one study suggests that free trial signups were more successful when credit card information was not required (10% of signups versus 2%). Seems predictable, yeah? Yet the same study found that 50% of people who enter a credit card in the free trial stage will convert to paying customers versus 15% when it’s not required. Suddenly your opinion might be swayed.
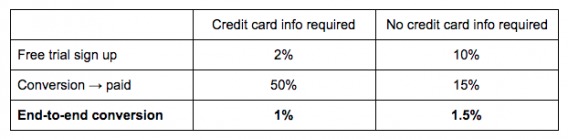
The net result? End-to-end conversion came out ahead when credit card information was not required.
In another case study, Expedia removed just one field from its purchase form that was causing confusion, and therefore drop off — and that small change resulted in an extra $12M in profit year-over-year.
There’s no right or wrong answer — the key is testing to find what works. A workaround is to offer the option of social logins (sign in using networks such as Facebook, Google, or LinkedIn) and thereby skipping form friction. The jury is still out on which network is best for B2B versus B2C companies, but one thing’s certain: it’s still best to make this an option rather than a requirement, as some people will hesitate knowing their profile information will be shared.
2. Verify email. At the very least, you’ll be asking for the customer’s email address, adding a required verification step into the process.
3. Setting the user up for success. Consider what other crucial actions need to be taken to complete sign up and guarantee the best experience, thereby encouraging later conversion. In some cases, this might include building a profile. In others, it might include inviting team members. Still in others, it might include an intro to your SaaS solution (explainer videos and/or onboarding tools).
An important note here: true evaluators will likely have done their research on your service, so an “intro to your SaaS solution” may actually increase friction for the very group you’re optimizing for. With that in mind, offer the option to skip this step to get started right away — and make it prominent.
How we’ve optimized the free trial funnel at Flow
Once you’ve identified the process the customer needs to go through, it’s time to get to work optimizing each step of the way using the data you’ve collected. Let’s look at that in terms of what we do at Flow:
Step 1: Signup form
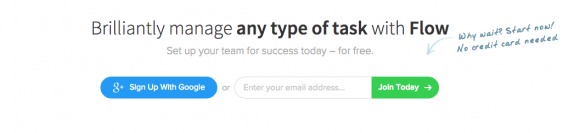
You can’t start a sign-up funnel without a sign-up form, and we know that our target market uses both options (Google authentication and email). As mentioned, it’s not yet clear which social login converts best for a B2B audience, but in the favor of keeping the signup form short, sweet, and to the point, we use just one social option — and avoid the credit card barrier.
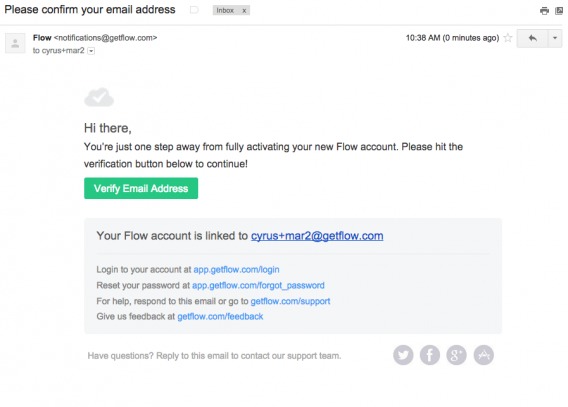
Step 2: Verify email
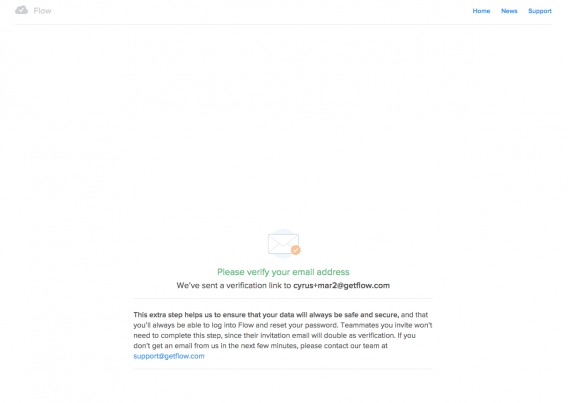
Using a confirmation email for verification (the above and below screenshots) may seem like unnecessary friction, but based on our pre-redesign completion rates, the risk associated with not verifying the identity of trial users outweighed our concern over increased friction.
In the case of Flow, trial users have the ability to send other people invitations to our product and assign them tasks. Eliminating spammers and insincere tire kickers at this stage — i.e. someone posing as [email protected] — is well worth the risk of losing trial users by requiring verification.
Step 3 – Intro to the SaaS solution
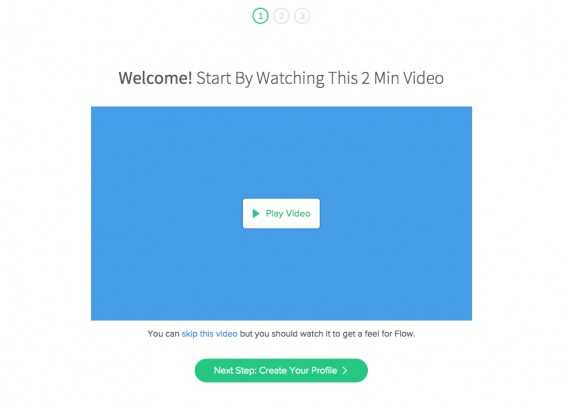
We know — based on our data — that 45% of visitors click to watch the video on our “intro to the SaaS” step. About half of those people watch the entire video. Despite potentially halving the conversion rate, we are adamant about including the video because seeing Flow in action gives a better understanding of how to use it in the trial period. It sets those users up for success, and a greater likelihood of conversion at the end of the line.
In optimizing this page, we shortened the copy to eliminate the potential for overwhelm, offered the option to skip it, and placed the CTA directly below the video.
Step 4 – Profile completion
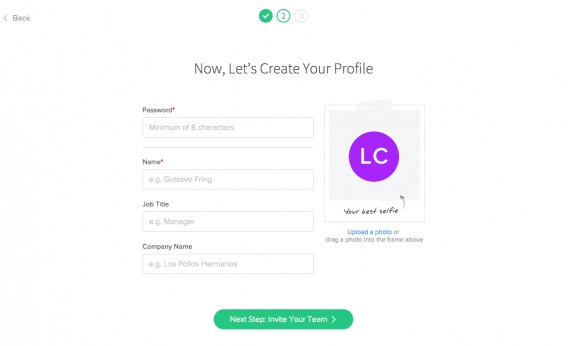
Based on a separate cohort analysis of what differentiates engaged users from those who try Flow for a day and never come back, we know that people are more likely to adopt Flow if they enter some professional and personal info (e.g., title, company, photo).
To optimize the page, we shortened the form by two fields, placed the CTA directly below it, and lightened up the copy in the photo box (who doesn’t love a good selfie?).
Step 5 – Team invites
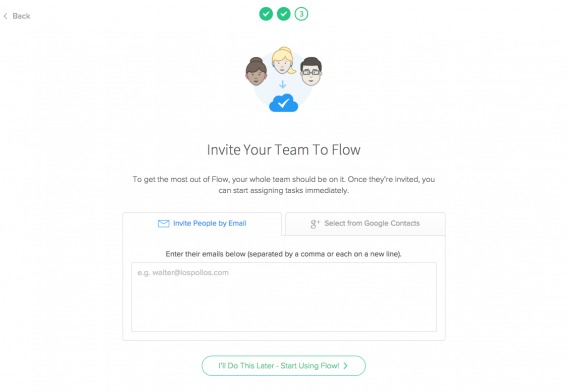
Getting other team members to use Flow is critical to delivering on Flow’s value proposition — but we realize individual signups for free trials are common, so giving the option to skip this step is paramount. To optimize, we changed to a tab metaphor to toggle between email and Google+ invite options, changed the intimidating “Import Google Contacts” copy to “Select from Google Contacts”, and again placed the CTA prominently below the form.
Optimization for the win: the secrets of how we increased conversion by 17.3%
For the 30-day period prior to our design changes, the sign-up funnel completion rate was 55.31%:
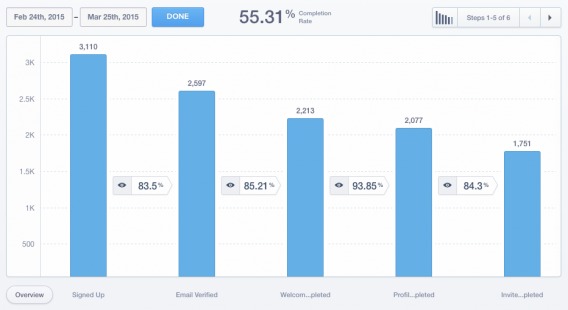
For the 29-day period following our design changes, the completion rate is 64.89%:
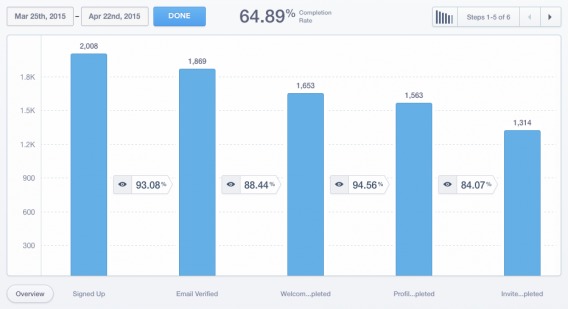
The net increase in conversion is 17.3%.
As a small team, we had to choose between spending 2-3x as long building these changes into an A/B test or measuring any difference longitudinally (pre and post change). We decided on the latter due to constraints on time and resources. During the measured period, there were no changes in the type, source, or volume of traffic.
Our process for optimizing the sign-up funnel:
- Measure the step-by-step conversion rate in the sign-up funnel to understand (a) how the entire process is working and (b) where the opportunities exist for step-level improvements
- Gather on-page feedback about where each visitors clicks, how much she scrolls, where her mouse pauses, how much effort appears to go into completing forms, whether she struggles to find where to click
- Invite visitors to provide feedback about the sign-up process — immediately after they complete the funnel. Keep in mind that by doing so, you’re only getting feedback from people who are successful — so it’s somewhat self selecting (even still, we did hear some negative feedback). Also, you’re taking a risk that by asking people for feedback, you’re interrupting their desired goal, which in our case is to try the application. But it was more important to get the feedback for a short period of time than to worry about the impact on short-term conversion.
- For the entire process and for each step within, develop hypotheses about problems in the UI that are hindering people’s progress toward their goal.
- Work with a designer and copywriter to take what’s been learned and any theories about what needed to be addressed — and turn them into new designs. We make sure to draw a clear line between every design change and the data to which it’s targeted. Additional design “ideas” (which inevitably come up) are measured against what we learned during the data gathering process.
- We ranked the design fixes based on impact and effort required. Our timeline and available resources were limited so we had to be thoughtful about what to change.
- New designs are built, tested thoroughly, and then rolled out — all at once. Since we decided to run this “test” as a before/after comparison, we needed to turn off any campaigns well before the test begun and keep them off during the period following deployment of the new designs.
In terms of tools used (besides Flow — which we use to keep projects on track) we leaned heavily on the following tools during the optimization process:
- Mixpanel: Used to capture the data for the various sign-up funnel steps.
- Intercom: Used to acquire direct, qualitative feedback from visitors who just completed the funnel.
- Inspectlet: Used to capture data (session recording, click maps, attention maps, scroll maps) on how visitors interact with the sign-up pages.
The bells and whistles
Keeping the process simple is key, but it shouldn’t be at the expense of customer satisfaction. Here are a few more tactics to consider in the plight to increase conversion after sign up:
- Live chat. A form of active support, live chat opens the doors to increase questions, which furthers engagement. The focus should be on helpfulness, not sales.
- Tutorials and FAQs. Onboarding tools make on-screen tutorials possible, while clever FAQs can answer questions and reduce hesitations.
- Extended trials. Certain (qualified) clients just need that little extra. Look for customers who have actively used your SaaS during trial and are nearing the end to measure purchase intention and see if they’d like to explore the product more.
In any case of additions to the signup process, the key is to help, not hinder.
Keeping the magic alive
Both during and after the signup process, touchpoints are everything. Striking the balance between staying top of mind and being overaggressive is, of course, the goal.
Consider this: someone who actively uses your product past the first three days of the trial is four times more likely to convert.
So, when you notice that after two days into the trial the account is inactive, what are you doing to get the user to sign back in?
Implement triggered email marketing. Suppose your user signs up, goes through five page views, yet doesn’t complete an important task (such as uploading a piece of content or filling out an important form). There’s interest, but a nudge for completion might be necessary. Likewise, suppose your user signs up but 24 hours later, they haven’t yet logged in.
In both situations, an automated email system would trigger an email, of course targeted and worded accordingly, to gently nudge the customer towards a desired action. There is a lot to be done in this area to encourage engagement. Triggered emails can have a 152% increase in click through rates compared to ordinary emails. How many conversions is that to you?
Always be testing
Across all your touchpoints, A/B testing should be constant — with innovation and new ideas being constantly implemented. One step at a time, you can play with variables, testing to see which elicits higher response rates, and conversions, much like we did at each step of the signup process. Where can you start? Here are a few ideas:
- Frequency of emails, and where they fall in the signup process.
- Length of trials (one company argues that 99% of all SaaS should be providing 14 day trials, maximum).
- Providing extensions to trials to increase conversions.
- Offer users a discount if they provide their credit card before the trial is over. The logic is that there are certain customers who are unsure of making the purchase, and this could make it an easier decision.
Conclusion
There is no one-size-fits-all answer to guaranteeing signup success or conversion. It comes down to how much you’re paying attention to your customer during the lead generation process, how you’re actively encouraging them to move into your funnel, and the steps you have in place to push them toward conversion.
Formulate the goal, gather the data, test different variables, and more than anything, stay authentic to your brand.
Related Posts
-
Here's part 2 of my annual free mini-reviews. See first part here. Again, the disclaimer:…
-
Do you know who is Ira Glass? You better. He's the host and producer of…
-

If I asked you, “what’s the most persuasive word in the English language,” what would…
-

I know what you're thinking, "Ugh... webinars..." I couldn't agree with you more. They're played…

Hey Lance!
Terrific post. Thanks so much for sharing all of this. It was really interesting to read about your decision to make changes to the funnel without first A/B testing. I’ve been working on a project where the client went ahead and implemented the layout and copy changes based on the research I did for the funnel. Sign ups have increased by 17% compared with the previous month (based on goals set up in GA) but without split testing I wonder if it’s a case of apples to oranges. Am I overthinking this or should I be teasing apart the data more before coming to any conclusions?
Hey Jen — if you have no choice but to measure the impact of changes longitudinally (due to cost, availability development resources, etc.), then I’d compare 1 week prior to 1 week following, 2 weeks prior to 2 weeks following, 1 month prior to 1 month following, 1 quarter prior to 1 quarter following… you get the picture. I’d also look at year-over-year data, although organic growth could make that tricky. OTOH, if you can “extract” the natural organic growth rate from the “following” conversion rate metrics, you could get a decent read on things.
Hi Lance, thanks for this thorough article. I wanted to ask about the big drop in signed-up users. There is a 33% drop in sign-ups (from 3110 to 2008). The final conversion number is also lower: 1314 after introducing changes vs 1751 on the “control” version.
You claimed that the volume and quality of your traffic among both periods are the same. I understand, that you spent exactly the same amount of money on traffic acquisition, but generated 337 conversions less.
It seems that you actually harmed your conversion rate. The completion rate of the funnel is better, but maybe the reason is that you got better leads in the top of the funnel (less people signed-up, so they have to be more into your solution). My question is: has your business really gained revenue thanks to changes you made?
Hi Damian!
Thanks for commenting.
The “Signed Up” event simply represents the number of visitors who clicked the “Sign-up” button on our home page, and for this funnel optimization (and analysis), we made no changes to the home page design or copy.
Additionally, just as an FYI, we weren’t spending anything on acquiring traffic.
However, you did catch a data issue. The “before” data, showing 3,110 sign-ups, include visitors to 2 different pages, whereas the “after” data include sign-up events for just the home page.
When I re-run the pre-optimization data to include only the home page sign-up button, we get 1,976 sign-ups and a 54.88% completion rate, so the net conversion lift actually improves a little from 17.3% to 18.09%.
Hi Lance!
Thanks for your answer, it surely clarifies the case a little. I’m still confused about the changes you introduced though. Could you share the before and after screenshots of the following steps in the funnel? I think it would be interesting for all the readers to see what exactly influenced the conversion rate.
I’m also wondering why have you included only the sign-ups that occured after clicking the button on the homepage? Why didn’t you take into account sign-ups from other pages, like pricing or features?
Could you also share some tips on getting all this traffic you have without spending any money? It looks like a profitable strategy ;-)