
If I told you that a post earned 30 links and 100 shares, how would you respond?
“Wow, must’ve been amazing!”
“Not bad.”
“Total flop!”
Your gut reaction says more about the site you’re used to working on than it does about my hypothetical example.
Indeed, the size and power of a site—not necessarily the value of the content—can have the greatest influence on results. That matters, especially when it comes to content research.
The good news is that improving content research doesn’t require an elaborate process or extra hours. In most cases, it means pulling one more data point from a tool you already use and adding one more column to your spreadsheet.
Doing so unlocks access to a high-value dataset that few, if any, of your competitors are using.
Table of contents
Why the way you do content research right now doesn’t work
Your exported lists of “most shared” and “most linked” content are failing you.
That’s because they’re biased toward big sites—they elevate tons of mediocre stuff on massive websites while burying phenomenal content on smaller sites.
Want proof? Say you’re going to write an article on A/B testing. You jump into Ahrefs’ Content Explorer and pull up a list of “Top content.” Here’s the top of that list:
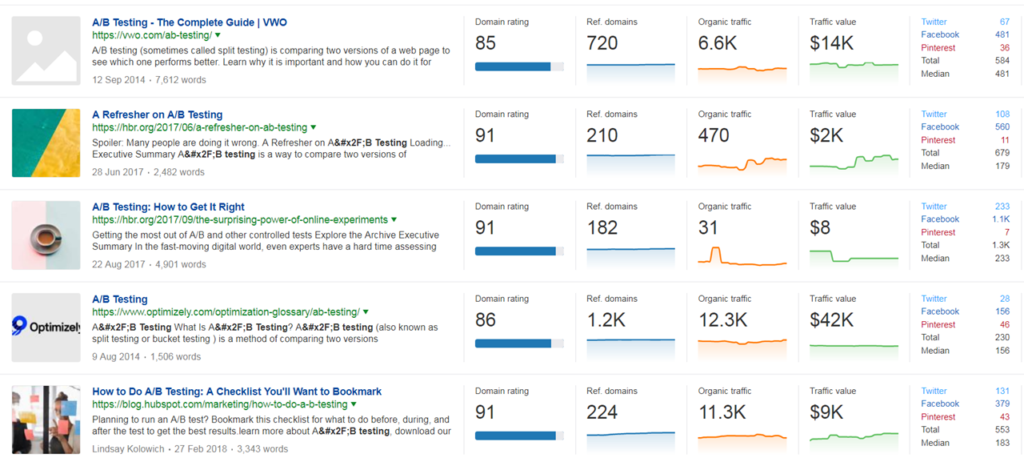
If you scrolled down through the top 20 results, do you know the lowest Domain Rating? 83. For context, CXL has been around a decade, has a blog with more than 700 long-form posts, and our Domain Rating is only a bit above that (85).
Big sites don’t produce bad content, but their size muddies the data. You don’t know whether an article earned links or shares because everything they publish earns some links and shares or because the article itself was phenomenal.
Likewise, you miss out on sites whose top-performing content doesn’t hit the same absolute highs as big sites’ average (and below-average) posts.
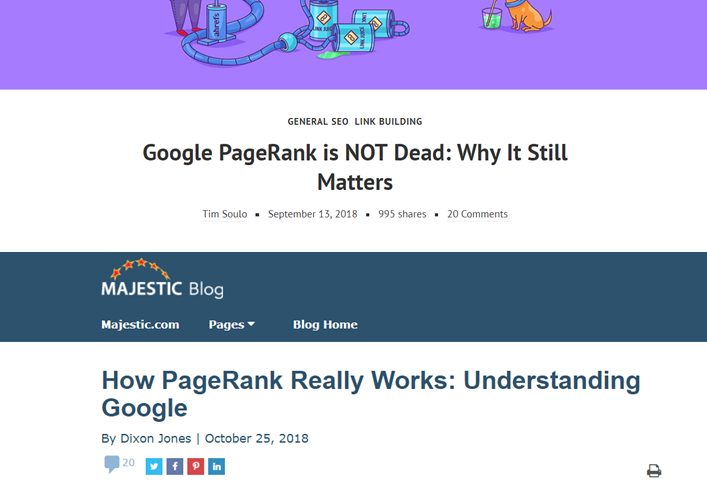
Here’s a more specific example. Take these two posts:
- “Google PageRank is NOT Dead: Why It Still Matters” from Ahrefs, which earned 132 referring domains and 1,000 social shares.
- “How PageRank Really Works: Understanding Google” from Majestic, which earned 96 referring domains and 484 social shares.
Which post was the bigger success? Which has more lessons for you if you wanted to produce a post on PageRank? Every tool—and most of us—would say the Ahrefs post. It earned more links and shares.
But, it turns out, one in four posts on Ahrefs outperforms that PageRank post. Assuming a twice-weekly publishing schedule, that means the post gets outperformed every couple of weeks.
Meanwhile, the Majestic post is the top-performing post of all time for the site. And I’m willing to bet that the all-time-best post on a site contains more secrets about how to write compellingly on the topic.
So how do you fold that context into your content research?
4 ways to improve your content research
When it comes to improving content research, you’re trying to control for two variables:
- Site strength. This includes the Domain Rating, brand recognition, and social media following. Controlling for site strength helps you pay less attention to mediocre content on great sites and more attention to great content on any site.
- Site lifecycle. Most posts on Moz earn dozens of comments now, but their early posts certainly didn’t. Controlling for time—where a site was in its lifecycle—helps you zero in on content that did exceptionally well for that point in time.
There are four simple ways to do it.
1. Find above-average content on a handful of sites.
You have a few competitors. You want to find the best stuff they’ve published. If one or two of those competitor sites is vastly larger than the others, however, you’re out of luck.
Take this list of six SEO-focused sites:
- ahrefs.com
- bounteous.com
- briggsby.com
- kevin-indig.com
- mariehaynes.com
- searchwilderness.com
If you simply export a list of most-linked content, here’s what you get:
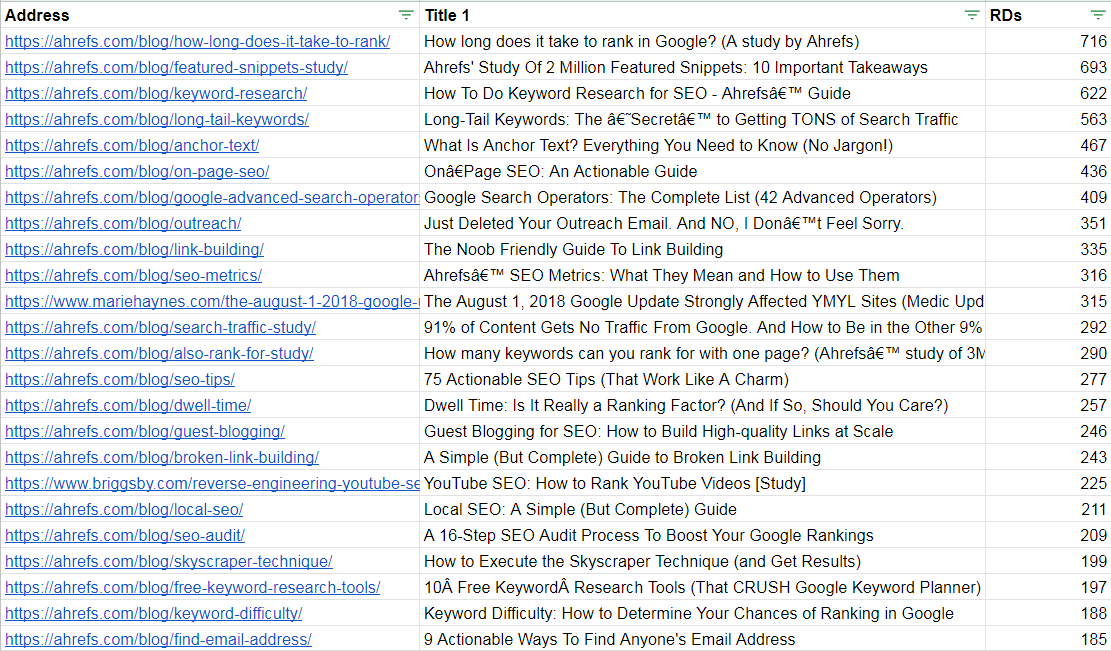
Ahrefs dominates the top 50 results:
- ahrefs.com = 92% of the URLs;
- briggsby.com = 6%;
- mariehaynes.com = 2%
- bounteous.com, kevin-indig.com, and searchwilderness.com = 0%.
Three sites don’t have any URLs included, even though we know they publish great stuff.
You can control for site size—mainly Ahrefs, in this instance—by adapting a metric from baseball: Wins Above Replacement (WAR).
WAR asks, “If Player X got injured and we had to replace them with an average player, how many ‘wins’ would we lose?”
Translated to content, WAR becomes “Links Above Replacement (LAR),” “Shares Above Replacement (SAR),” etc.
Calculating LAR is easy:
- LAR = Links to a post / Average links per post for that site
- LAR = 45 / 18
- LAR = 2.5
So, in the above example, we could say that “Compared to an average post from the site, this post earned 2.5 times the number of links.”
To do that calculation for our six SEO-focused sites:
- Crawl the sites with Screaming Frog, using the Ahrefs API to pull the number of referring domains for every post.
- Add a column to your spreadsheet that divides the referring domains to a post by the average number of referring domains per post for that site. (Use the =AVERAGEIF function to calculate this on the fly, with the domain name as the criterion.)
Running that calculation gives us a very different list—one focused on above-average content on every site:
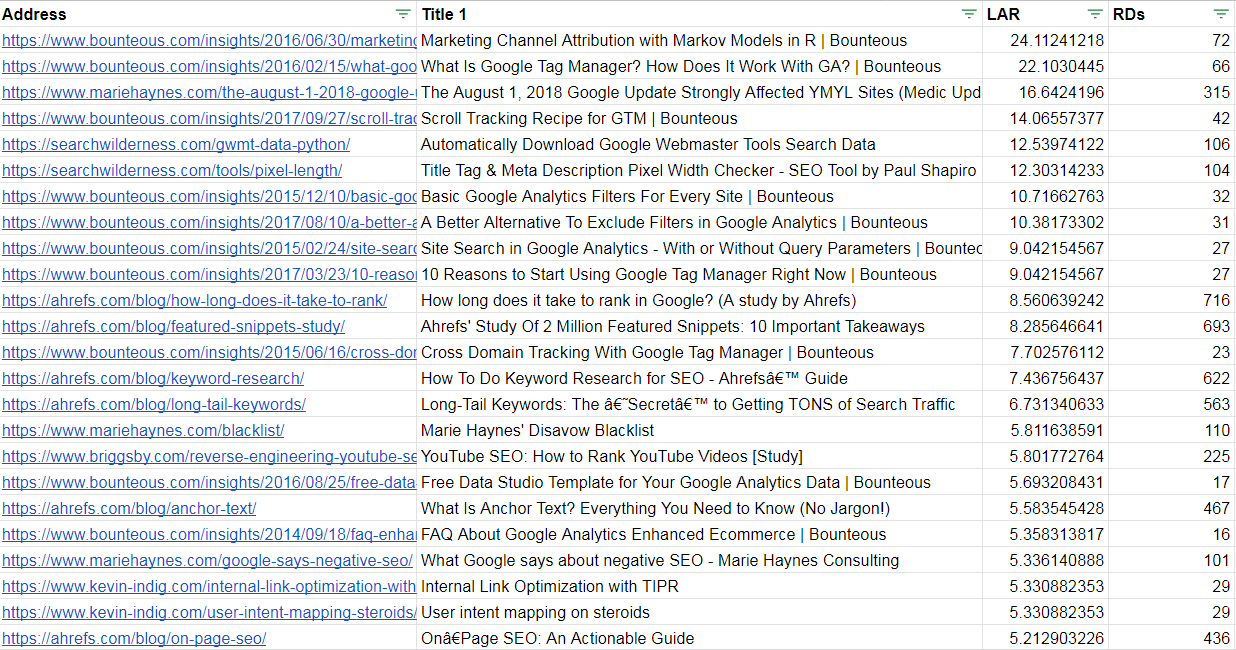
Here’s the new breakdown of the top 50 URLs:
- bounteous.com= 42%;
- ahrefs.com = 28%;
- mariehaynes.com = 10%;
- searchwilderness.com = 8%;
- kevin-indig.com = 6%;
- briggsby.com = 6%.
Every site has at least three URLs in there, so we know we’re seeing everyone’s best stuff.
Ahrefs still owns a large chunk of real estate—we’re not ignoring them, just filtering out the so-so stuff (based on their own site standard).
Tidy as that process may be, it doesn’t scale.
2. Find above-average content for hundreds (or thousands) of sites.
Instead of starting with a handful of sites, maybe you’re starting with a topic. Your export could include hundreds (or thousands) of domains.
It’s impractical to crawl hundreds of sites, but there’s an alternative—a back-of-the-napkin option. It assumes that a post that accounts for a higher percentage of a site’s total referring domains is (probably) a better post.
So, if a post represents 10% of a site’s total referring domains, it’s probably worthy of more of your attention than one that represents 0.001%.
As you might imagine, this assumption helps elevate content on smaller sites while ignoring content that—despite a high absolute number of links—represents a mere drop in the bucket on huge domains.
Here’s what the formula looks like for a back-of-the-napkin LAR (bLAR) calculation:
- bLAR = Links to a post / Links to the domain;
- bLAR = 10 / 100;
- bLAR = 10%.
Is it a perfect method? No. But it’s a much better starting point. Let me show you the same dataset with and without this calculation.
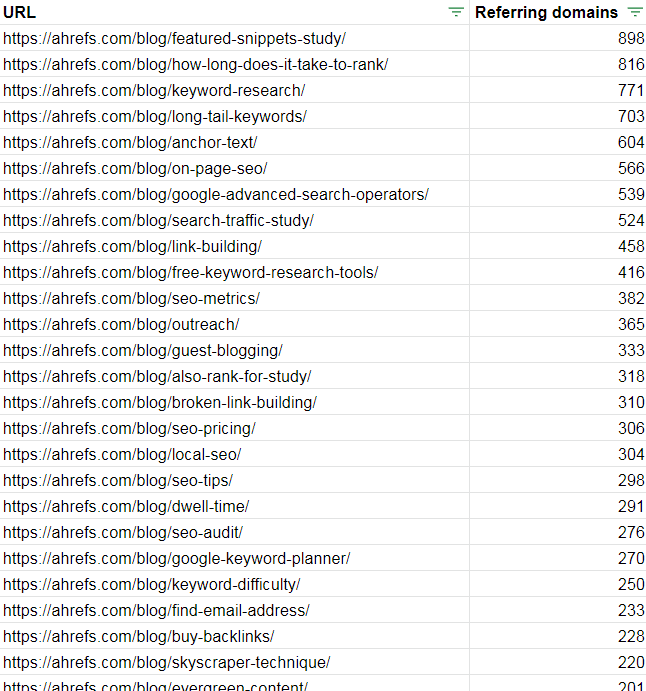
We did this not too long ago for the topic “marketing research.” We were trying to figure out which research topics tended to attract links.
A standard export of most-linked content returns the list below. The average Domain Rating is 86.
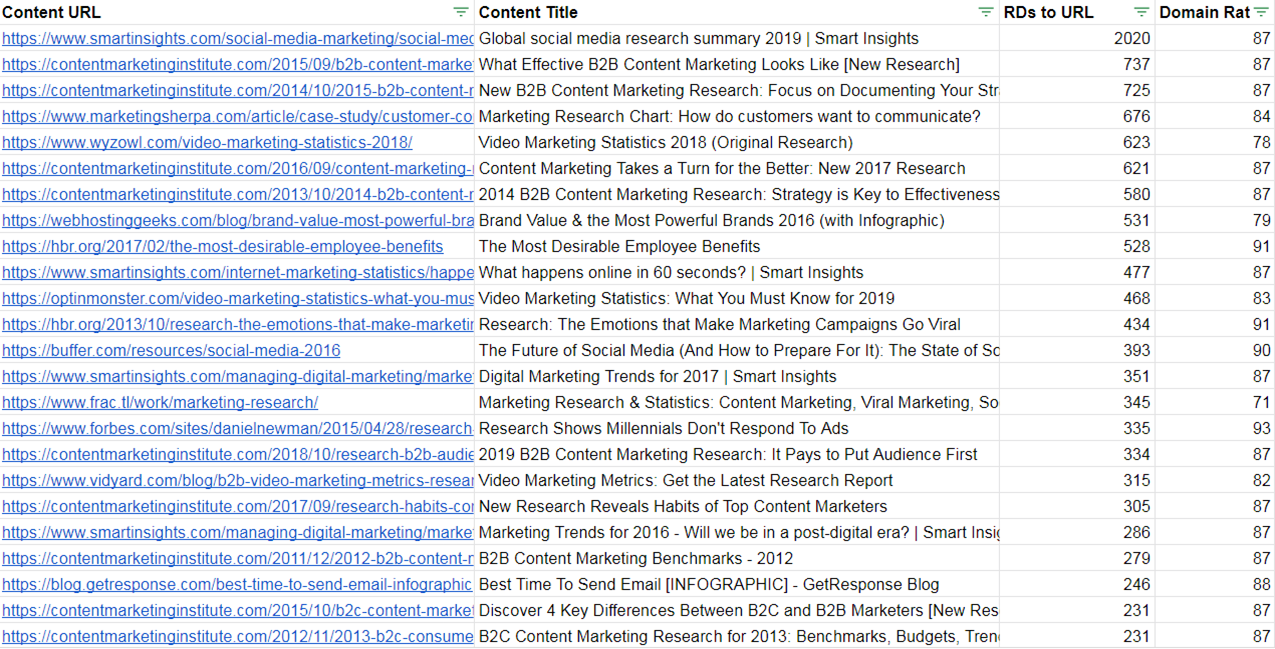
That inherent bias toward large sites also means less domain diversity—only 12 domains are among the top 25 visible above.
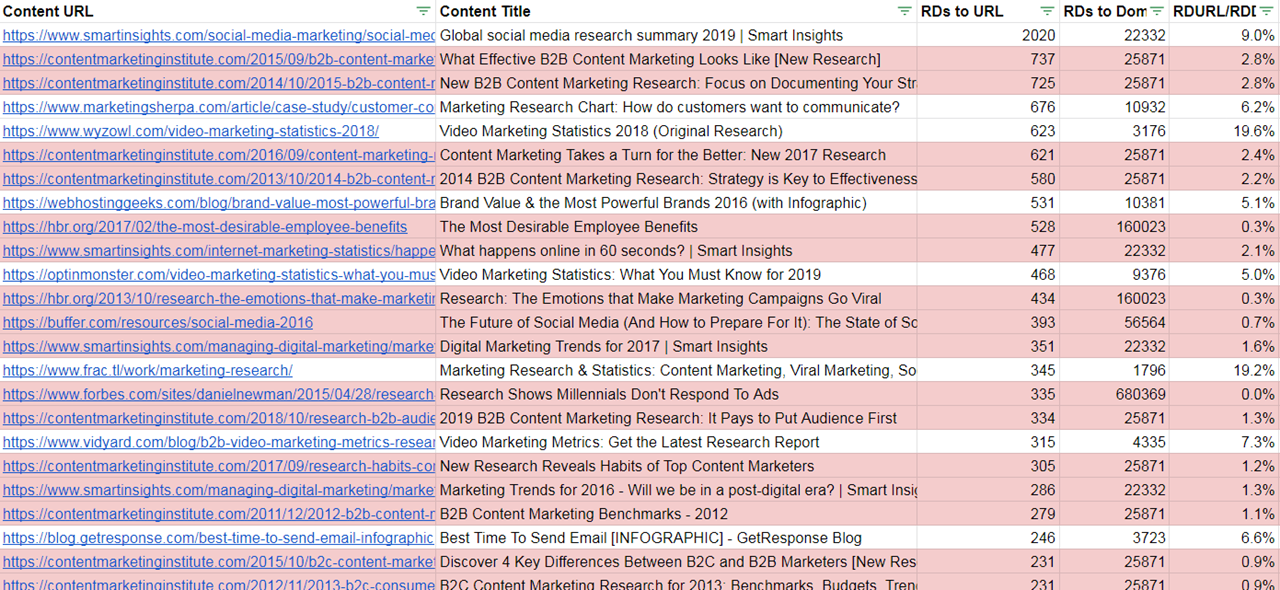
When we add a bLAR calculation, we can see that many of the articles (below, highlighted in red) represent a small percentage of the total links to those domains:
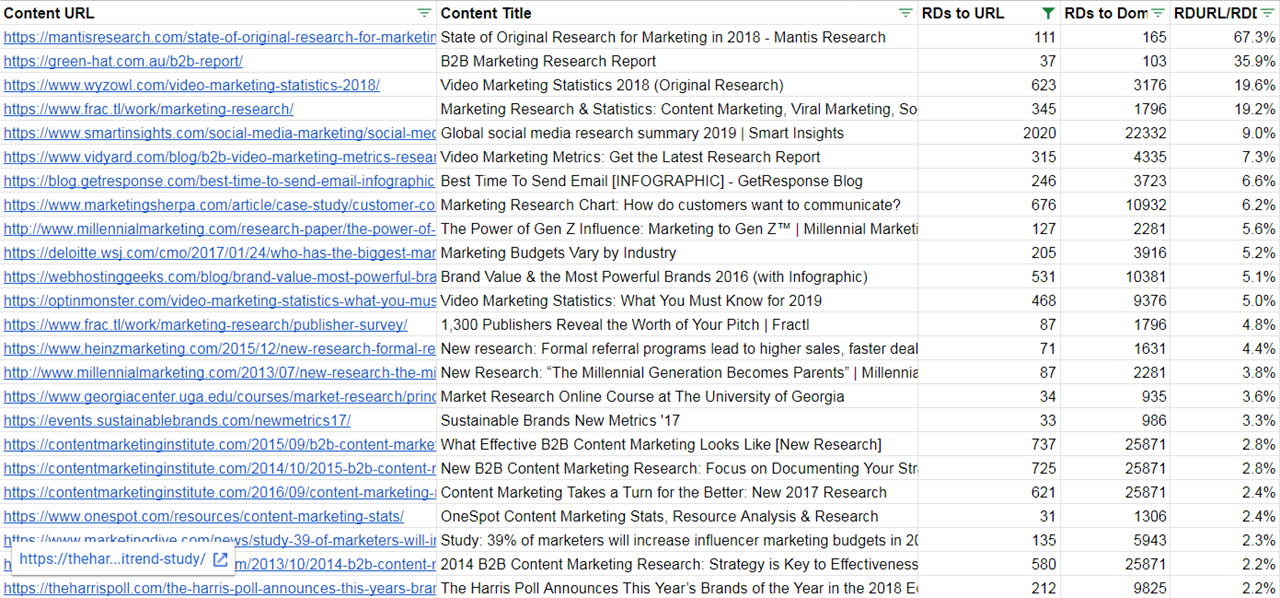
So what happened when we sorted the list by bLAR instead?
Before we reordered the list, we filtered the number of referring domains for a performance baseline of at least 30 referring domains. (You could choose 20 or 60 or 100—whatever makes sense for your site and ambitions.)
Why? For domains with few links, the bLAR method tends to surface articles that have, say, just five links—but those links account for 80% of the site’s total. We don’t care about that content.
Filtered and reordered, our list now includes 21 domains (almost twice as many sites), and the average domain rating has dropped to 78, meaning that the content could succeed for a wider range of websites:
There are a couple of ways to improve the (rather rough) bLAR metric:
- Instead of a domain-wide link count, pull links to the content subdomain or subdirectory (e.g., blog.example.com or example.com/blog/). You have to find those patterns manually, so this scales for up to 30 sites but probably not beyond that.
- Exclude links to sites’ homepages. Use Screaming Frog and the Ahrefs API to pull the link metrics for the homepage of each URL in your list. Then, subtract homepage links from the total link count. That populates the denominator with only non-homepage links, a more representative (albeit still imperfect) sample of links earned by content.
What none of the above methods can tell you is whether those links or shares were an impressive haul for a site at that moment in time.
3. Use moving averages to find content that did well at that point in time.
Here’s what happens if you don’t take time into account.
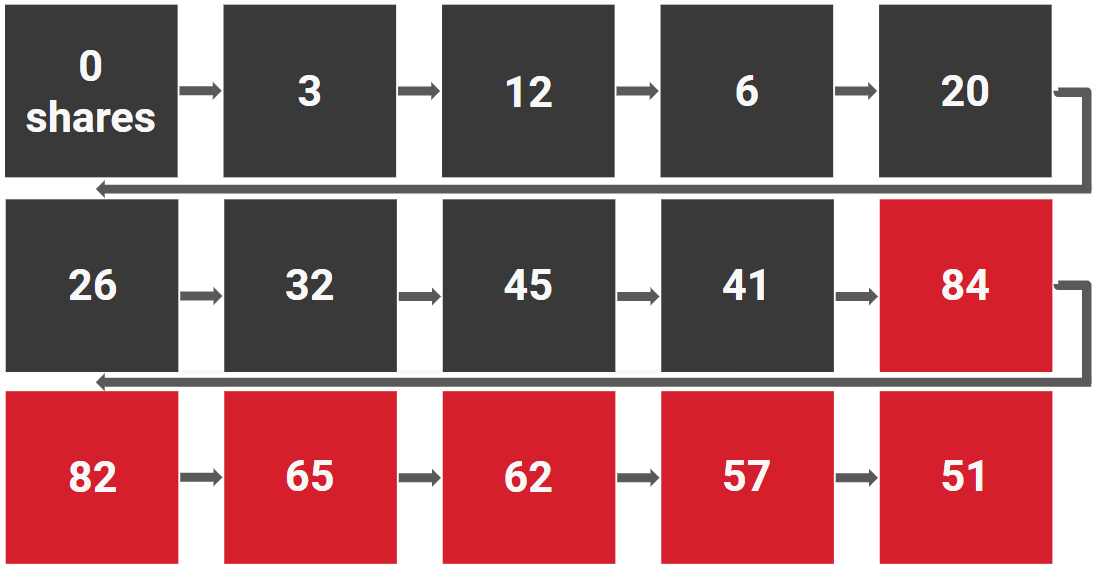
Assume—in this simplified example—that you export social-sharing data for all 15 blog posts from a site. This is what it looks like visualized over time (0, 3, 12, 6, 20, 26, 32…):
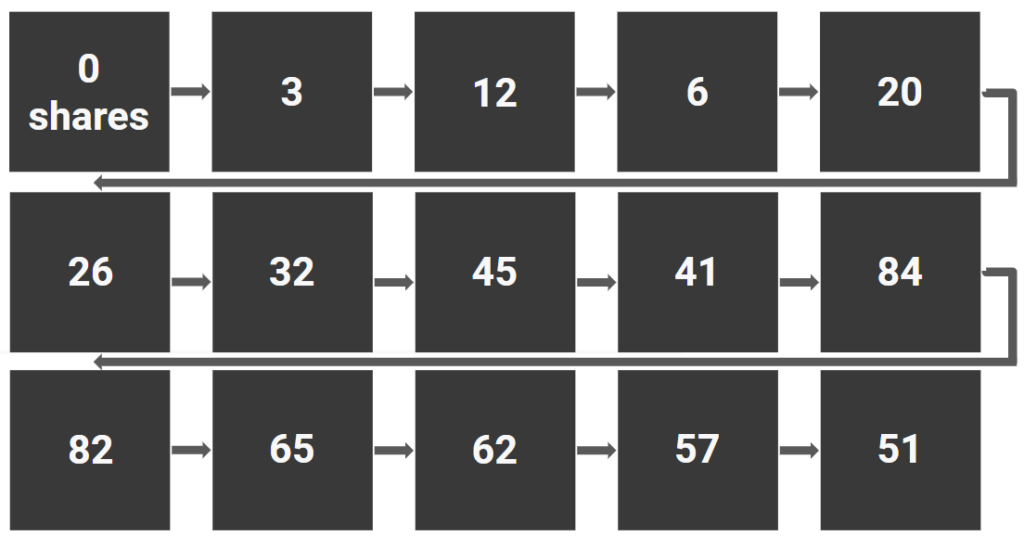
If you look for the most-shared content, you’ll focus your attention on the posts highlighted in red:
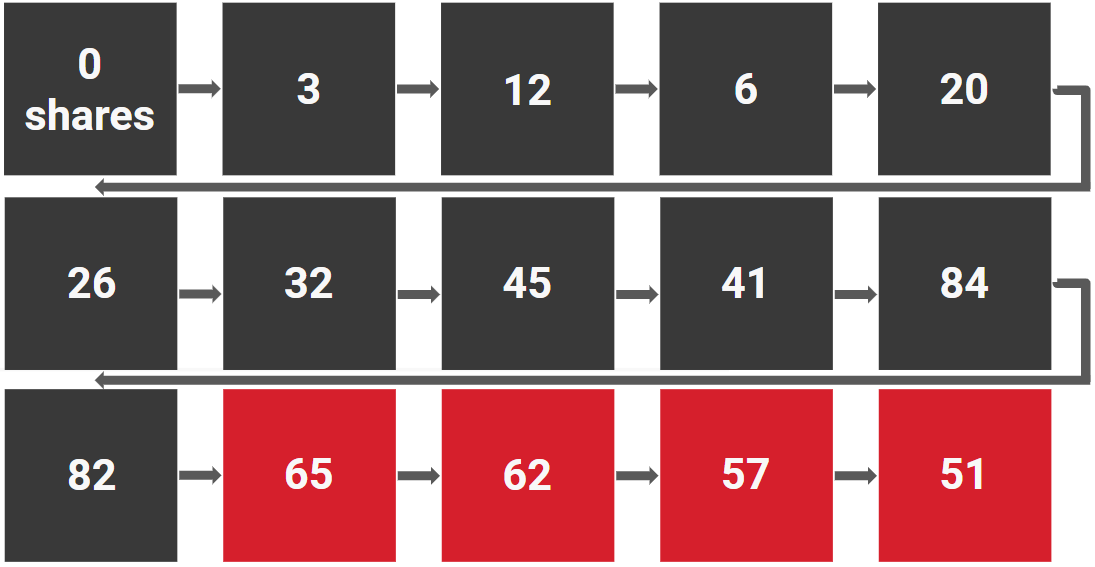
But look at the last four posts. They’re parasites, feeding off earlier success and declining from the peak:
Meanwhile, you’re totally ignoring the posts that, while their absolute numbers are smaller, made the big wins possible—the content that grew the site from nothing to one that could earn 80-something shares:
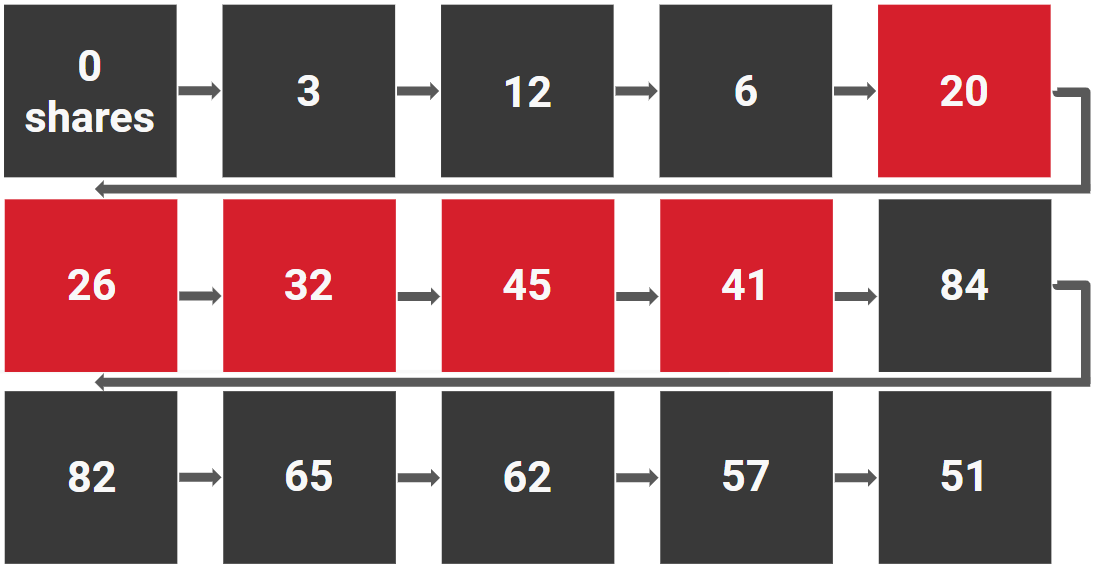
Odds are, the content that helped create a powerful site is far different than what sustains it (or, worse, feeds off it). It’s also likely to be more relevant to you—you want to find the stuff that will build and expand your audience, not maintain the status quo.
The context of time is also vital because powerful sites have powerful distribution networks. A post that could crush it on Reforge today might’ve flopped a couple years ago because they didn’t have the social following (or link profile or email list) to get it in front of people.
A moving average is a simple way to fold in the context of time:
- Pull any metric for a site along with the publish date for each URL.
- Index each URL’s performance against the median* URL performance up to that point in time.
*You can use the median or the average. Often, the median does a better job controlling for outliers. Every site has that one post that earned exponentially more links, shares, comments, etc. If you use the average, you’ll falsely inflate the results for a “typical” post on the site.
In a spreadsheet, if B1 is the number of social shares for the first post, B2 for the second post, and so on, your formula looks like this:
- = B1
- = B2/MEDIAN(B$1)
- = B3/MEDIAN(B$1:B2)
- = B4/MEDIAN(B$1:B3)
- = B5/MEDIAN(B$1:B4)…
Each post compares its performance to the median for all posts that preceded it.
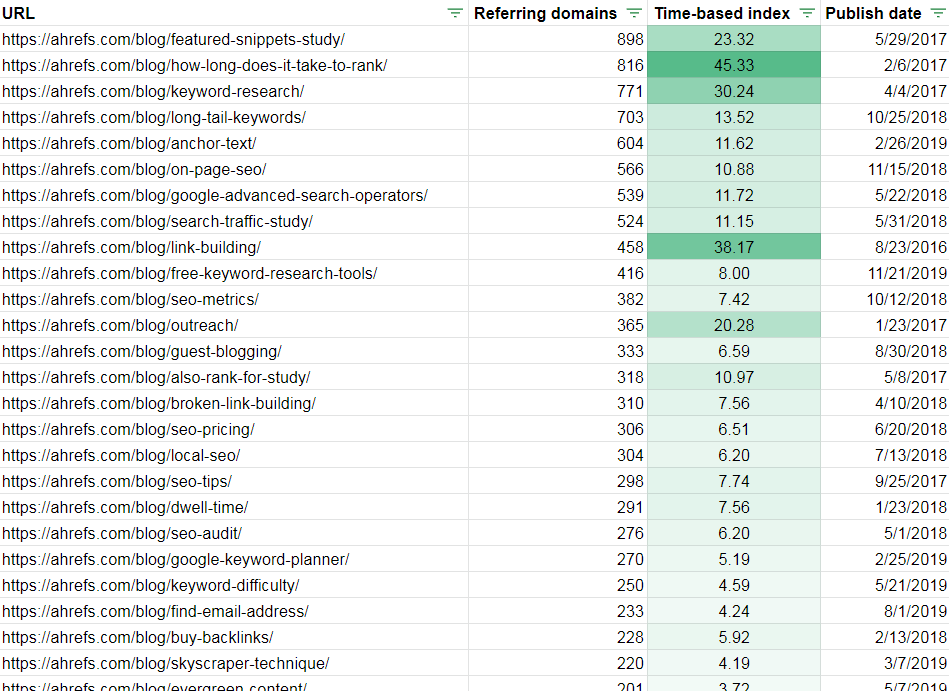
Using referring domains and the Ahrefs blog as an example, the standard export of most-linked content gives you this list of URLs:
When we use the moving average to create a time-based index, however, you can see that some of those most-linked posts vastly outperformed what we might’ve expected based on past performance:
Reorder the list to focus your attention on those overachievers, even if they’re not tops in terms of absolute numbers:
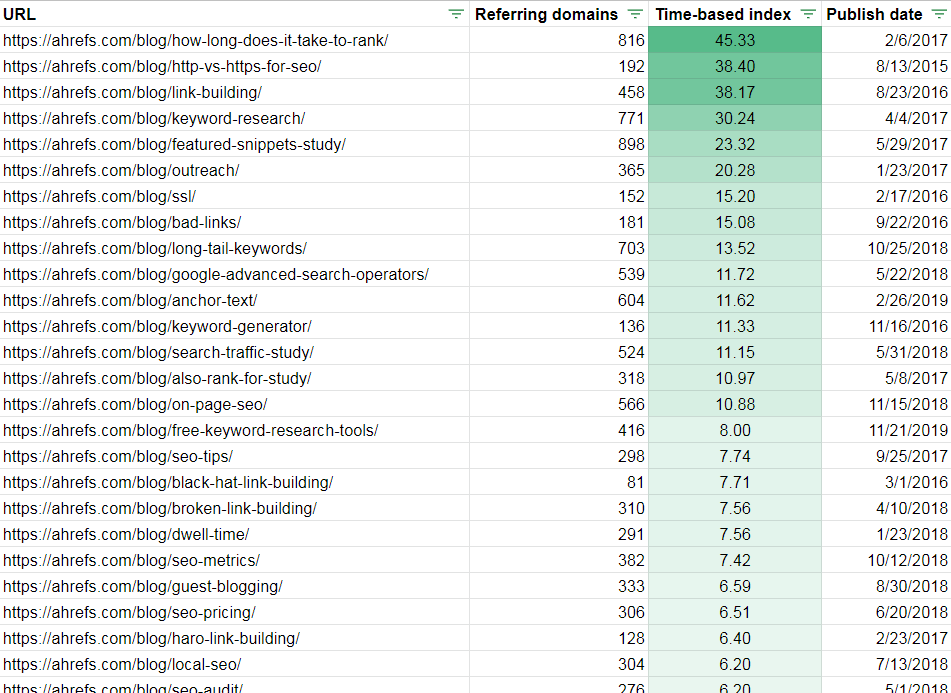
Again, however, we run into a dilemma. Several of the most “surprising” posts, like the one on HTTP vs. HTTPS, probably don’t strike you as must-link content. They seem more like run-of-the-mill, search-targeted posts.
That’s because not all links are created equally, something this last bit of context can help you manage.
4. Distinguish between posts that earned active vs. passive links.
“Passive links” benefit from a rank-and-reap strategy. If you get to the top of search results, you naturally earn links to your content as others search for sources.
But those highly linked posts aren’t instructive for content creation. They tell you more about the search volume for the topic (i.e. higher search volume = more links) than they do about the quality of the article.
You’re better off focusing on content that actively earned links—the stuff that turned heads.
Doing so is simple:
- Export referring domains and organic traffic from Ahrefs (or pull it via Screaming Frog).
- Add a column to divide “Referring domains” by “Organic traffic.”
- Sort by highest to lowest.
The result gives you the number of referring domains per organic visit. (No, the organic traffic data isn’t super accurate; yes, it’s still directional.) The higher the number, the more likely that the links are active links.
Say you want to know what Amazon-related content people just had to link to. If you look only at the typical export of most-linked content, you’ll see plenty of stuff that earned those passive links.
But with the added bit of context from organic traffic, you unearth content that piqued others’ interest—not just the stuff that’s been sitting at the top of a high-volume SERP for years.
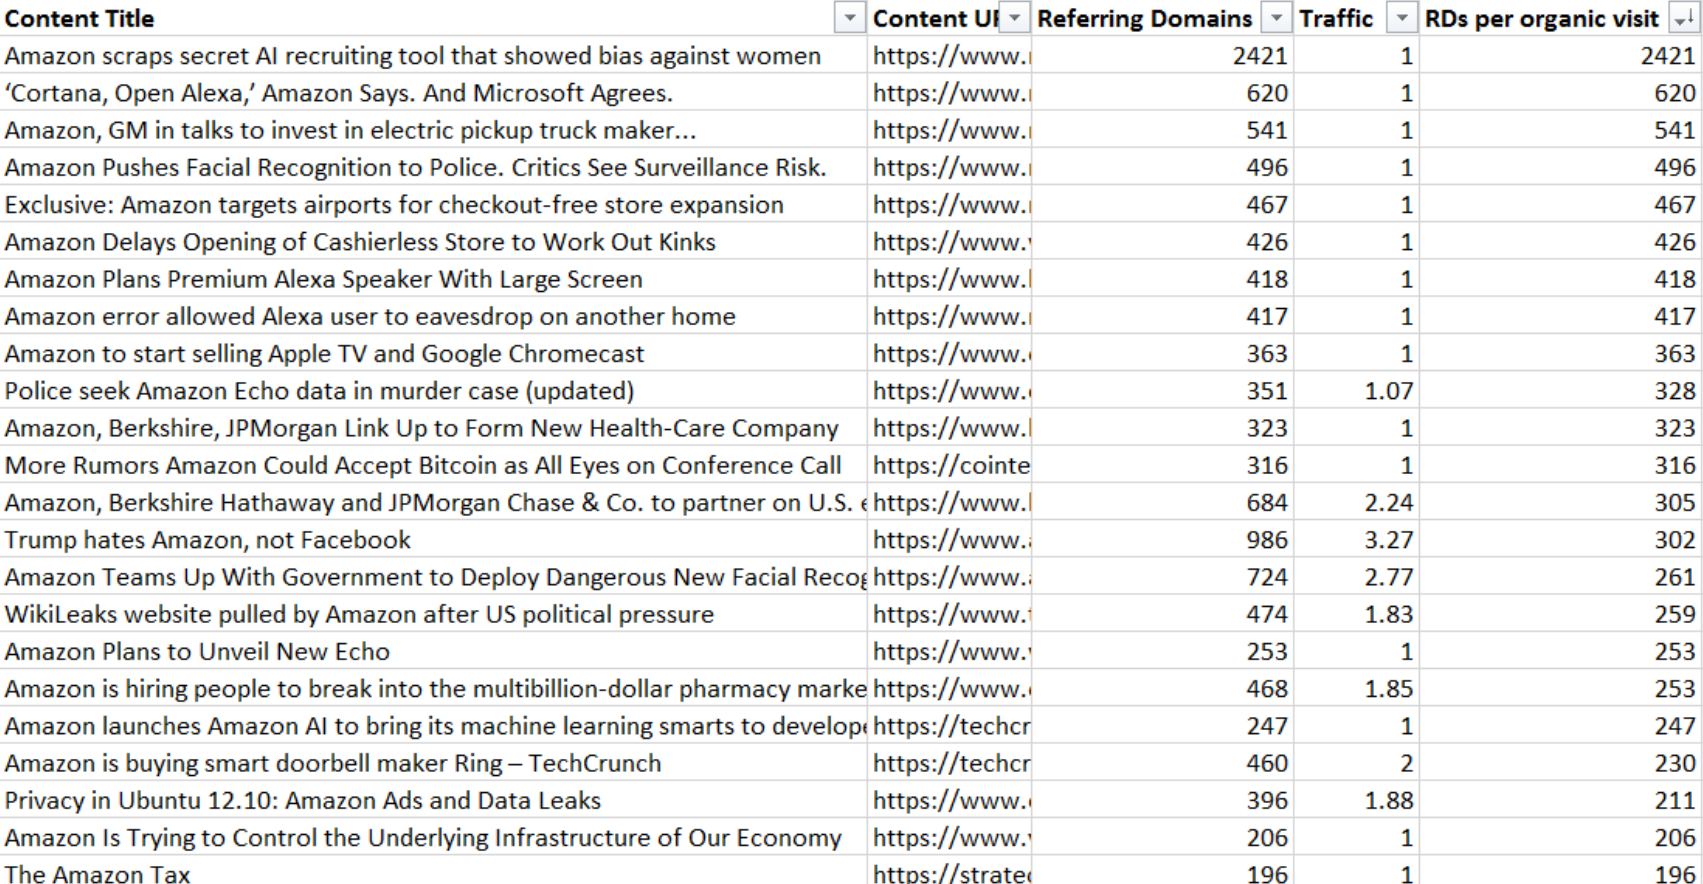
You start to see the themes of link-bait content right away:
- Security concerns about voice speakers;
- Leaks about product releases;
- Amazon’s future plans—and worrisome market dominance.
Those are the themes you should think about if you want to earn active links.
Conclusion
If you’re not controlling for site size, where a site is in its lifecycle, or how it earned links, your content research won’t get you far. You’ll spend your time trying to eke out lessons from mediocre stuff on really big sites…
- …or content that earned links because it targeted a high-volume keyword.
- …or content that earned shares because the site has a huge social following and generous paid budget.
- …or content that earned a deluge of comments from an audience built years ago with vastly different—and superior—content.
The good news is that it’s easy to add a bit of context. The data comes from the same tools you’re already using and requires just an extra column or two in your spreadsheet.
The end result? You focus on the best content from sites of any size, ignore parasitic content published after a site “jumped the shark,” and reveal a dataset that most of your competitors never see.
Related Posts
-
Do you know who is Ira Glass? You better. He's the host and producer of…
-

"Content distribution is probably the hardest part of content marketing..." In this episode of The…
-

Knowing how to measure content marketing ROI, like measuring optimization ROI, is hard. And complicated.…
-

The “classic” idea of content marketing—cranking out SEO-focused articles, ranking for hundreds of keywords, generating visitors,…


This is an amazing piece of advice. But I was wondering, why not just focus on content that has low organic traffic and high number of RDs? This way you would identify content that HAS to be shared and filter it out from search engines.
So you zero in exactly what people want to share.
Isn’t this method simpler, without adding extra column in Excel? the data is provided in Ahrefs already.
We’re talking about the same data. If you want to do it within Ahrefs, go for it, but I don’t think “adding an extra column in Excel” is much work, so I prefer to export and calculate an actual figure. That’s especially useful if you’re trying to compare data between several sites.
Also, it’s possible that something that people “had to share” does drive a lot of organic traffic—a piece of content can be both things. Looking at the ratio gives that content a chance to show up. Simply looking for content with low/no organic traffic does not.