Conversions are mostly about being relevant to your customers. If what you offer and the way you present it is relevant to your visitors they will convert to buying customers.
Then again if you don’t understand who your customer is or worse it’s “everybody” then you have very little change of being successful at it.
So you better know your customers, and know them well. This is where qualitative research comes into play – it enables you to learn who your customers are, what they want, what language they use and more. So it’s safe to say that all this qualitative stuff is important.
Qualitative, Quantitative, Whatever -tative… What’s The Difference?
Before we go any further let’s make sure we’re on the same page.
Quantitative data deals with numbers & absolute measurements, it’s data that can easily be measured.
Mostly in CRO we’re dealing with this kind of data. Your conversion rate, a/b testing results, scroll depth, heat maps etc – they all give you concrete numbers and facts.
Qualitative data at the same time deals with descriptions and not with numbers directly. That makes it harder to analyse as you first must understand the data, then interpret and analyse it.
They are both very valuable, just what you get from each is different.
So in short, quantitative data (numbers) tells us that something is wrong, while qualitative data answers the question WHY it’s wrong. In the rest of this article we’re going to be concentrating on qualitative data, more specifically getting it through qualitative surveys
Seems Like A Lot Of Work, Does This Stuff Really Work?
What do you do when you have a new product coming out, you know the product is good because people who have used say so. You send out email launch campaign to highly targeted list of 30 000 people and only 30 people sign up?
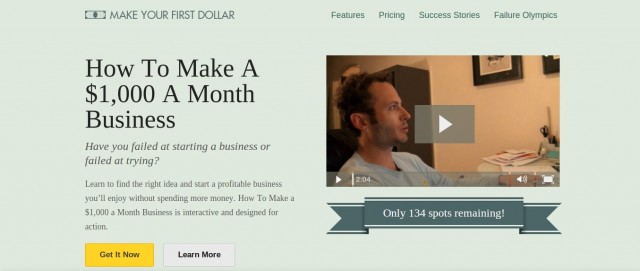
You go and run a qualitative survey on those people who clicked through but didn’t buy the product of course! That is what Noah Kagan did when he launched “How To Make a $1,000 a Month Business.”
The survey had 4 simple questions:
- Were you at least interested in buying? YES or NO
- Be specific about the answer
- What’s holding you back from starting your business?
- Should we make our support sumo do a dance video?
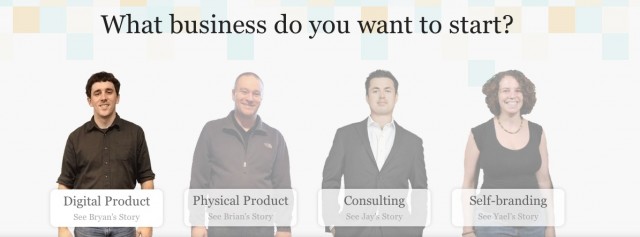
Armed with data and doing analysis on it they completely redesigned the landing page using the customer’s language & “business type” to provide answers to most pressing fears and concerns.
How they addressed this is a direct result of who they surveyed, but more on that later.
Where To Start With Qualitative Surveys?
The goal with any kind of survey is to learn something that you didn’t know before. I see it all the time where the business will “do surveys” but never end up with anything that can actually use.
With qualitative surveys it’s more specific – you’re looking to collect both the negative & positive feedback that can lead to real outcomes in the future.
For example, if you wanted to use qualitative feedback to improve hiring practices, asking someone to rate the “Friendliness of Staff” on a scale of 1-5 wouldn’t tell you much about the personality attributes that lead to a positive customer experience.
Instead, questions like “Was there an employee that made your experience enjoyable?” & “What was it about them that made them stand out?” could reveal top performers as well as favorable personality traits that align with your company values.
Another benefit is that you’ll get insights into how your users are describing you, which in return you can use to refine your value proposition and come up with ways on why you are better and/or more unique than your competitors a.k.a the magic sauce.
Who Should I Survey?
Who you survey will be largely be dependent on the outcome you’re looking for & the customer segments you’ve set up.
If you want to improve your buying process, survey brand new buyers (and the people who didn’t buy). If you want to start a loyalty program to improve customer retention, survey frequent buyers. If you want to start a VIP program for top spenders, survey customers who spend a lot of money with you.
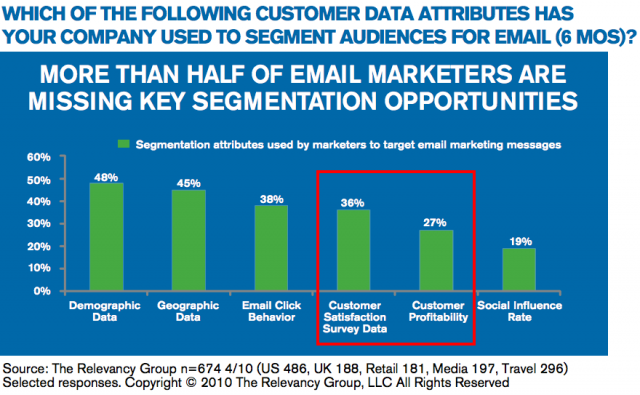
This may seem pretty straight-forward, yet, data from The Relevancy Group’s 2010 survey suggest that the majority of marketers are still primarily focused on Demographic & Geographic customer data.
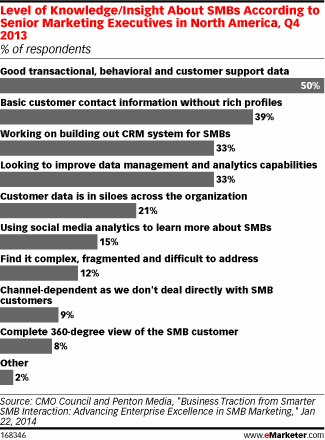
And this isn’t just because this study is 4 years old that segments still aren’t set up properly. Research from the CMO Council & Penton Media in Q4 of 2013 found that only half of the companies surveyed felt they had good transactional, behavioral & customer support data.
Some ideas for customer segments are:
- Big Spenders
- Frequent Buyers
- In-frequent Buyers
- Longtime Customers
- Registered Non-Buyers
- Demographic
- Interests
- On-Site Browsing History
There are several articles out there on segmenting your customer data, you can find some of my favorites here, here & here.
Low Hanging Fruit – People Who Opened, Clicked, But Didn’t Buy
screenshot of Monthly1k.com
Remember how Noah asked the people who had clicked through but had not purchased the product?
Using his own qualitative survey, he learned that the reason people didn’t buy was because they were:
- Afraid
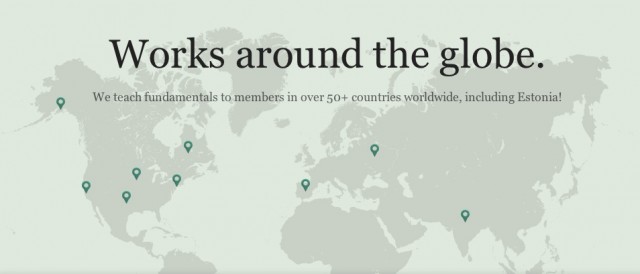
- Didn’t know if it would work in their country
- Were unsure if the program would work for them
- Had failed before & didn’t know how this time would be different
Afraid:
Works in my country:
Works for me:
Failed before, what’s different:
While Noah didn’t disclose the exact lift in conversions or revenue this process brought about, he did say it “literally changed the product overnight.”
The moral of the story is, don’t disregard people who don’t buy right away. By opening, clicking & not buying, they’ve shown interest, so go and figure out what is stopping them from buying.
… And How Many People Should You Survey?
We aim for a total between 100 – 200 responses for all our customer surveys. If we get more than a 200 responders, we randomly choose 200 and analyse those.
Once we get over 200 responses the answers tend to repeat and thus don’t offer any new insights. If we get less than 100 then some especially loud and negative voices can skew the results.
Then again if you only have 100 people who have recently bought from you, you have to make do with you have. 20 is still better than nothing, you just have to be more careful with your analyses.
Getting People To Respond To Surveys
From our experience, the best way to get your customers to take action and fill out the survey is to offer some kind of an reward. It can be a gift card, coupon code, free shipping etc.
Tommy pointed out to me that while you could choose a prize arbitrarily based on the size of your company or the amount of people you expect to respond- the more data-driven approach would be to offer a prize that somehow reflects the lifetime value of the customer segment you’re trying to acquire or retain.
In the ThinkGeek example above, they offered Tommy a chance at a $500 gift certificate in exchange for feedback.
Out of context, that’s a lot of money, but according to Tommy, he’s spent at least 4-5 times that in the last year. If ThinkGeek were to use that qualitative data to acquire (or develop) just 4 customers like Tommy, they’d make an extra $10k/ year.
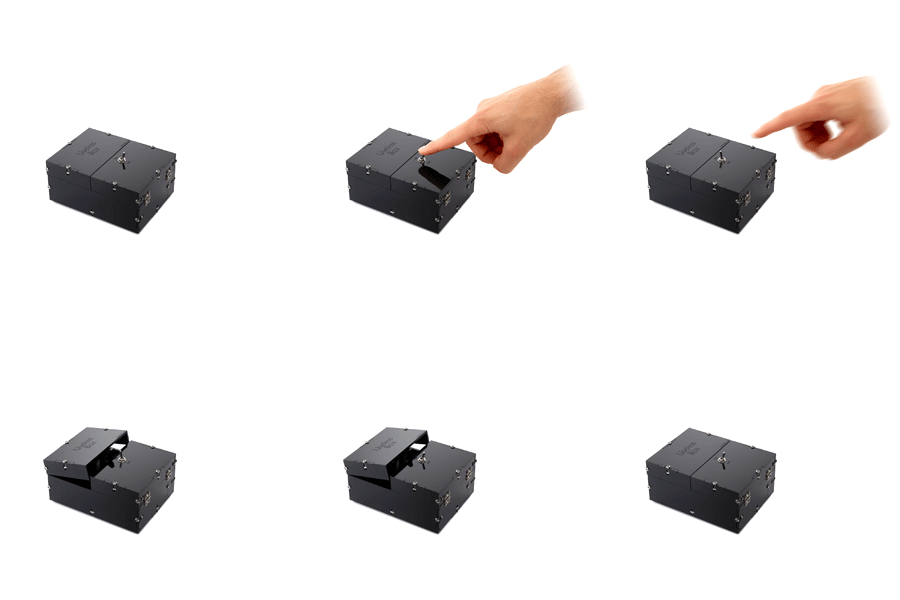
That’s A LOT of Useless Box Kits:
But Won’t People Only Respond Because Of The Gift & Skew The Results?
Yes. That risk is always there, but in our experience it’s well worth it – the advantages from having this data far outweigh potential risks. Plus, we have yet to see a case where “clever” people are skewing results in a major way.
There are always some smart asses, but in reality if we take 100 responders then the most we have seen is around 5 people who only do it for the gift. And they didn’t really skew any results as they simply wrote one word answers to all the questions and so were excluded in the analysing phase.
Tips And Tricks
When sending invitations for the survey, keep the email as short and simple as possible. Mention how long approximately the survey will take. (alternatively use number of questions – “It’s only 5 short questions”)
Use fairly short deadlines (up to a week) and send reminder emails before the deadline. The reality is that the majority (around 80% in our testing) of answers will come within the first 24 hours of sending the email.
The Email Template We Use
We use a generic template when sending out email surveys which we tweak for every client based on their needs.
Here’s the template:
***START OF LETTER***
Hey guys,
We’re constantly trying to provide a better service for you – and we
need your help. Help us understand your perspectives.
Please take 5 minutes to fill out this quick survey: http://link
It’s only a handful of questions, but will really help us learn.
Please fill it out in the next 2-3 days.
Again, this is the link: http://link
We know your time is valuable, so every respondent gets rewarded.
You can choose between $25 amazon gift card, $25 starbucks gift
card, $25 donation to united way or free shipping on your next
order. We’ll contact you after you fill out the response.
Thanks so much.
*** END OF LETTER ***
You can use the same or use this as a basis for your own creation – have fun.
Specific Questions You Could Ask
What you want to achieve with your questions is try and get into the heads of your customers and understand how they think, why they buy, how they buy, any frictions points etc.
For that we typically ask the following questions to get the best insight:
- What can you tell us about yourself? -> to spot trends of where the majority of our customers come from. If B2B try to get information about industry and position in the company. If demographics matter, ask- If they don’t, don’t bother.
- What are you using [product] for? -> What problem does it solve for the customer?
- How is your life better thanks to it? -> end benefit of your product in the words of your customers, great for value proposition.
- What made you sign-up/buy our product? -> what’s working for you in your current website + advantages.
- Did you consider any alternatives to our product / buying from us? If so, which ones / how many? -> how much they comparison shop?Critical into to make a better case of why buy from you.
- Which doubts and hesitations did you have before completing the purchase? Identify main sources of friction, and address them (or fix them if they’re usability problems).
- What’s the one thing that nearly stopped you from buying from us? This is about identifying friction again, coming from a different angle.
- Which questions did you have, but couldn’t find answers to on the website? 50% of the purchases are not completed due to insufficient information. This helps you identify some of the missing information your customers want.
- What was your biggest challenge, frustration or problem in finding the right product? This helps you learn about the way people would like to buy.
- Anything else you would like to tell us? Leave room for feedback you don’t know to ask.
Don’t take this as gospel, if you have questions that are specific to your business than include them.
And make sure that whatever you are asking, that the information is actionable – don’t ask something just because you’re curious.
Analyzing Survey Responses
This is where the fun begins! What happens next is all about manual labor. The process we use is the following:
- We go through the data to get an initial sense of what’s going on
- We “code” the data – to organize it into some kind of readable and manageable form
- Interpret the data
- Write a summary report about your findings
Depending on how many responses you have, it can take anything from a couple of hours to a couple of days – be prepared for that.
Step 1 – Going Through Data
In this step you go in and look at responses question by question. What you’re trying to do is to identify trends and patterns that you can write down to review later.
Beware of your biases – it’s human to look at the data and spot a view trends right away (at least something that looks like a trend), and then start looking for info that “proves” that trend while leaving out the rest.
This will happen. If needed, take a break and come back later with a clear head.
Step 2 – Coding The Data
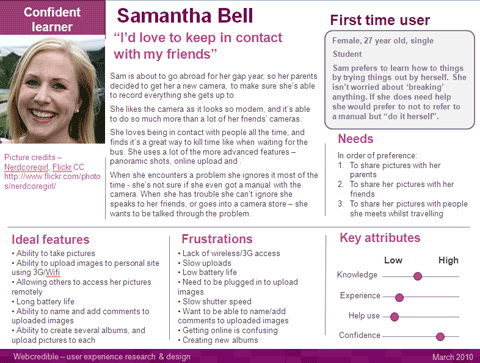
Once you have gone through the data, you should have an idea forming in your head already on who the people who buy from this side generally are. You can attach code names to those people.
So let’s say our client is WordPress theme shop. By reading through the data we’ll get an initial set of code names for responders:
- A blogger who is starting out and looking for his/her first WP theme (Blogger)
- Professional web designers purchasing themes for clients website (Designer)
- Small business looking to upgrade their current site (Small-Biz)
As you go through the answers you can create more codes and modify them – this will give you a much better overview of who you’re dealing with. Plus it gives you an idea of how to organize sales copy on the sales page -> the biggest group first etc.
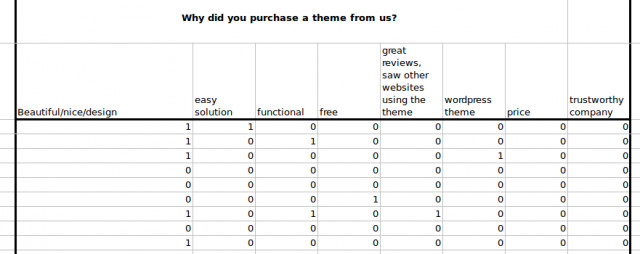
Another thing is to codify the answers, so if we’re WP theme shop then the question of “Why did you purchase a theme from us” answers could be codified like this:
And then it’s just a matter of putting either a “1” or “0” in the column and move on. The codes you use depend solely on the answers that responders give you, that’s why you need the initial reading to grasp what you’re dealing with.
Step 3 – Interpret The Data
What patterns are you seeing? Write those down. By now you have enough to come up with hypothetical personas that can be used to further target your messaging.
When Meg Hayne, the president of clothing brand Free People was asked about their ideal customer, she answered:
“She is independent yet loves being with her friends, her family, and her mate. She travels every spring to festivals, Coachella and Wanderlust being her favorite. She runs and practices yoga to stay fit and balanced. She is influenced by fashion but yet seeks inspiration from all over the world to put together a look that is her own. She is a mix of sweet, cool, and boho and everything in between. We target age 26…”
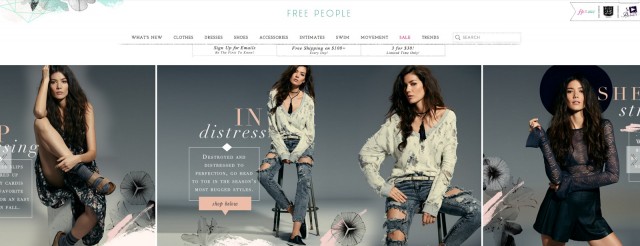
Now could this all be made up? Sure. But where Free People, and parent company Urban Outfitters are more lifestyle brands than fashion retailers, guessing about how their ideal customers leaves more room for error which would result in total brand messaging that completely misses the mark.
A glimpse at the home-page & it’s easy to see how their model reflects the ideals of their core customer:
By coding each individual question in step 2, you can easily put together an amalgamation of your ideal customer, or the problem that is holding them back from buying.
In this case study about web app Photoshelter, their customer surveys found that offering the “limited” version of the app for free was preventing the company from doubling sales.
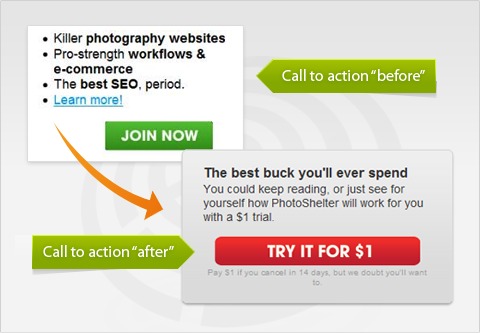
“Our surveys revealed that PhotoShelter’s visitors were anxious to try out the product. PhotoShelter already had a free version, but it had limited features, and an analysis of the business data revealed that it wasn’t particularly effective at persuading users to upgrade to the paid versions.”
In response, they tested offering users a $1 trial offer to try the full app for 14 days:
This, along with surveying other segments & a handful of other tests ultimately lead to doubling the revenue for Photoshelter.
When analyzed thoroughly, these surveys will help you to test what matters most, prioritize issues, add features, and discover what your customers and prospects care about the most.
Step 4 – Summary Report
Summary report is where you bring all the learnings you had together into a readable format with all the personas you did, prioritized issues and general findings and patterns:
Once you have this report ready, you go on into taking that data and the issues you found from that and putting them against findings from your own user testing, heatmaps, exit-surveys and the like. This is quite in-depth, and we will be covering this in future articles.
So now we have we shown you why qualitative survey’s are needed, how to run them, what to ask and how to analyze it all. But what we haven’t done is taken a look at software options that actually make it all possible, so let’s do that now.
Tools To Use For Conducting Surveys
When it comes to tools, then the first thing that comes to mind is Google Drive Forms – they are simple and free but look, well, plain and simple.
In addition we use Typeform, which has also got an very capable free version. With that it’s super easy to create the most beautiful surveys you have ever seen.
http://youtu.be/MkJSROtq_Qs
As an added benefit their surveys are responsive and are usable with all kind of different devices.
You might think that that is not important, take a look here:
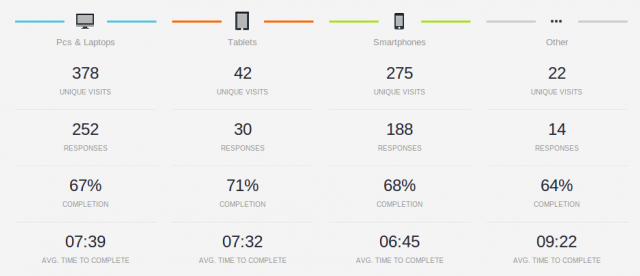
A large percentage of responses came from smartphones. The above data is from one of our clients through Typeform – it gives you way more specific data than others which can be important. Another good one is SurveyGizmo, give them a try.
Conclusion
Customer surveys, when done well, aren’t just an exercise for businesses to pay lip-service to how much they “care about their customer” or to pat themselves on the back about how well they’re doing.
Instead, they are a way of having an open dialog with prospects, existing customers & former customers that can help you to troubleshoot real issues & unlock your companies growth.











Excellent . I love everything about qualitative data and understanding people.
I’d love to see more case studies of how you used qualitative data to come up with test hypothesis to improve copy and user experience.
Thanks
Yassin
Hey Yassin,
A good deal of the case studies we cite on the blog all start with some form of this kind of qualitative research.
We tried to include more, but most of what’s out there in terms of case studies start with “in our initial research” and gloss over what the research actually is. My guess is, that is for competitive purposes.
We ran into a similar issue with the Customer Lifetime Value article a while back, where nobody was actually sharing what their CLV values were, while as a publisher that was upsetting, when I realized that them publishing that data would mean that a competitor could just outspend to acquire a customer.
Anyways, just know that when a case study says “in our research”, most of the time, they’re talking about a process similar to this :-)
As a SurveyMonkey, I love seeing posts like this. Do more surveys ;)
In all non-spammy seriousness, I wanted to call out that there are also times to use surveys quantitatively. This is an awesome use case you’ve presented–and it’s a quick and inexpensive way really know what your customers are thinking. But when you measure something like your NPS score, you’re operating quantitatively to get at the WHAT rather than the WHY. Depending on what you’re trying to achieve, there’s no right or wrong way to do it. I would call out, though, that if you’re using surveys for quantitative feedback, you would probably want to pay more attention to your sample size. In this case, getting the gist of what people are saying may not be as important as feeling secure in the significance of the results.
Survey on!
I would love to do some surveys for our website. However, our budget constraint limits our ability to do so. Can you give me a good example on how to do these surveys with a limited budget?
Thanks!
Google Docs is 100% free, and works great.
Another awesome post from CXL. We shared it in our Weekly Reload here: http://digitaltriggers.io/friday-reload-9
I’m curious.. have you had any experience asking similar questions to surveys via the phone?
Hey thanks for the mention.
With my own personal projects I’ve conducted these kinds of surveys over the phone, sure, but whenever possible, I try to do them over Skype or G+ hangout so I can
1.) see the other person
2.) record them for playback
3.) read their body language & get a sense of their personal style.
For me, that last one is paramount. Body language is a whole extra data set & when you know how to read it, can tell you a lot about a person. Same goes with personal style too. If all of my users had hipster beards, and that Seattle haircut, that tells me so much more than I would get over the phone.
It may not be entirely important at right away, but could come in handy at some point.
Thanks for a great post. We’re launching something that’s not getting as many registrations as expected despite a good prospects list. This is useful in encouraging the team to realise that more awareness of the launch may not be the issue and we should use a qualitative survey to find out where the hurdles are.
There are a lot of things wrapped up in that though.
What were those expectations based in exactly?
How do you qualify a “good” prospect list?
Have you nailed the value proposition?
How much traffic is coming to the page overall?
A qualitative survey is good, of course, but is typically not really in the “launch” phase. Perhaps a “what made it so you wanted to buy” question upon sign-up, and “what hesitations did you have about buying” would be good to help get you on the right track though.
Thanks, as a first time market research desinger, I learned a lot. thx!