

A/B testing is fun. With so many easy-to-use tools, anyone can—and should—do it. However, there’s more to it than just setting up a test. Tons of companies are wasting their time and money.
Here are the 12 A/B test mistakes I see people make again and again.
Are you guilty of making these errors? Read on to find out.
Table of contents
- 1. Calling A/B tests early
- 2. Not running tests for full weeks
- 3. Doing A/B tests without enough traffic (or conversions)
- 4. Not basing tests on a hypothesis
- 5. Not sending test data to Google Analytics
- 6. Wasting time and traffic on stupid tests
- 7. Giving up after the first test fails
- 8. Failing to understand false positives
- 9. Running multiple tests at the same time on overlapping traffic
- 10. Ignoring small gains
- 11. Not running tests all the time
- 12. Not being aware of validity threats
1. Calling A/B tests early
Statistical significance is the best evidence that Version A is actually better than Version B—if the sample size is large enough. Fifty percent statistical significance is a coin toss. If you’re calling tests at 50%, you should change your profession. And no, 75% statistical confidence is not good enough either.
Any seasoned tester has had plenty of experiences in which a “winning” variation at 80% confidence ends up losing badly after getting pushed live to a site and exposed to more traffic.
What about 90%? That’s pretty good, right? Nope. Not good enough. You’re performing a science experiment. Yes, you want it to be true. You want that 90% to win, but getting the truth is more important than declaring a winner.
Truth > “winning”
As an optimizer, your job is to figure out the truth. You have to put your ego aside. It’s human to get attached to your hypothesis or design treatment, and it can hurt when your best hypotheses fail to be significantly different. Been there, done that. Truth above all, or it all loses meaning.
Here’s a common scenario, even for companies that test a lot: They run one test after another for 12 months, declare a bunch of winners, and roll them out. A year later, the conversion rate of their site is the same as it was when they started. Happens all the damn time.
Why? Because tests are called too early and/or sample sizes are too small. Here’s a longer explanation for when to stop an A/B test, but in a nutshell you need to meet three criteria before you can declare a test done:
- Sufficient sample size. We have enough data to make a call. You need to pre-calculate the sample size with an A/B test sample size calculator.
- Multiple sales cycles (2–4 weeks). If you stop the test within a few days (even after reaching the required sample size), you’re taking a convenient sample, not a representative sample.
- Statistical significance of at least 95% (p-value of 0.05 or less). Note: The p-value does not tell us the probability that B is better than A. Learn all about p-values here.
Here’s an old example to illustrate my point. Two days after starting a test, these were the results:
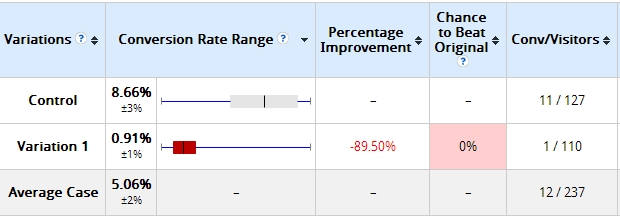
The variation I built was losing badly—by more than 89% (with no overlap in the margin of error). Some tools would already call it and say statistical significance was 100%. The software I used said Variation 1 had a 0% chance to beat the control. My client was ready to call it quits.
However, since the sample size was too small (just over 100 visits per variation), I persisted. This is what the results looked like 10 days later:
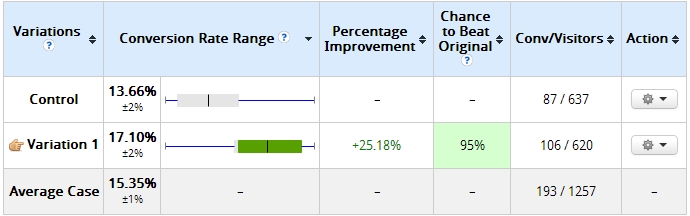
That’s right, the variation that had a “0%” chance of beating control was now winning with 95% confidence.
Watch out for A/B testing tools that “call it early.” Always double check the numbers. The worst thing you can do is have confidence in inaccurate data. You’ll lose money and may waste months of work.
How big of a sample size do you need?
You don’t want to make conclusions based on a small sample size. A good ballpark is to aim for at least 350–400 conversions per variation.
It can be less in certain circumstances—like when the discrepancy between the control and treatment is very large—but magic numbers don’t exist. Don’t get stuck with a number. This is science, not magic.
You must calculate the necessary sample size ahead of time using sample size calculators like this or similar ones.
What if confidence is still below 95%?
Once you’ve hit the necessary sample size and tested for a full business cycle (or two), it means that there’s no significant difference between the variations.
Check the test results across segments to see if significance was achieved a particular segment. Great insights lie in segments, but you also need enough sample size for each segment.
In any case, you’ll need to improve your hypothesis and run a new test.
2. Not running tests for full weeks
Let’s say you have a high-traffic site. You achieve 98% confidence and 350 conversions per variation in three days. Is the test done? Nope.
We need to rule out seasonality and test for full weeks. Did you start the test on Monday? Then you need to end it on a Monday as well. Why? Because your conversion rate can vary greatly depending on the day of the week.
If you don’t test a full week at a time, you’re skewing your results. Run a “conversions per day of the week” report on your site to see how much fluctuation there is.
Here’s an example:
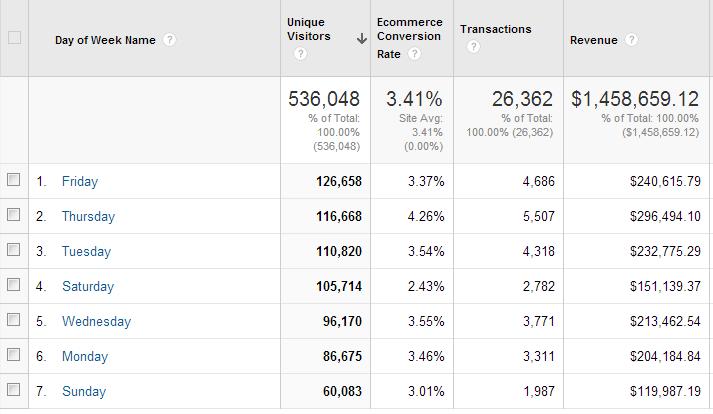
What do you see here? Thursdays make 2X more money than Saturdays and Sundays, and the conversion rate on Thursdays is almost 2X better than on a Saturday.
If we didn’t test for full weeks, the results would be inaccurate. You must run tests for seven days at a time. If confidence isn’t achieved within the first seven days, run it another seven days. If it’s not achieved with 14 days, run it until day 21.
Of course, you need to run your tests for a minimum of two weeks anyway. (My personal minimum is four weeks, since two weeks is often inaccurate.) Then, apply the seven-day rule if you need to extend it.
The only time you can break this rule is when your historical data says—with confidence—that the conversion rate is the same every single day. But, even then, it’s better to test one full week at a time.
Pay attention to external factors
Is it Christmas? Your winning test during the holidays might not be a winner in January. If you have tests that win during shopping seasons like Christmas, you definitely want to run repeat tests after shopping season ends.
Are you doing a lot of TV advertising or running other massive campaigns? That may skew your results, too. You need to be aware of what your company is doing. External factors definitely affect your test results. When in doubt, run a follow-up test.
3. Doing A/B tests without enough traffic (or conversions)
If you get one or two sales per month and run a test where B converts 15% better than A, how would you know? Nothing changes!
I love A/B split testing as much as the next guy, but it’s not something you should use for conversion optimization if you have very little traffic. The reason is that even if version B is much better, it might take months to achieve statistical significance.
If your test took 5 months to run—and wasn’t a winner—you wasted a lot of money. Instead, you should go for massive, radical changes. Just switch to B. No testing, just switch—and watch your bank account.
The idea here is that you’re going for massive lifts, like 50% or 100%. You should notice that kind of impact on your bank account (or in the number of incoming leads) right away. Time is money. Don’t waste it waiting for a test result that will take months.
4. Not basing tests on a hypothesis
I like spaghetti. But spaghetti testing—throwing it against the wall to see if it sticks? Not so much. Testing random ideas comes at a huge expense. You’re wasting precious time and traffic. Never do that. You need to have a hypothesis. What’s a hypothesis?
A hypothesis is a proposed statement made on the basis of limited evidence that can be proved or disproved and is used as a starting point for further investigation.
This shouldn’t be a “spaghetti hypothesis” either (i.e. crafting a random statement). You need proper conversion research to discover where the problems lie, then come up with a hypothesis to overcome them.
If you test A vs. B without a clear hypothesis, and B wins by 15%, that’s nice, but what have you learned? Nothing. We want to learn about our audience. That helps us improve our customer theory and come up with even better tests.
5. Not sending test data to Google Analytics
Averages lie. Always remember that. If A beats B by 10%, that’s not the full picture. You need to segment the test data. Many testing tools have built-in segmentation of results, but it’s still no match for what you can do in Google Analytics.
With Custom Dimensions or Events, you can send your test data to Google Analytics and segment it any way you like. You can run Advanced Segments and Custom Reports on it. It’s super useful, and it’s how you actually learn from A/B tests (including losing and no-difference tests).
Bottom line: always send your test data to Google Analytics. And segment the crap out of the results. Here’s a post on how to do it.
6. Wasting time and traffic on stupid tests
So you’re testing colors, huh? Stop.
There is no best color. It’s always about visual hierarchy. Sure, you can find tests online where somebody found gains via testing colors, but they’re all no-brainers. Don’t waste time on testing no-brainers; just implement.
You don’t have enough traffic to test everything. Nobody does. Use your traffic on high-impact stuff. Test data-driven hypotheses.
7. Giving up after the first test fails
You set up a test, and it failed to produce a lift. Oh well. Let’s try running tests on another page?
Not so fast! Most first tests fail. It’s true. I know you’re impatient, so am I, but the truth is that iterative testing is where it’s at. You run a test, learn from it, and improve your customer theory and hypotheses. Run a follow-up test, learn from it, and improve your hypotheses. Run a follow-up test, and so on.
Here’s a case study where it took six tests (on the same page) to achieve a lift we were happy with. That’s what real-life testing is like. People who approve testing budgets—your bosses, your clients—need to know this.
If the expectation is that the first test will knock it out of the ballpark, money will get wasted, and people will get fired. It doesn’t have to be that way. It can be lots of money for everyone instead. Just run iterative tests. That’s where the money is.
8. Failing to understand false positives
Statistical significance is not the only thing to pay attention to. You need to understand false positives, too. Impatient testers want to skip A/B testing and move on to A/B/C/D/E/F/G/H testing. Yeah, now we’re talking!
Why stop there? Google tested 41 shades of blue! But that’s not a good idea. The more variations you test, the higher the chance of a false positive. In the case of 41 shades of blue, even at a 95% confidence level, the chance of a false positive is 88%.
Watch this video. You’ll learn a thing or three:
The main takeaway: Don’t test too many variations at once. It’s better to do simple A/B testing anyway. You’ll get results faster, and you’ll learn faster—improving your hypothesis sooner.
9. Running multiple tests at the same time on overlapping traffic
You’ve found a way to cut corners by running multiple tests at the same time: one on the product page, one on the cart page, one on the homepage (while measuring the same goal). It saves time, right?
This may skew the results if you’re not careful. It’s probably fine unless:
- You suspect strong interactions between tests.
- There’s large overlap of traffic between tests.
Things get trickier if interactions and traffic overlap are likely to be there.
If you want to test a new version of several layouts in the same flow at once—for instance running tests on all three steps of your checkout—you might be better off using multi-page experiments or multivariate testing to measure interactions and attribute results properly.
If you decide to run A/B tests with overlapping traffic, keep in mind that traffic should always be split evenly. If you test product page A vs. B and checkout page C. vs. D, make sure that traffic from B is split 50/50 between C and D (not, say, 25/75).
10. Ignoring small gains
Your treatment beat the control by 4%. “Bhh, that’s way too small of a gain! I won’t even bother to implement it,” I’ve heard people say.
Here’s the thing. If your site is pretty good, you’re not going to get massive lifts all the time. In fact, massive lifts are very rare. If your site is crap, it’s easy to run tests that get a 50% lift all the time. But even that will run out.
Most winning tests are going to give small gains—1%, 5%, 8%. Sometimes, a 1% lift can mean millions in revenue. It all depends on the absolute numbers we’re dealing with. But the main point is this: You need to look at it from a 12-month perspective.
One test is just one test. You’re going to do many, many tests. If you increase your conversion rate 5% each month, that’s going to be an 80% lift over 12 months. That’s compounding interest. That’s just how the math works. Eighty percent is a lot.
So keep getting those small wins. It will all add up in the end.
11. Not running tests all the time
Every day without a test is a wasted day. Testing is learning—learning about your audience, learning what works, and why. All the insight you get can be used across your marketing (e.g. PPC ads).
You don’t know what works until you test it. Tests need time and traffic (lots of it). Having one test up and running at all times doesn’t mean you should put up garbage tests. Absolutely not. You still need proper research, a good hypothesis, and so on.
But never stop optimizing.
12. Not being aware of validity threats
Just because you have a decent sample size, confidence level, and test duration doesn’t mean that your test results were valid. There are several threats to the validity of your test.
Instrumentation effect
This is the most common issue. It’s when the testing tools (or instruments) cause flawed data in the test. It’s often due to the wrong code implementation on the site, which will skew all the results
You’ve really got to watch for this. When you set up a test, observe every single goal and metric that’s being recorded. If a metric isn’t sending data (e.g. “add to cart” click data), stop the test, find and fix the problem, and start over by resetting the data.
History effect
Something happens in the outside world that causes flawed data in the test. This could be a scandal about your business or one of its executives. It could be a special holiday season (Christmas, Mother’s Day, etc.). Maybe a media story biases people against a variation in your test. Whatever. Pay attention to what’s happening in the world.
Selection effect
This occurs when we wrongly assume some portion of traffic represents the totality of the traffic.
For example, you send promotional traffic from your email list to a page on which you’re running a test. People who subscribe to your list like you way more than your average visitor. But now you optimize the page to work with your loyal traffic, thinking they represent the total traffic. That’s rarely the case!
Broken code effect
You create a treatment and push it live. However, it doesn’t win or results in no difference. What you don’t know is that your treatment displayed poorly on some browsers and/or devices.
Whenever you create a new treatment or two, make sure you conduct quality assurance testing to make sure they display properly in all browsers and devices. Otherwise, you’re judging your variation based on flawed data.
Conclusion
There are so many great tools available that make testing easy, but they don’t do the thinking for you. Statistics may not have been your favorite subject in college, but it’s time to brush up.
Learn from these 12 mistakes. If you can avoid them, you’ll start making real progress with testing.
Working on something related to this? Post a comment in the CXL community!
Related Posts
-

A/B testing is highly useful, no question here. But a lot of businesses should not be…
-

A/B testing splits traffic 50/50 between a control and a variation. A/B split testing is…
-

Here’s an uncomfortable truth about conversion rate optimization: lots of people are running bad tests…
-

You may be wondering, "why should I make my own visualization of my A/B test…
