


Conversion optimization for mobile apps is getting more sophisticated. At first, click-through rate was key. Then we became more performance-oriented and measured click-to-install conversion rate. But that’s just not enough today.
Don’t get me wrong—an install is still an important milestone in the mobile consumer journey. However, it should only be a step en route to your final destination—that is, creating an app with sustainable commercial value. After all, you can’t pay your bills with installs.
Table of contents
The real metric: Install-to-[value]
App engagement, or rather the lack of it, is becoming the key challenge for app marketers. Localytics reported that 21% of users abandon an app after one use. And in their app retention report, they reported that 71% of all app users (across all industries) churn within 90 days.


That’s because an app has to compete with millions of other applications in the app stores and also dozens of others on a user’s device.
In late 2019, there were around 2.8 million apps available just in Google Play Store—more than double compared to just five years before that.
When you consider that 96% of time is spent on the top 10 apps, you can see where the challenge to retain mobile app users is coming from.


Users also expect a super duper user experience, and won’t think twice before tossing an app out the window if it does not meet their expectations. That’s why a rock star product manager is key to improving your install-to-[value] conversion rate. (As marketers, that’s beyond our scope and therefore the subject of a another post.)

So we’ve established that focus is shifting from installs to retention, engagement, and lifetime value. Which conversion rate should we measure to drive these goals? How can marketers squeeze the data lemon in our optimization efforts? Let’s explore.
Stage 1: Which in-app events correlate with your goals?
If retention, engagement, and lifetime value are goals, determining which in-app events to measure is the means. Each app in each vertical is a world of its own.
Let’s take a gaming app as an example. They know that users who complete a tutorial are much more likely to be retained over time than players that do not. Thus, they can measure and then segment users who completed tutorials.
A retail app that wants to increase the number of paying users can measure the average number of in-app purchases per user. And a productivity app that seeks to boost usage can measure average sessions per user.
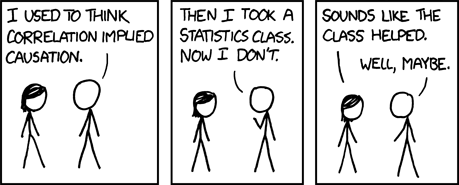
You get the picture—real business objectives and in-app event measurement go hand in hand. Keep in mind that correlation doesn’t equal causation. For instance, rather than people buying more because they watch tutorials, maybe users that are intrinsically motivated to buy more anyway just happen to watch tutorials also.
However, finding correlation points allows you to optimize for these events and gives you a point at which to begin testing.
Stage 2: Optimize your user acquisition campaigns
You’ve singled out the segments that matter most to your business. Now, you can use mobile measurement companies to pinpoint the exact marketing channels, networks, campaigns and even creative variations that delivered those users.
The idea is to attribute installs to a source and then continue tracking their actions after the install as they engage with the app.
Connecting meaningful in-app activity to its acquisition source is important. You can increase spend with high performers and reduce or remove spend with sources that underperformed. This is possible when you don’t just drive installs, but rather generate users that actually drive real value to your app.
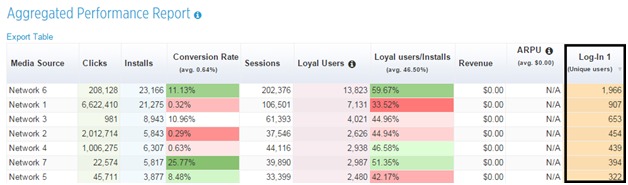
Here are some examples of optimizing meaningful post-install events. Images are from the AppsFlyer dashboard.
1. Table sorted by Average Revenue Per User (ARPU)
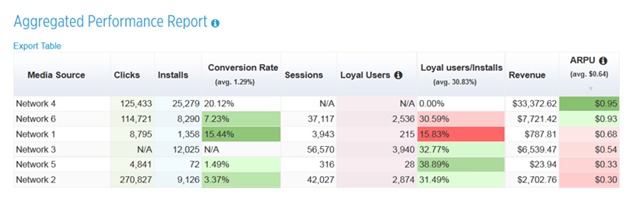
Key takeaways:
- Networks 4 and 6 reign supreme, delivering users that ended up with the highest ARPU.
- Network 5 shows commercial potential with a high loyal-user-to-install ratio.
Optimization performed:
- Spend increased in networks 4 and 6 as there was still room to expand without going overboard (targeting the same users twice).
- Network 5 budget grew to attract more engaged users. A greater emphasis was placed on monetization in order to get the engaged users to actually spend money.
2. Table sorted by Loyal Users/Installs ratio
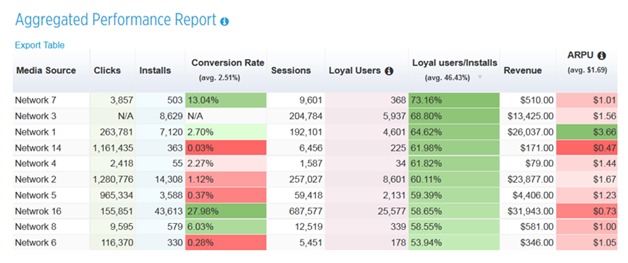
Key takeaways:
- Networks 7, 3 and 1 delivered the highest ratio of loyal users.
- Network 1 produced users with an extremely high ARPU.
Optimization performed:
- Spend increased in networks 4 and 6 as there was still room to expand without going overboard (targeting the same users twice)
- Network 1 budget grew to attract more quality users. Its messaging and targeting criteria were adopted on other networks, particularly 7 and 3, which have the highest potential for monetization as its users are most engaged.
Stage 3: Granular in-app event measurement
Make no mistake—measuring in-app events is a huge step forward.
But going even deeper can produce even better results. After all, segmenting “high income users who added at least two kids products worth at least $20 to the cart” instead of “shoppers who added a product to cart” gives you far greater flexibility and knowledge of your audience.
Think about travel marketers operating in a seasonal industry. For them, high lifetime value is an extremely important goal to attain. In this case, they can track users who made at least two bookings in different seasons. Or, imagine a retail app that seeks to increase the size of its target audience of upper class women in their 30s and 40s. They can measure users who visited or bought high end women fashion products.
These deeper in-app events are called rich in-app events because they are enriched with data that includes multiple parameters.
Deep analytics can be fruitful, but most app marketers we encounter are still measuring basic in-app events. In fact, half do not measure mobile engagement or ROI at all! The good news is this is changing as more marketers adopt a mobile-first, data-centric approach.
Here’s a table from our dashboard that shows which networks did well and which did not. This is from aggregated rich in-app event data of users who booked a family hotel room in Miami during December.
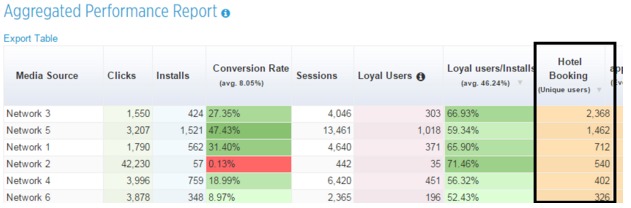
Key takeaways:
- Networks 3 and 5 reign supreme so spend should be increased, while also making sure their reach has yet to be maximized. In other words, new users are still seeing ads rather than the same users over and over again.
- Network 6 should be dropped with a mere 3.5% install to booking conversion rate and a low volume of users.
Another example from a retail app focuses on logged-in users that made at least two purchases within their first two weeks of activity.
Key takeaways:
- Networks 6 is the clear winner so spend should be increased (until reach is maximized).
- An interesting insight comes from network 5. Although it delivered the lowest number of users, in terms of the install to in-app action conversion rate, 8.2% is a great figure so an even bigger investment in this network makes sense.
Ultimately, tracking rich in-app events expands your knowledge about your audience so you can apply the learnings across your marketing campaigns. It will also help you define granular segmentation, which will ultimately lead to enhanced targeting.
It’s important to note that the ability to pass detailed in-app event data from a tracking provider to networks for advanced audience campaigns is an advanced trade. And it’s for this reason that only networks at the forefront of mobile targeting capabilities can do this.
Stage 4: Take a data deep dive with cohort analysis
A cohort report enables you to group users with common characteristics and measure specific KPIs over different timeframes. It offers a great indication of the quality of the average customer and whether that quality is increasing or decreasing over time. Here’s a great cohort analysis 101 for more.
The metric can be any in-app event and is calculated for different timeframes, which represent the first X activity days per user, and then accumulated among all users (that’s why the graph never drops).
The following example looks at a gaming app with a high install volume but a poor ratio of in-app purchases. The marketer identified a basic funnel with tutorial completion being a key indication of long term value. As such the cohort analysis performed was divided into two parts:
1. Average tutorial completions per user
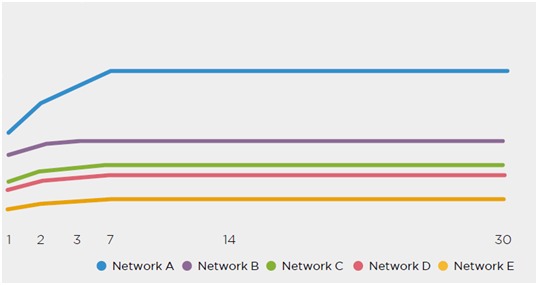
Key takeaways:
- Network A is hot right off the bat with about 24% of users, reaching 31% and then flattening out.
- Network B is incentivized traffic that offers potential players rewards in return for tutorial completion. It’s therefore no surprise that this low quality traffic started off high but then plateaued.
- Networks C and D grew modestly until day seven.
- Network E performed badly.
Optimization performed:
- Networks B and C were explored at campaign and ad level, removing the underperformers.
- The budget of network A was increased to maximize its reach.
- Retargeting campaigns were launched for users ahead of day seven as that’s when there’s a drop in activity across the board.
2. Average number of in-app purchases per user

Key takeaways:
- Network A performed well cross-funnel, gaining ground on day three and flattening out on day 14.
- The optimization done on Network B proved itself as a more users took action and progressed down the funnel.
- Network C optimization did not fare as well showing modest growth until day seven.
- Network E’s incentivized traffic plateaued right away, which clearly shows how deep these users go in the funnel.
Optimization performed:
- Network E was removed.
- The targeting criteria of Network C were changed to resemble Network B.
Don’t forget to deep-link your campaigns
One tip to adopt that can significantly increase your install-to-[value] conversion rate is to make sure your app is properly deep-linked.
Unlike the web, there are no hyperlinks in the mobile app environment. So if you want your user to end up where you want them to end up (assuming it’s beyond the home screen), you absolutely need to use deep links.
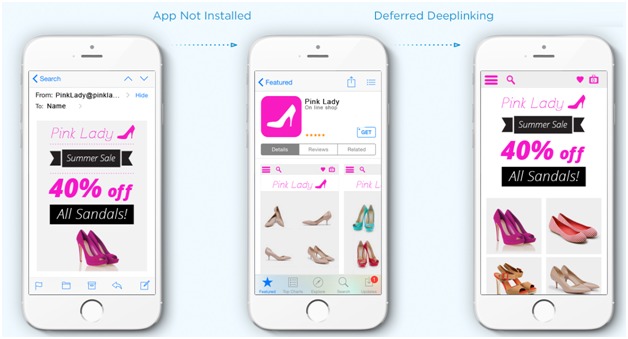
Delivering an optimal user experience on mobile is dependent on deep link ability to go through the app store and still keep the relevant data on the link. This way, the user can be presented with a specific landing page when the app is launched for the first time.
The illustration below clearly shows this: if you click on a promotion for 40% off, install the app, and then immediately get the promotion that drove you to install the app in the first place, you can imagine the impact on your conversion rate. And vice versa.
Conclusion
When people talk about conversion rate optimization in app marketing, hopefully they are referring to the install-to-[value] rate rather than the click to install rate.
We’re in an app economy dominated by a low retention rate of free apps that offer in-app purchases. Measuring rich post-install events and connecting them back to the acquiring channel is the only way to go if you want to meet your marketing goals and improve your bottom line.
Related Posts
-

If I were to tell you - what would you do with that information? Honestly,…
-

What's a good conversion rate? A conversion rate that's better than the one you currently…
-

People hardly buy anything without seeing it. Usually, they also want to touch it, hold…
-
Somebody asked me the other day, what are all the possible ways to increase the…
