


You spend plenty of marketing dollars trying to get someone to your form. But how much goes to waste at that stage? According to data from Zuko, roughly two-thirds of those who start filling out a form never complete it.
Why? If you’re not tracking form analytics, you don’t know. The data between a pageview and a form completion (or abandonment) is missing.
Form analytics can illuminate potential issues. Form analytics provide quantitative data on metrics such as field timings, field re-entries, last field before abandonment, completion rates by segment, etc.
You can set up a custom tracking solution with Google Tag Manager or rely on one of many software tools. Before you begin gathering more data, however, you’d better know what you plan to do with it.
Table of contents
Form analytics and conversion optimization
Form analytics invite narrative fallacies:
- The field that took the longest to complete must cause the most friction.
- The field that users last clicked before abandoning the process must be intimidating, etc.
Form analytics data doesn’t justify those conclusions. It’s best paired with other quantitative and qualitative research as part of a thorough conversion research process.

The clearest answer you may get from analyzing your forms—in Google Analytics or separate tools—is with a technical issue.
If, for example, users of Samsung Galaxy phones take four times as long to complete a form as those on other mobile devices, a technical issue is a likely cause. (Even then, it’s still a hypothesis, albeit a more objectively testable one.)
Form analytics data aids testing. It can help reinforce hypotheses derived from user testing and other sources. It also allows you to test more granular changes. If you’re not measuring, for example, the timing on a field with or without autodetection of credit card type, you won’t know the impact of that change.
Without form analytics, you’re left to throw “best practices” darts at a board. And, as we’ve written before, best practices are often common practices. Further, some maxims, like “shorter forms work better,” don’t always hold true.
(If you’re wondering what may be worth testing on your forms, check out our guides on lead form generation or mobile form optimization, or take our form optimization course.)
Before you move forward, a few cautionary notes
- Are you even tracking form submissions properly? It’s easy to get excited about more data, but make sure you’ve set up proper Destination or Event goals in Google Analytics.
- For custom setups, be cautious of collecting PII. You can’t store Personally Identifiable Information (PII) in Google Analytics. Forms are full of it: names, addresses, emails, credit card numbers, etc. Form analytics platforms avoid this issue by recording only the category of keystrokes (e.g. letter, number) rather than the information entered. (They also record that data outside of Google Analytics.)
- More data, poorly used, won’t solve any problems. As mentioned earlier, form analytics can inspire narrative fallacies. Further, if forms aren’t the low-hanging fruit of your optimization campaign, it may not make sense to spend time gathering more data (yet).
If form completions are a big issue—but you have no idea why—you have two options:
- Use Google Analytics and Google Tag Manager to create a custom tracking system.
- Get a form analytics tool to help manage or scale the process.
1. Setting up form analytics in Google Analytics and Google Tag Manager


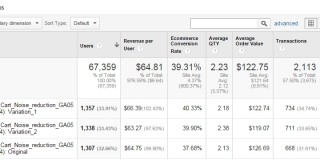
Goal tracking is the baseline for form analytics in Google Analytics—you can compare conversion rates by segment.
From that humble beginning, Google Analytics and Google Tag Manager offer a range of opportunities to track form interactions on your site.
The built-in variables for form tracking in Google Tag Manager include:
- Form Element. The form element that was clicked.
- Form Classes. An array of the values found in the form’s class attribute.
- Form ID. The ID attribute of the form element.
- Form Target. The target attribute of the form element.
- Form URL. The href attribute value of the form element, if any.
- Form Text. The visible text inside the form.
Every form submission populates the above variables. When setting up custom form tracking via Tag Manager, the variables can identify specific forms (or form fields) on a page.
Create a custom segment for form abandonment
At the very least, you can create a custom segment for sessions that abandoned a form. As Simo Ahava details, simply create a segment with a pageview (of your form page) but without a goal completion for that form:

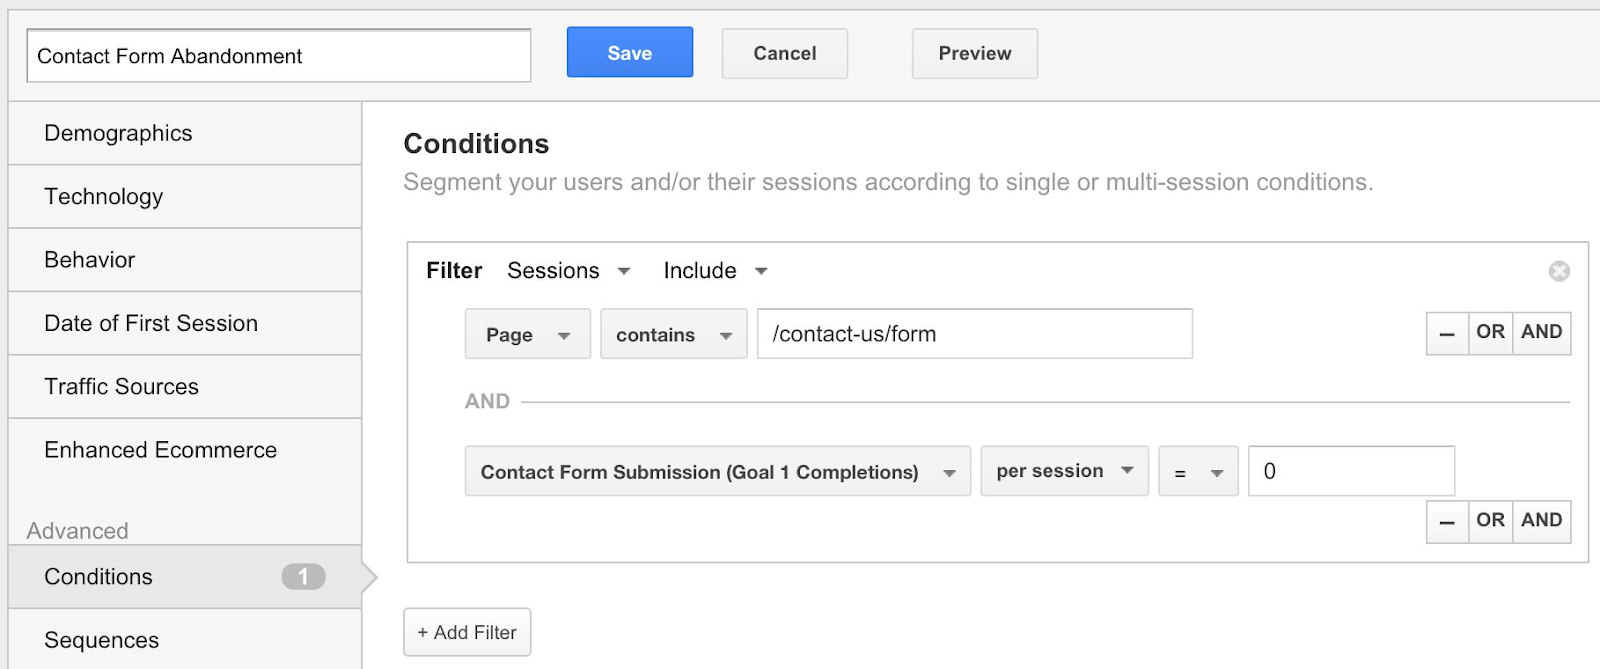
What can you expect to learn from this segment? For one, it’s a quick way to spot technical issues or glean hints about other potential shortcomings:
- Does a disproportionate share of sessions come from users on a certain device or browser? The form may not display properly. You can spoof the device in Chrome or open a different browser to see how it renders.
- Does a disproportionate share of sessions come from users from a certain location? Is a country name missing from a drop down? Is it buried in an unexpected location (e.g. England vs. United Kingdom vs. Great Britain)? That’s one of many possibilities.
- Does a disproportionate share of sessions come from a single product or lead page? Is another element on the page keeping the form from displaying properly?
- Does a certain demographic or traffic source perform worse than another? A simple segmentation of form abandoners is unlikely to give you the “why,” but it’s useful intel to include with other research.
Track if users interacted with form fields (and the order in which they did)
As Ahava continues in the same post, you can create an Event tag to differentiate between users who interacted with the form and those who didn’t. You can also identify the last field with which they interacted.
If you apply the Event tracking to each field, you can build those interactions into an ordered narrative, visualizing how users progressed through your form (before giving up):
firstName > lastName > address > creditCardNumber > expirationDate > creditCardNumber
In the hypothetical example above, the credit card field represents the last interaction the user had with the form before leaving. Once patterns emerge, you’ll have a better idea of which fields might be the most problematic.
Bounteous has a custom script that delivers a similar solution:
If there is text, it pushes an update to the data layer that includes a category with the name of the form, an action of “completed” and a label that is set to the name of the form field [. . .] If the field is left blank when the cursor exits, it fires a similar event, but sets the action field to “skipped.”
Track form field timings with Google Tag Manager
Tracking form field timings gives you a rough sense of which fields may be more challenging for users to complete. Obviously, some fields are more demanding than others—a credit card number takes longer to enter than a zip code.
Ahava’s solution for field timings
tracks the time the user spends on each form field by measuring the distance between the “focus” event and the “blur” or “change” event. The first one occurs when a form field is entered, and the latter depends on if a value changed (change) or no change was registered (blur).
One challenge? Tracking multiple field interactions on multiple forms risks exceeding the hit limit per session (500).
For that reason, Ahava recommends testing the implementation on a small section of the site before rolling it out sitewide (and spoiling the rest of your Analytics data).
Limitations on using Google Tag Manager
Why would anyone opt to pay for form analytics software over a custom setup in Google Tag Manager? There are several reasons:
- Google Tag Manager setups can be technical and time-consuming. For example, for the above form tracking solutions to work, “the form must dispatch a valid ‘submit’ browser event and the “event must not be prevented from propagating to the ‘document’ node.” If your current setup doesn’t do that, you’ll need to get your development team involved.
- The tracking possibilities are limited. Some of the tools below track dozens of metrics—even aggregating them into broader field “health” metrics—and visualize those metrics in clear reports. The gap between Events firing in Google Analytics and extracting useful insights can be wide (and expensive) to cross.
- The PII collection risk is real. You could quickly run afoul of Google Analytics’ terms of service with an innocent mistake.
If, for those reasons or others, you’re considering an alternative solution, there are plenty to choose from.
2. Form analytics tools for greater granularity and scale
Zuko offers form analytics exclusively. Other tools bundle form analytics into bigger products that, typically, include mouse-tracking data (heatmaps, scrollmaps, etc.).
All track similar metrics, with varying degrees of granularity:
- How often forms are abandoned or “dropped”;
- How many times users re-enter or correct field data;
- Which fields are regularly ignored or left blank;
- How many form submissions generate errors;
- How long it takes to complete a form field (or the entire form).
As our own Peep Laja has noted, a dedicated tool may work better, “especially when compared to some mouse-tracking tools that have form analytics as one of their many features.”
It’s one reason that Zuko has earned the reputation it has.
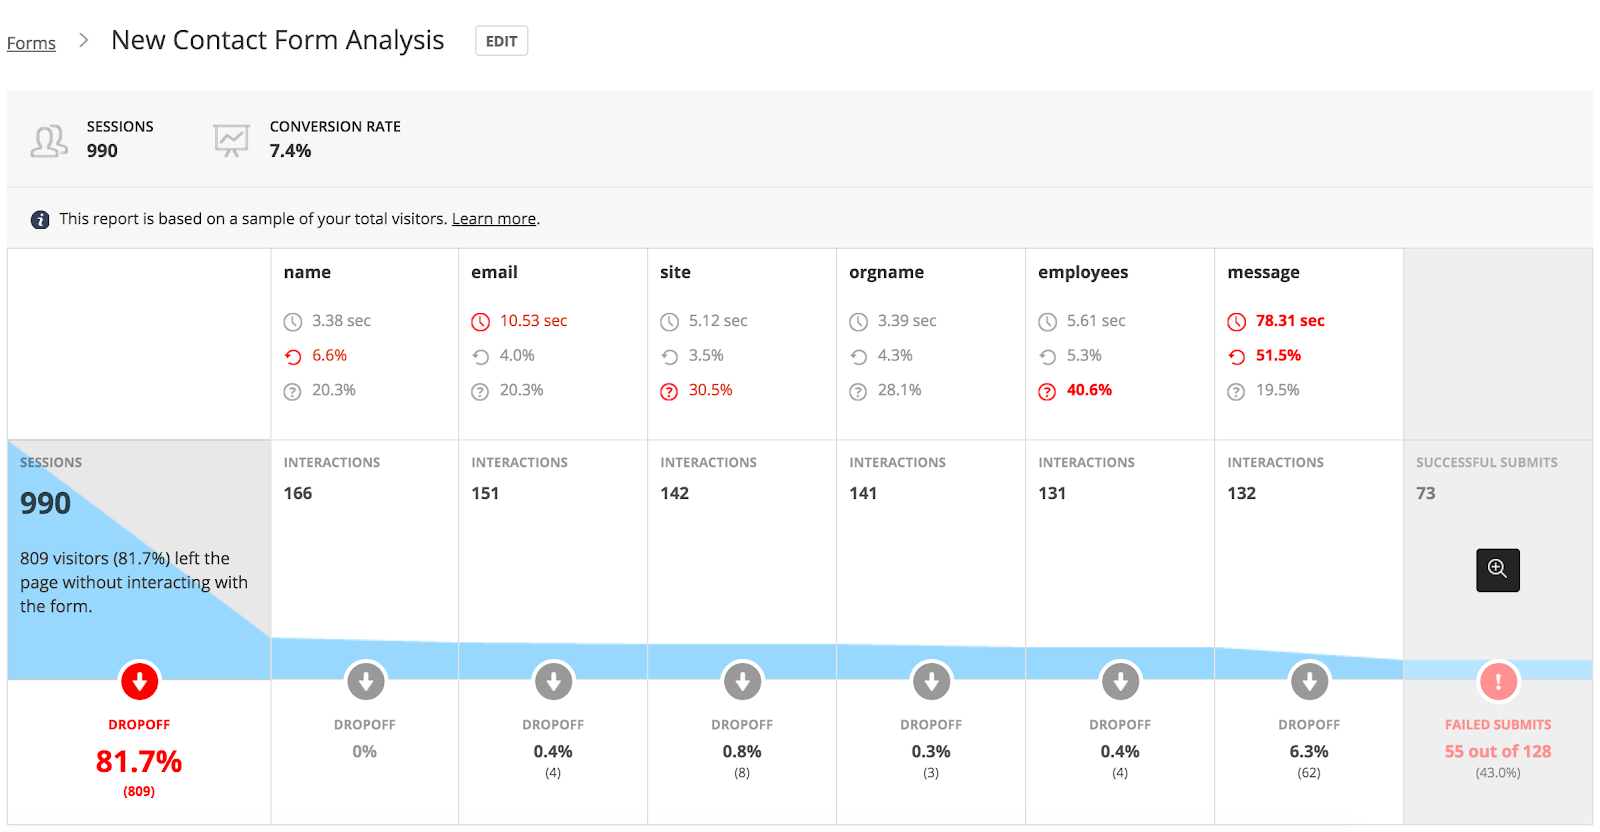
Zuko
Zuko is generally considered the industry leader in form analytics, in part because form analytics are the sole focus of the company.
Installed via dedicated JavaScript tags or Google Tag Manager, Zuko focuses on eight key reports, built from dozens of form metrics:
- Form Overview;
- Field Drop Off Report;
- Most Corrected Fields;
- Real Time Report;
- Completion Time;
- Problem Fields Report;
- Fields Before Submission;
- Field Times Report.
Zuko also breaks down field performance based on comparative metrics:
- the performance of a field compared to your industry;
- the Zuko average;
- the rest of your site.
There is, of course, a risk to looking at others’ benchmarks (instead of focusing on improving your own metrics). However, benchmarks can contextualize otherwise untethered metrics. (e.g. How long should it take to fill in an address line? Ten seconds? Thirty seconds?)
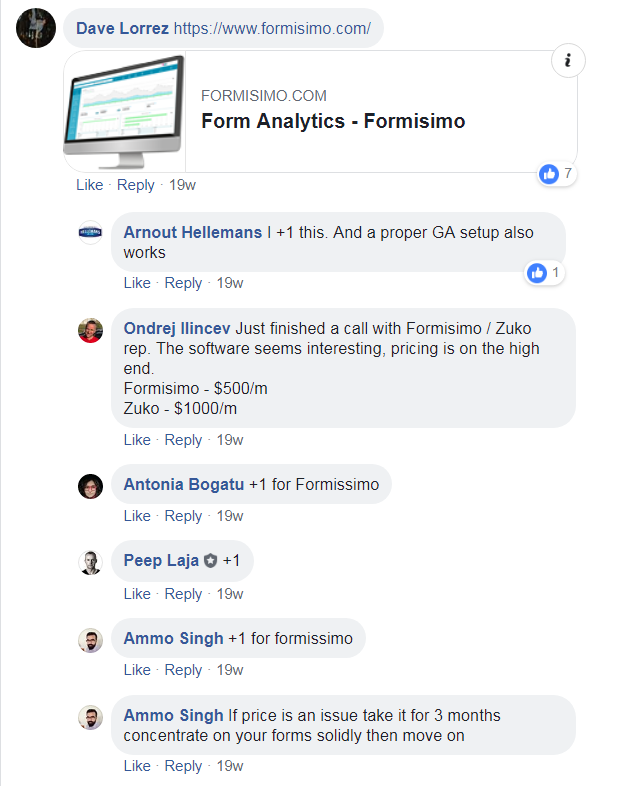
Zuko offers a seven-day free trial. A discussion in our Facebook group identified Zuko (formerly Formisimo) as the preferred option, although the starting price point—around $130—is a barrier to entry for some.

Form analytics within a broader tool suite
Most form analytics tools are part of a broader suite of tools. Listed below (alphabetically) are 10 tools that continually show up in lists of popular form-tracking solutions.
Most of the tools below track similar aspects of form interactions. The right solution may depend more on price or whether you (or your organization) prefer the related features the products offer.
Clicktale


Like other software in this category, Clicktale’s form analytics covers five main reports:
- Conversion Report;
- Drop Report;
- Time Report;
- Blank Field Report;
- Refill Report.
Those main reports can also be segmented into user groups:
- Visitors of different screen sizes and fold heights;
- Visitors from different locations and who speak different languages;
- Existing customers vs. first-time visitors;
- Converted customers vs. abandoned visitors;
- Organic traffic vs. paid search, email, or any other campaign traffic.
Clicktale offers pricing upon request.
Decibel Insight
Decibel Insight’s form analytics reports on
- Engagement rate;
- Abandonment rate;
- Error rate;
- Completion rate;
- Completion time.
Combined, those metrics are folded into a “Form Experience Score”:

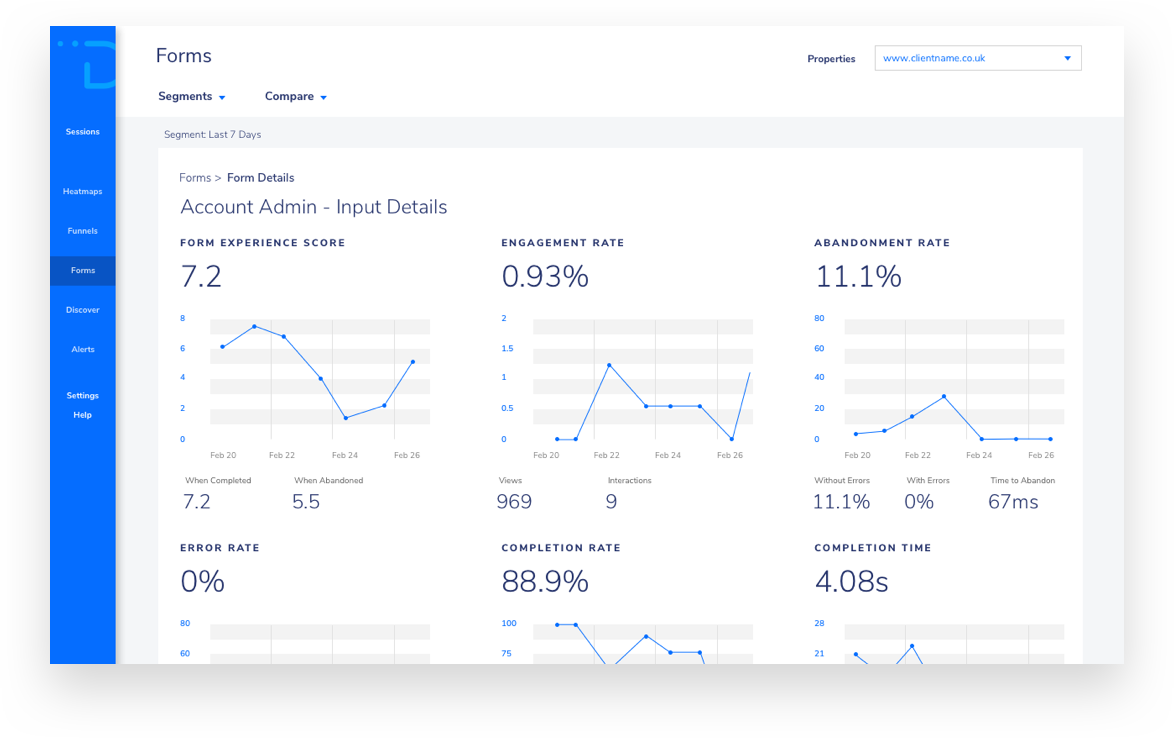
Decibel Insight offers pricing upon request.
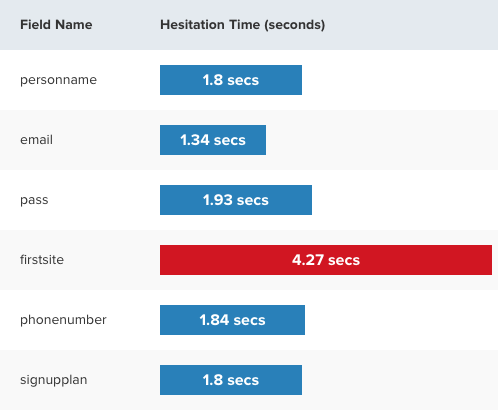
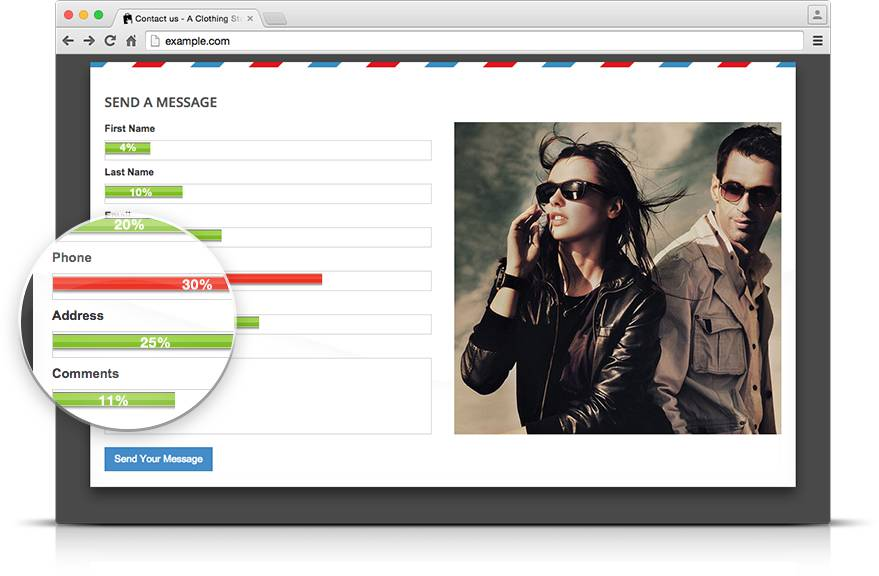
Freshmarketer
Freshmarketer’s form analytics offers five reports:
- Hesitation time;
- Abandonment rate;
- Drop-off;
- Time spent on the form;
- Correction rate.
The freemium version of Freshmarketer includes form analytics for up to 10,000 monthly users (70,000 pageviews).
The cost of the paid version scales based on the number of users, starting at $99 per month (50,000 users) and ranging upward to $479 per month (500,000 users).
Enterprise pricing is available upon request.
Hotjar

Hotjar’s form analytics include several high-level metrics in addition to form completion rates:
- Interactions;
- Average Interaction Time;
- Refill Count;
- Left Blank Count;
- Dropoff Count;
- Failed Submit Count.
Form reports are set up individually, field-by-field as a pseudo-campaign (e.g. capture X number of form reports) rather than an always-on tracking feature.
A freemium version exists for individuals (2,000 pageviews per day) as well as a $29 per month plan (10,000 pageviews per day) for “early-stage startups.” Other plans start at $89 per month (20,000 pageviews per day), with tiered pricing based on pageviews.
Inspectlet
Inspectlet’s form reporting is built into its platform that also includes features like heatmaps and session recording. It focuses on three key reports:
- Hesitation time;
- Average fill rate;
- Ignored fields.

While Inspectlet has a freemium version, form analytics are available only at higher tiers, beginning with a plan that costs $149 per month.
Lucky Orange

Lucky Orange’s form analytics software tracks five metrics:
- Abandonment;
- Time to start;
- Field time;
- Average order;
- Repeated fields.
Form analytics are one of seven tools offered as part of the Lucky Orange suite. In addition to a seven-day trial, Lucky Orange touts its comparatively low cost—$10 per month.
Matomo
Matomo, formerly Piwik, promises more than 50 form metrics with its Form Analytics plug-in, built by Innocraft. Metrics include:
- How often a field was refocused or corrected (e.g. usage of backspace or delete key, cursor keys);
- How much text they type into each of your text fields;
- Which fields are unneeded and often left blank;
- How long visitors hesitated (waited) before they started changing a field.
The software also bundles those metrics into a number of reports:
- Form usage by page URL;
- Most corrected fields report;
- Unneeded fields report (which fields are often left blank);
- Several evolution reports of all metrics to see how your forms perform over time.
Form Analytics is a plug-in that’s built on top of the Matomo analytics platform. Matomo starts at $19 per month and scales upward based on the number of sites, users, and pageviews. It offers a 30-day trial.
The Form Analytics plug-in is $168 per year or more depending on usage. It’s included free as part of Matomo Cloud.
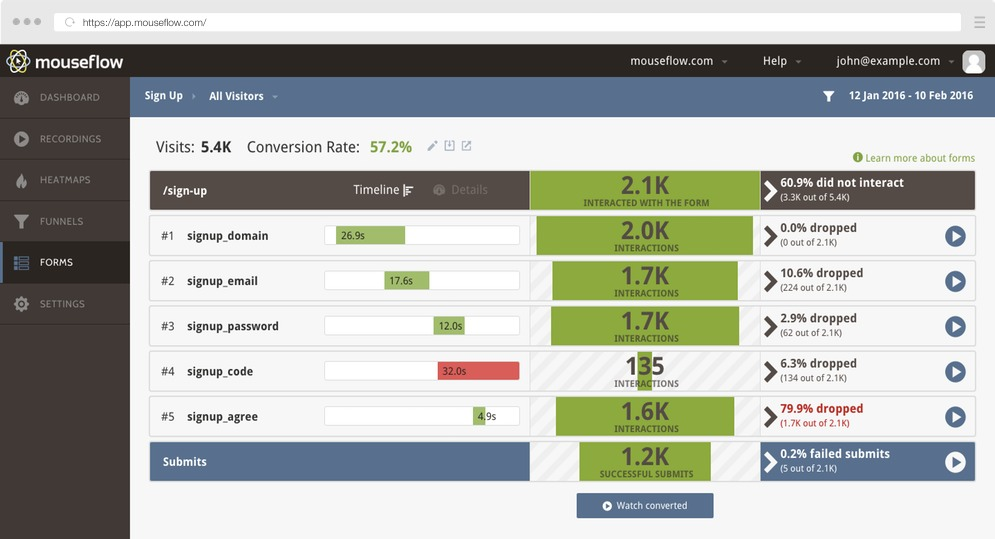
Mouseflow
Mouseflow launched a form analytics module in 2016, adding to its existing software that already offered—like many others—session recordings and heatmaps.
It tracks similar metrics to other platforms:
- Drop-off;
- Refills;
- Blank submissions;
- Errors.
It also offers real-time filtering of form analytics data.

The freemium version of Mouseflow offers form analytics on one form for up to 100 sessions; tiered packages beginning at $29 per month offer more forms and sessions.
SessionCam

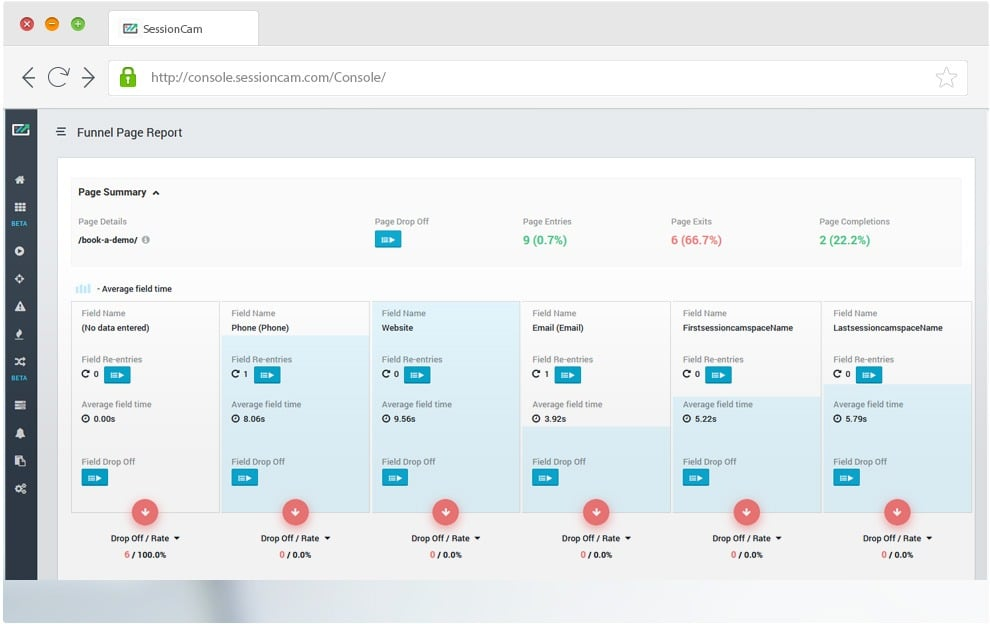
SessionCam’s form analytics highlight three main metrics:
- Drop-off;
- Number of re-tries;
- Average time taken for each form field.
It blends form analytics data with other tools, like session recording (allowing clients, it notes, to look at session recordings on forms with high abandonment).
Zoho

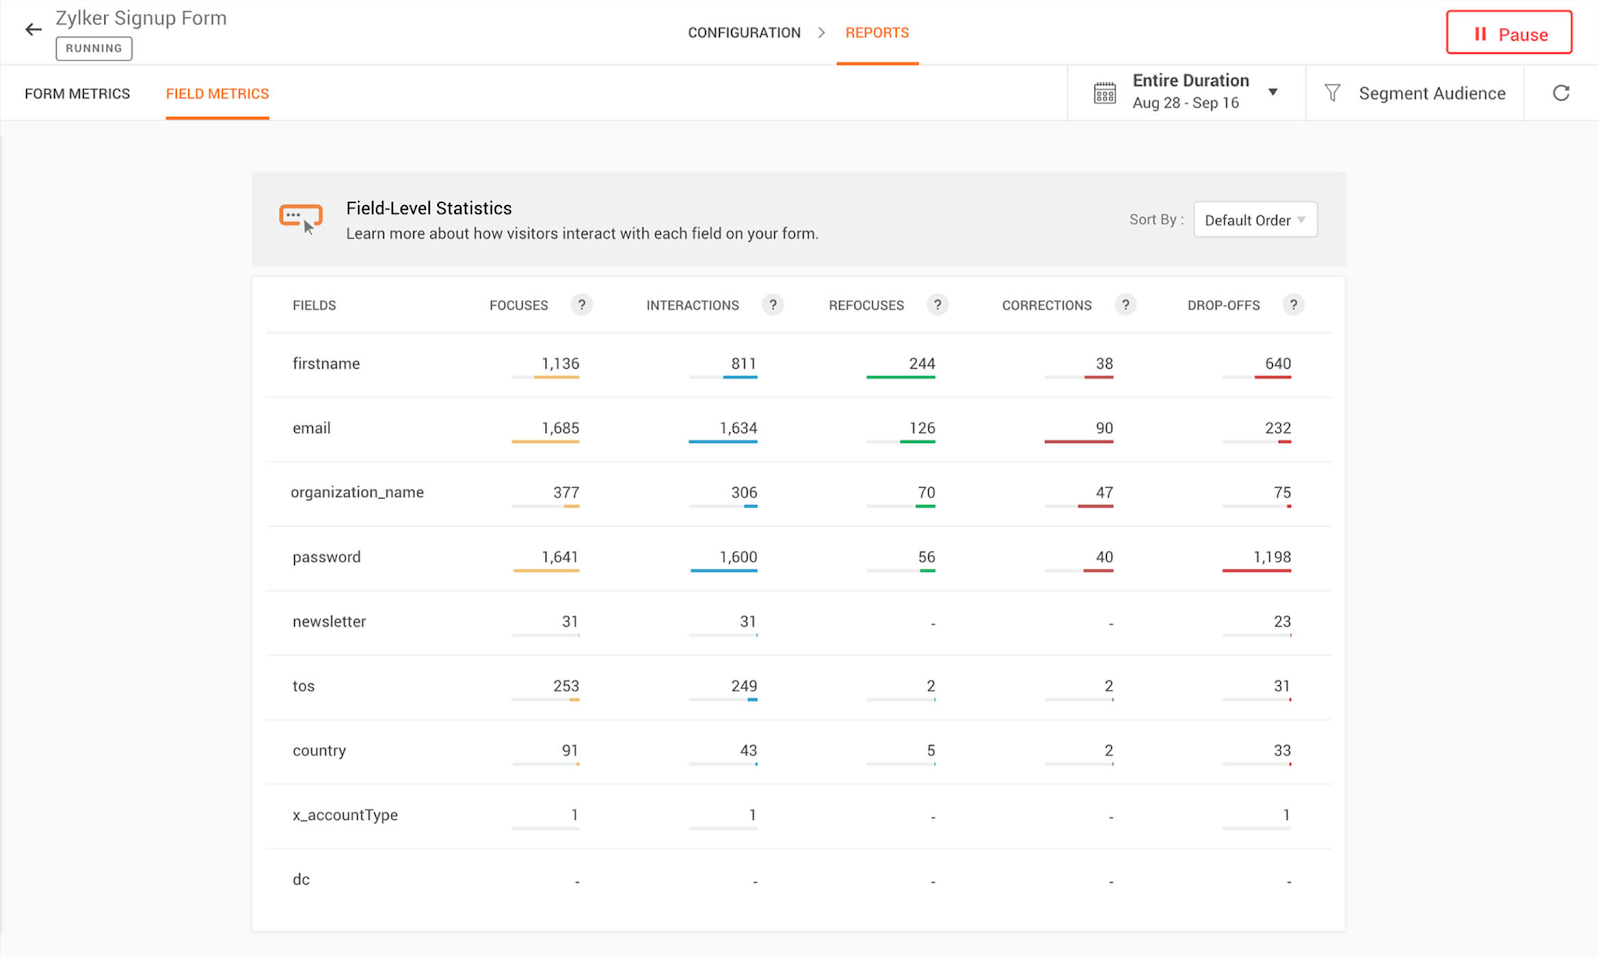
Zoho’s form analytics, like others, offer field-level breakdowns based on:
- Focuses (clicks into the field);
- Interactions;
- Refocuses;
- Corrections;
- Drop-offs.
It also offers segmentation by groupings like traffic source, country of origin, and new vs. returning visitors. Zoho offers a 30-day free trial of its platform that includes form analytics and several other features.
Paid tiers start at $17 per month for 3 projects and 10,000 monthly visitors.
Conclusion
Form analytics data won’t tell you what to do. But it can offer helpful clues to blend with other quantitative and qualitative data.
You can gather baseline metrics like the characteristics (e.g. devices, demographics) of those who abandon forms in Google Analytics. You can also get field-level data with custom Events in Google Tag Manager.
For more comprehensive solutions, there’s a dedicated tool (Zuko) as well as other solutions that fold form analytics into software suites that track on-page user behavior.
What’s the difference? A dedicated tool is more in-depth and accurate. Combined tools are cheaper and allow you to look at related data (e.g. session recordings) to pair with form analytics.
Just don’t confuse more data with better outcomes. Like everything else, the value of form analytics data depends on how effectively you combine those insights with others, and how well (and how fast) you can test your hypotheses.
Related Posts
-

As marketers, we spend countless hours acquiring traffic and crafting persuasive content, but too often…
-

This post is not a dry feature-by-feature comparison, nor does it include a winner-take-all verdict.…
-
A/B testing tools like Optimizely or VWO make testing easy, and that's about it. They're…
-
Google Analytics helps us identify conversion uplift opportunities. Traffic is precious, and we don't want…
