
Both your visitor and Google prefer your site to be fast. Increasing site speed has been shown to increase conversion rates as well as increase SERP rankings, both resulting in more money for your business.
You’re doing A/B split testing to improve results. But A/B testing tools actually may slow down your site.
We researched 8 different testing tools to show how your site performance is affected by each one. We’ll outline the background, methodology, etc, but click here if you want to go straight to the results.
Background
1. Data Shows Faster Sites Convert Better
Visitors have a patience threshold. They want to find something and unnecessary waiting will make them want to leave. Just like in a any shop.
For you, that means a slower site is less revenue.
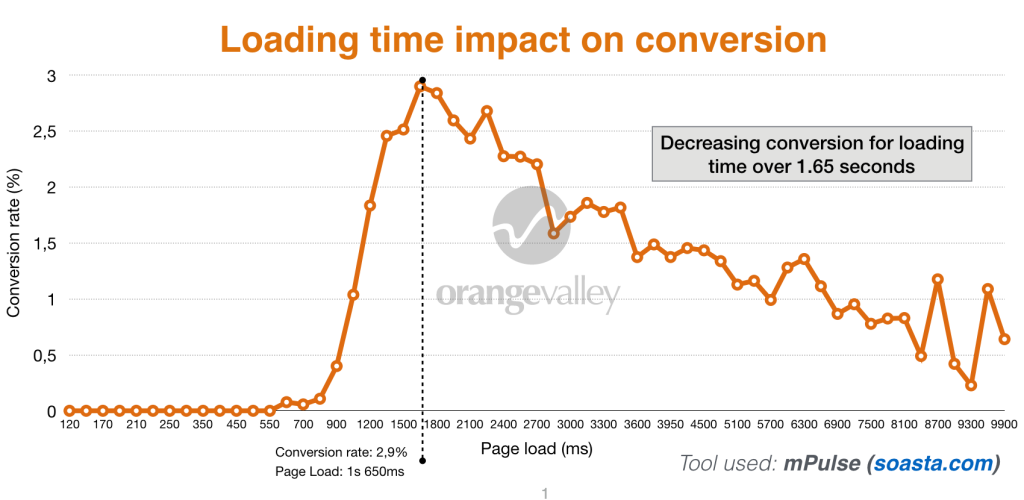
In the graph above you can see the relation (green line) between load time and conversion rate for one of OrangeValley’s customers. 1 second slower, 25% less conversions.
The relation between web performance and conversion has been documented in many studies. Google is also pushing for website owners to improve their site speed in their effort to improve the web experience.

2. How a Testing Tool Cost Us 12 Points On Google Page Speed
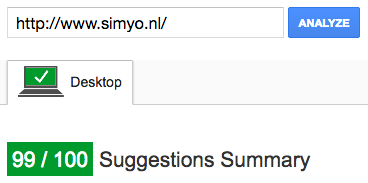
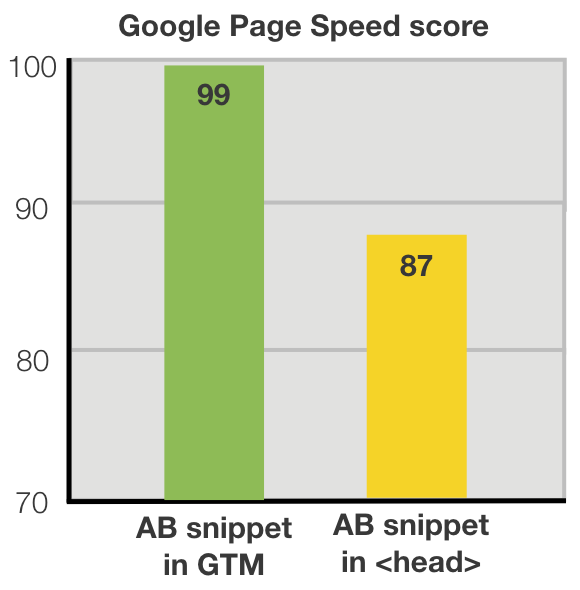
Simyo (telco company) had a 99/100 Google Page Speed score for their homepage. That was before implementing an A/B testing tool. After implementing the testing (according to the vendor’s best practices), the score dropped 12 points.
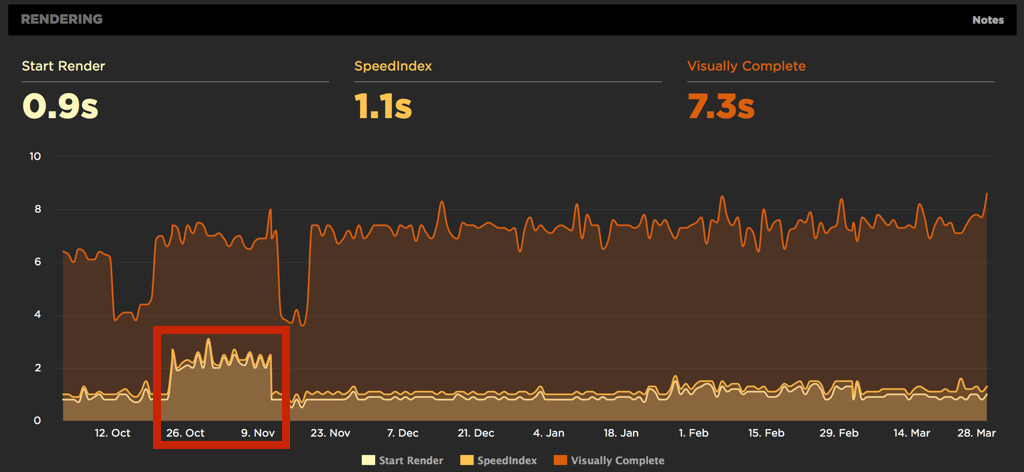
Here’s what happened to the Start render time when we implemented an A/B testing tool based on the recommended method of implementation of the vendor.
Implementing the A/B testing tool simply made their website slower than their main competitors, which affected their competitiveness on SEO as well as conversion.
3. How Testing Tools Can Slow Down Your Site
Most A/B testing software creates an additional step in loading and rendering a web page.
Many use a technology based on javascript that is executed on your visitor’s browser. This is called a client-side script. The page gets loaded and the script modifies the source code. This cannot be done until the elements that need to be modified are loaded and thus causes a delay.
That is why sometimes you can see elements changing on page as it is still loading.
As Brian Massey, Founder of Conversion Sciences, said:


Brian Massey, Conversion Sciences
“The flash draws attention to the element you’re testing, meaning that visitors who see your test will focus on that element. If the treatment wins, it will be rolled out to the site, eliminating the flash. The increase seen in the test can be completely erased. So, this is a pretty important issue.”
But that’s only part of the problem. The presence of such scripts can block the render execution of parts of your page, slowing it down even more.
Plenty has been written on this topic. Here’s a good article that goes into depth and a GrowthHackers discussion to follow.
Disclaimer and transparency
Changing an image and some text are part of many A/B tests, so it makes sense to use these simple changes as the basis of this study.
However, a tool’s performance will, of course, partly depend on the page you are testing and the type of experiment executed.
For research purposes, we needed to test the same thing (to isolate that variable). Perhaps other experiments could lead to different results, so it couldn’t hurt to test this for yourself.
At OrangeValley, we choose the tools our clients use on a case-by-case basis. As a result we mostly use Optimizely, SiteSpect (located in the same building we are in) and VWO – though sometimes we use other tools, too.
In late 2015, we were having issues with a client-side tool (flicker effect). Optimizing code and testing different implementations did not work, and a back-end tool was not an option. Since we did not have a plan C we decided to find out the very best client-side A/B testing tool when it came to loading time – so that’s why we decided to embark on this study (and share it with you!).
Vendor Responses
We also got responses and updates from some of the tools after the study was conducted.
Omniconvert increased the number of servers and added a layer of caching to serve variations (whether that be A/B testing or personalization) faster. They also speeded up the audience detection method which helps apply experiments faster. By now they also should have expanded into several specific regions allowing lower latency there.
VWO indicated they have a preference for asynchronous to make sure server down time could never lead to their customer’s website jamming.
They also pointed out that as we setup our study in ‘clean’ accounts, this is not the same as in fully operational accounts. With their technology only relevant experiments are loaded for a user whilst some other vendors load all experiments regardless of the experiment that needs to be applied for a visitor (e.g. Optimizely recommends archiving experiments when no longer used).
Given our ‘clean’ account setup VWO couldn’t benefit from their technology’s advantage in this study.
Lastly and importantly, they informed me that any images uploaded to their service are stored in the U.S. and not distributed over any CDN. This means that for VWO users outside of the U.S., it is probably better to store images on their own servers. Although in this study we consciously chose to test the ‘out-of-the-box’ service vendors provided, we do acknowledge this may have caused the background image to load slower than it would have when uploaded to a regional server.
Editor’s note: AB Tasty didn’t agree with the results of the study, so they’ve been removed. The integrity of the results still stands, independent of individual vendors’ reactions.
HP Optimost unfortunately did not respond to our email in which we shared their ranking outcome of this study. All other vendors we spoke to (SiteSpect, Maxymiser, Convert.com, Omniconvert) had no other remarks about the methodology of this study.
Methodology Summary
In this study we compared 8 different A/B testing tools on loading time experienced by your website visitors. The goal for us was to determine which alternative tool we should be looking at to minimize any negative effect.
Here’s the control:
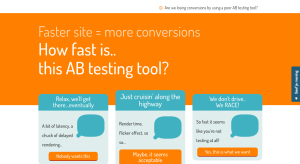
And here’s the variation:
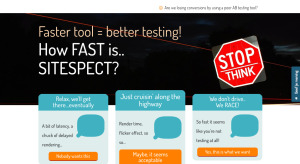
In the variation, we changed the title text and inserted a background image.
Here are the tools we studied:
Monetate and Adobe Test & Target are also known tools but were not included. We invite them to participate in any follow-up on this study.
Measuring performance
We used Speedcurve and our private instance of Webpagetest.org to conduct loading tests during a full week. These are widely used platforms among web performance experts.
All experiments were setup the same:
- same hosting server (Amsterdam)
- same location and speed settings (15Mbps down, 3Mbps up, 28 ms latency)
- same variation
- implementation according to vendor’s knowledge base recommendations
- background image uploaded to the tool when this option was available
- 80+ test runs per tool during a week to decrease the effect of potential outliers (in hindsight all tools showed stable measurements)
- The testing page was a copy of a customer landing page of which we modified the colors and text
- The time for the variation to show was measured for first views (the first impression a new user will get)
How we measured experienced loading time in an A/B testing context
In this study we look at the loading time of elements above the fold as this directly corresponds with experienced loading time. Total page load is not taken into account. We decided to adopt this approach as the WPO industry is moving more and more towards measuring what matters for user experience (critical elements showing up). People, after, all can start reading and get their first impression before the page is completely loaded.
What we really wanted to measure was when specific elements relevant to visitors are loaded – including any changes applied by the A/B testing tools, as this directly impacts experienced loading time by users.
Our challenge was that we needed to measure beyond loading the original elements – first, when elements were loaded, and second, when the client-side script (used by 7 out of 8 vendors) changed those elements in the A/B test.
In some cases the final text was directly visible, in other cases the original text was shown and then changed on-screen to the final text (flicker effect).
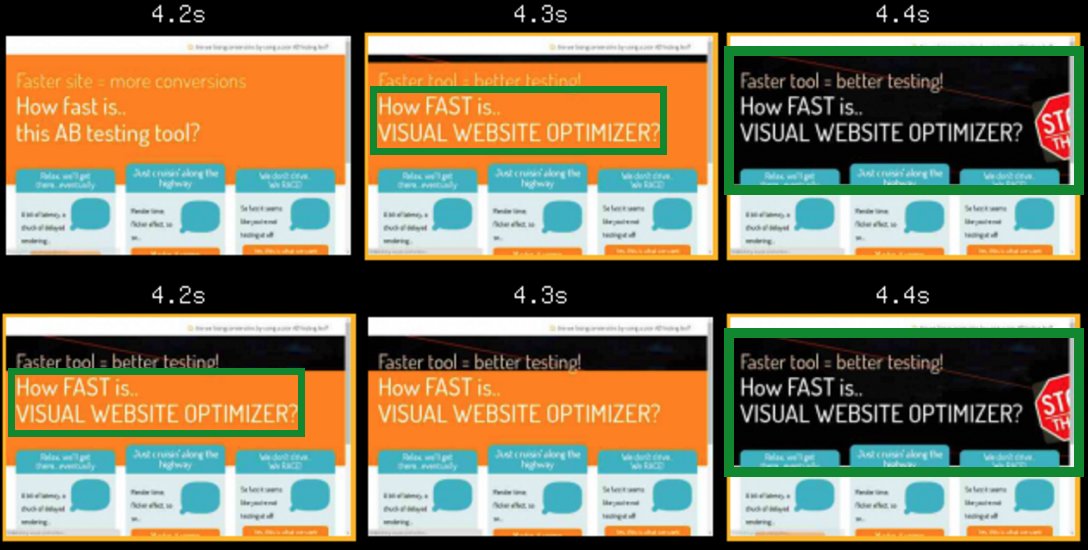
In the end we automated the process of analyzing the filmstrips in order to measure these changes on-screen for the user. This way we could measure when the variation text “How FAST is …[A/B testing tool]?” and the background were applied to the page.
Originally we intended to look at metrics such as Speed index, start render and visually complete to compare the tools. However, when we looked at the render filmstrips and videos it became clear that these data metrics were not really representative of what your site visitors would experience. In fact, one of the tools allows the page to start rendering very very soon, but what the visitor in the end sees in his/her browser turned out to be much slower.
Speedcurve does have a great solution to measure experienced loading time using custom metrics. Essentially you add scripts to elements on your page that are most relevant to the user when entering the page: Elements above the fold such as your value proposition and important call-to-actions.
In this case we needed to measure the changing text and background that were part of this experiment. Although we could measure the original headline with custom metrics, doing the same with the variant headline turned out to be more challenging.
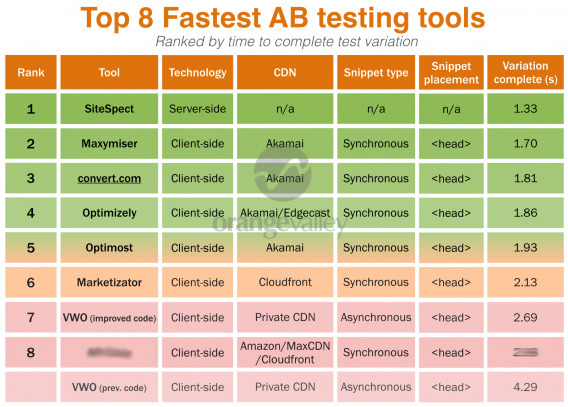
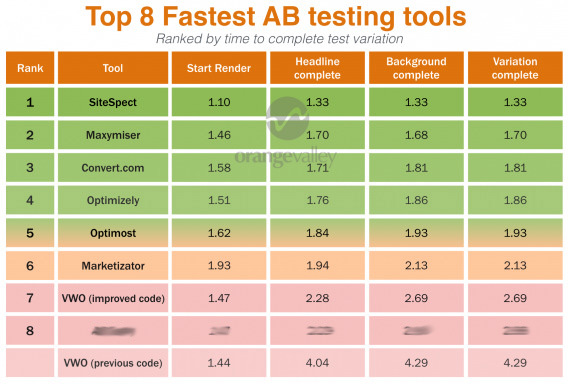
Results: Top 8 fastest A/B testing tools
Here’s what we found:
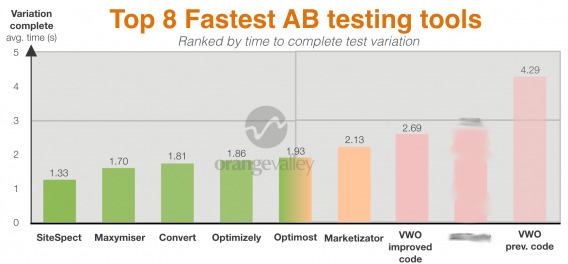
And here’s a comparison of the tools in graph form…
Then here’s a video comparison of the tools’ loading times:

We hope the results we found were useful for you! Were you surprised by anything?
Conclusion: What to do with these results?
With clear performance differences between A/B testing tools, it’s wise to choose carefully. Lower performance can lead to lower conversion, test reliability and a drop in page speed won’t do good for your SEO position.
Don’t panic, like mentioned earlier not all sites are the same. Perhaps your site is even too slow right now to be slowed down by third-party tools. So make sure to get data on your site using simple tools such as Google Page Speed and Webpagetest.org and ensure that the tool you are using works properly on your site, or try to improve your setup.
We hope this research is useful for you. Feel free to share or comment below with your own experiences.
Update: After publication VWO contacted us once more. They informed us that the variation code was not optimal (read their post to learn more). We retested VWO and have now added this new strongly improved results in the tables and graphs.
Related Posts
-

A/B testing is highly useful, no question here. But a lot of businesses should not be…
-

"Our A/B testing tool's visual editor allows marketers to set up tests without needing developers!" A version…
-
Marketers of all stripes are obsessed with tools. This obsession has bred comprehensive lists of…
-

Sometimes A/B testing is made to seem like some magical tool that will fix all…
