

For companies that build their analytics on Google products, purchasing Google Analytics 360 is a symbol of maturity.
As a business grows, it inevitably runs up against limitations of analytics tools. For example, while the data aggregation process in Google Analytics seems like a “normal” feature, it might be a hurdle if your business needs to process data at the hit level instead of by sessions or campaigns.
It’s one of many potential business needs that could affect your decision to upgrade to a Google Analytics 360 license. But is it worth the serious investment?
If you’ve spent hours calculating your expected ROI for Google Analytics 360 and still don’t know, this article is for you. We’ll run through a feature-by-feature comparison of Google Analytics and its paid counterpart, Google Analytics 360.
Then, we’ll break down other factors to help you figure out if you should fork over the cash.
Table of contents
13 key features of Google Analytics and Google Analytics 360
What follows isn’t an exhaustive list of feature differences; they are, however, those that we’ve seen have the biggest influence on a buy-or-don’t-buy decision for Google Analytics 360.
We’ve broken them down into three categories:
- Data collection;
- Customization;
- Integrations and data import/export.
A. Data collection
When upgrading to Google Analytics 360, you don’t need to retag your pages. Your hits will continue to be collected via existing Google Analytics tags.
You will experience, however, plenty of other changes.
1. Service-level agreement
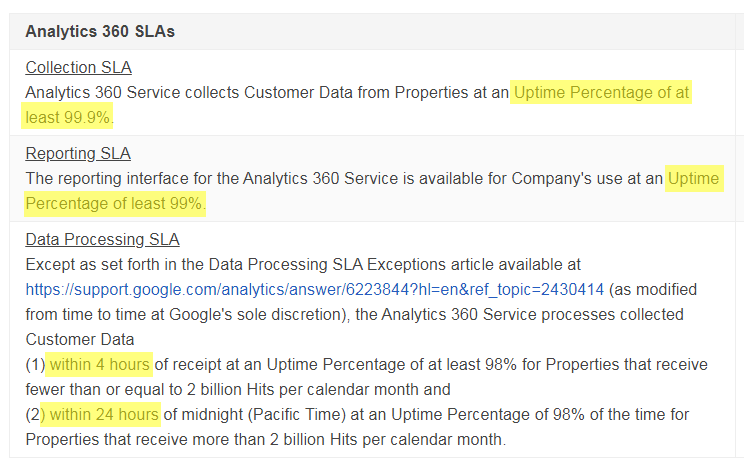
A main difference between the free and paid versions of Google Analytics is that the paid version, Google Analytics 360, has service-level agreement (SLA) obligations, guaranteeing 99.9% uptime, support, and data freshness.
The data freshness period for Google Analytics is 12 to 48 hours (depending on the intensity of your traffic), but it goes all the way down to 10 minutes to an hour for most reports in Google Analytics 360.

2. Hit limits
Hit limits in Google Analytics 360 are also higher than in the standard version: around a billion hits per month (and even more for an additional fee), compared to just 10 million for the standard version.

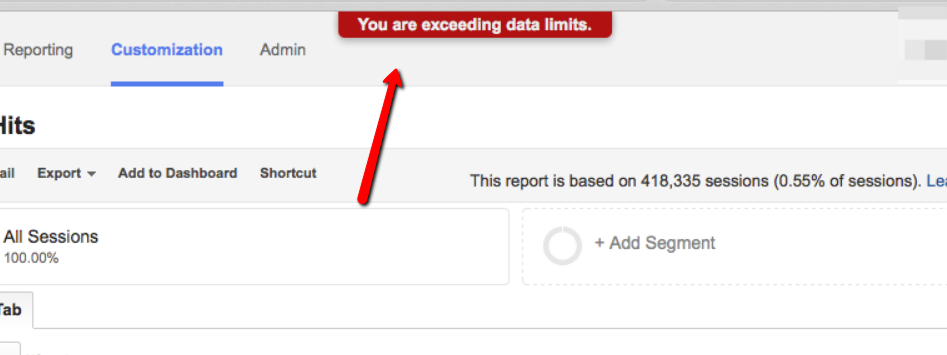
When you approach the 10-million-hit limit, Google Analytics starts to warn you and offers a few options to resolve the situation:
- Buy Google Analytics 360;
- Send fewer hits;
- Perform app tracking using Google Analytics for Firebase (or switch to Event tracking using the beta version of Google Analytics App + Web).
An unpleasant effect of exceeding the hit limit in Google Analytics is that “you may be prevented from accessing reports,” as the data limits support article warns. Google may also stop processing data beyond that limit:


An increased hit limit is one of the most common reasons for companies to consider Google Analytics 360. Over the past 10 years, about 90% of the companies that have contacted us were considering Google Analytics 360 primarily to avoid the hit limit.
3. Views per Property
The limit of 50 Properties and 25 Views per Property in the free version of Google Analytics may also be too tight for a growing business. (There are some workaround solutions here.) By comparison, Google Analytics 360 generously offers more than 50 Properties along with 400+ views per Property.
More Properties and Views per Property gives companies the freedom to be creative with cross-domain tracking, filtering, and dicing data from all their websites, apps, and other properties. Google Analytics 360 works well for international companies with tens of brands, big retailers, agencies, etc.
4. Roll-up reporting
Thanks to the roll-up reporting feature in Google Analytics 360, you can grab the data you need from both web and app properties based on a certain parameter (e.g., English-only audience, those who saw your last ad campaign, etc.).
The feature tracks your customers’ Client IDs or User IDs through different sources.
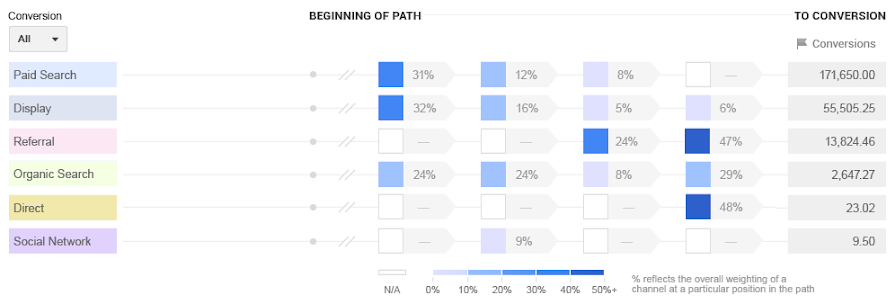
5. Attribution modeling
There’s no single way to analyze the efficiency of traffic sources in Google Analytics 360. For analyzing advertising channels, you may use the attribution modeling feature that’s part of the new data-driven attribution model, which was created exclusively for Google Analytics 360.

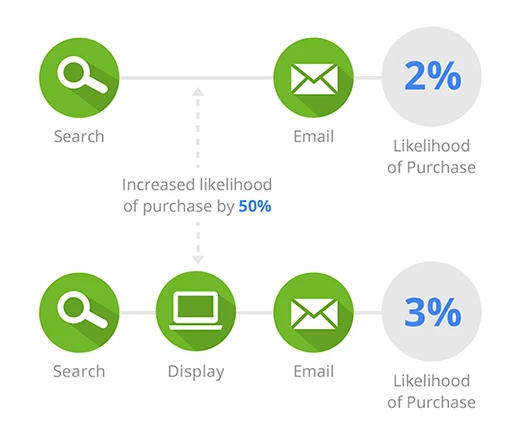
In the free version of Google Analytics, the standard position-based attribution models often under- or overestimate the value of channels. Even the most popular model, Last Non-Direct Click, won’t give you essential insights on how to redistribute your budget. (Those models are enough to get acquainted with the basics of attribution.)
Unlike Google Analytics, Google Analytics 360 presents a multi-channel attribution model that learns from your data on advertising channels. Google Analytics 360 shows you how channels contribute to the growth of conversions and how they interact, but it doesn’t take into account your order performance, call center activity, or brick-and-mortar sales.
How precisely does this model work? Only Google knows. But that black-box functionality is still acceptable for Google Analytics 360 users who:
- Have enough traffic and conversions (600+ conversions within 30 days).
- Use Google Ads actively and have more than 15,000 clicks on Google search.
- Want a reliable solution based on internal data.
Google Analytics 360 allows you to download your whole attribution model as a CSV file to rebuild it or conduct further analysis. Remember that you have to feed this model with regular traffic and conversion data for the results to be representative.

Also keep in mind that your attribution model can be rebuilt only once a week and can take into account only data from the past 90 days.
Ultimately, while the Google Analytics 360 attribution options are great for working with data-driven attribution models, they won’t help companies that want a transparent mechanism and clear logic for attribution calculations.
6. Ad cost attribution
Ad cost attribution can’t be calculated per user or per user segment in Google Analytics or Google Analytics 360, and you can’t get info on how much it costs to acquire a user who made a particular purchase.
The root of this problem is hidden in the logic of both tools. All data—even data stored in BigQuery—is already aggregated after collection via Google Analytics tags, so it’s impossible to go to the hit level to learn more about your customers.
B. Customization
7. Unsampled reports and custom tables
Unsampled reports and custom tables in Google Analytics 360 are great for those who are tired of the yellow warning sign that indicates sampled data in reports built on 500,000+ sessions in Google Analytics (or even 100,000+ sessions depending on the number of additional parameters).
If you’ve seen this warning a thousand times, then you’ve outgrown Google Analytics. Google Analytics 360 has a 100-million-session ceiling that’s harder to reach.

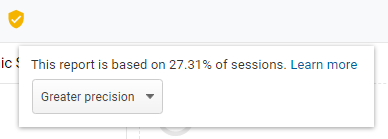
On those rare occasions when you do encounter sampling in Google Analytics 360, you can download any report in an unsampled format (up to 3 million rows for Google Analytics 360 versus only 50,000 for Google Analytics).
Alternatively, you can build a custom table for ongoing reports for which you want to see unsampled data, or you can use the Google BigQuery integration to build the report you need with an SQL request.
You can have up to 100 custom tables in Google Analytics 360, with up to 1 million unique rows in each.
8. Custom dimension and metrics
With Google Analytics 360, you can have 200 custom dimensions and 200 custom metrics. In Google Analytics, you have one-tenth the number—20 custom dimensions and 20 custom metrics.

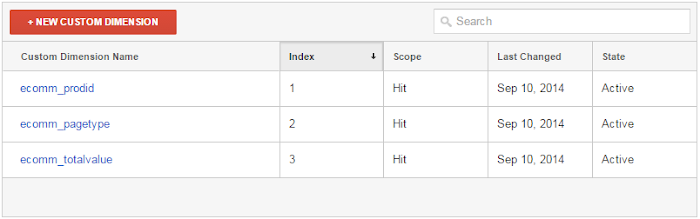
Having more custom dimensions and metrics is useful for analysts who like to build lots of audiences for remarketing, email, and experiments on new cohorts.
(You should also check out Google’s new App + Web tool, which offers Event tracking logic. App + Web can track up to 500 custom Events and standard Events per app instance, which is awesome.)
9. Custom or calculated metrics
Custom or calculated metrics are a must if you need to observe a range of marketing parameters (like specialized lifetime value or improved customer acquisition costs) to improve your performance.
You may build up to 50 calculated metrics across all Google Analytics 360 Properties.
10. Custom funnels
Custom funnels are the most important feature in Google Analytics 360 for those who use funnels as the main tool for customer journey analysis.
A custom funnel allows you to add or delete steps, personalizing the funnel to match (or, at least, better approximate) your real customer journey. With custom funnels in Google Analytics 360, you have a tool with five available steps and five different rules to modify them.

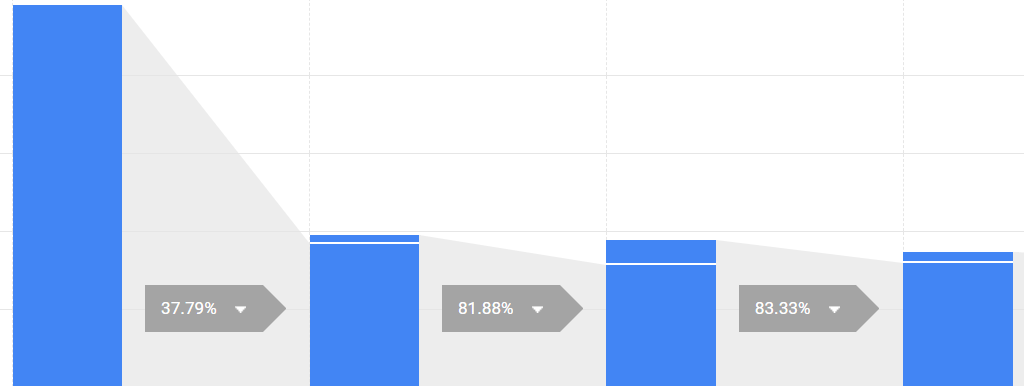
Each step can be analyzed for bottlenecks and obstacles, or can be tested to see how certain pages help or hinder customers on their way to making a purchase.
In the free version of Google Analytics, you can’t customize funnels.
C. Integrations and data import/export
11. Query time import
Query time import is a beta feature in Google Analytics 360 for those who want to improve historical hit data with imported data (e.g., offline data) from other sources and immediately build reports on it. It makes your reporting datasets more comprehensive.

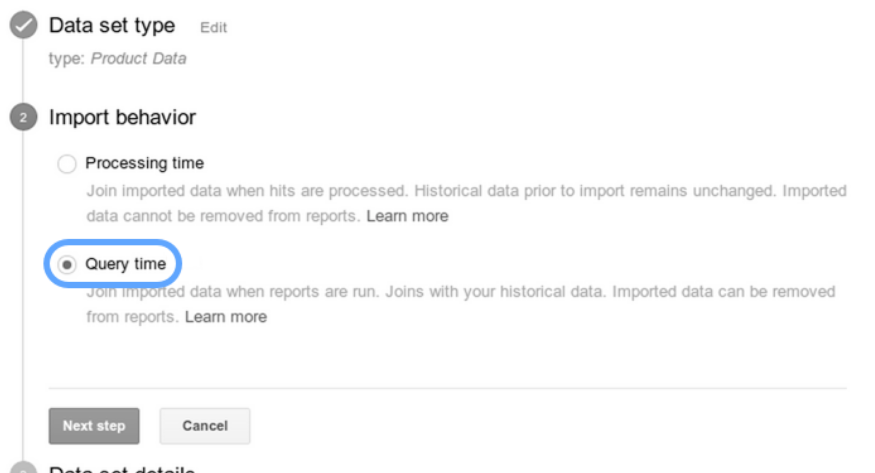
For example, if you want to build a report on your last big advertising campaign (for which offline points-of-sale identified new customers), you have to use query time to import offline data into the hit sets for a certain period. By combining historical hit data with offline data, you can reveal the campaign’s true effectiveness.
Admittedly, this functionality is tiresome to use—no automatic import is available and you have to launch the query time import tool each time you need a report. This annoys even the biggest fans of Google Analytics 360.
12. Integrations
Integrations are the second most important cause for upgrading to the paid version of Google Analytics. If you plan to use certain tools, then Google Analytics 360 is the best choice for you as a single point of truth for your analytics system.
Google Analytics 360 has native integrations with:
- BigQuery. An enterprise data warehouse for fast SQL queries.
- Salesforce. A cloud-based CRM system.
- Search Ads 360 (formerly DoubleClick Search), Display Video 360 (formerly DoubleClick Bid Manager), Campaign Manager (formerly DoubleClick Campaign Manager). Tools for comprehensive search and creative ad campaign management.


These integrations multiply the value of Google Analytics 360 by:
- Making it possible to use the same metrics for all channels, touchpoints, and platforms;
- Providing new reports based on Search Ads 360 and Display Video 360 data with special metrics for campaign optimization;
- Delivering keyword sets and audiences from Google Analytics 360 for better targeting in Display Video 360;
- Giving access to raw data from BigQuery (though it’s still aggregated);
- Integrating with Salesforce to improve attribution and enrich your website data with sales data.
All of these features are available in Google Analytics but only through third-party tools, not in the native, automated format in Google Analytics 360. (Search Ads 360 and Display Video 360 still can be tracked without Google Analytics 360 thanks to Floodlight.)
The audience possibilities are extremely important here—typically, within Google Analytics, you can’t export keywords, social, or other kinds of data on the path of the customer to your website. But with Google Analytics 360, you can do this with built-in tools and native integrations.
13. Post-view conversions
Post-view conversions—the golden dream of marketers who use media ads—are reported only at the campaign level with the help of Ads Data Hub. To overcome this challenge, you have to export DT files and run custom reports. Google Analytics 360 isn’t the best tool for that.
Features aside, the answers to a few questions can help you find out if your company would benefit from Google Analytics 360.
Which is right for you: Google Analytics or Google Analytics 360?
Based on our experience as a major Google Analytics 360 partner and reseller, companies that benefit from Google Analytics 360 have the following characteristics:
- They have more than 50,000 website visits per day, or they’re seeing an alert about exceeding the limits of the free version of Google Analytics. If you want to keep your analytics system stable and consistent, avoid reaching any kind of limits. With Google Analytics 360, you’ll increase your limits substantially.
- Data sampling and delayed data availability interrupt their work. For example, you may hit data freshness limits in your reports or see the sampling flag. This means data collection isn’t consistent, and you can’t make reliable decisions based on your reports.
- A return-on-ad-spend (ROAS) increase of at least 10% will bring an immediate jump in revenue. There’s a stage of company growth when increasing the advertising budget won’t bring expected revenue growth. At this stage, one way to grow is to improve ROAS. If your ROAS calculation shows that improving advertising efficiency is your growth zone, then Google Analytics 360 is a good choice.
Companies should reconsider their need for Google Analytics 360 if:
- They don’t do proper UTM tagging. If you still haven’t set up UTM tags correctly, don’t even think about Google Analytics 360. The whole system of reports, attribution, cohorts, segments, and other features will be a pile of expensive junk without correctly configured UTMs.
- The security department forbids setting up Google Analytics 360 due to privacy concerns. Some companies that are ready to implement Google Analytics 360 can’t because of security requirements. If your security department requires you to do everything in-house, marketing analytics is still possible with other tools, just not Google Analytics.
- They don’t trust data they haven’t manually added to the database using SQL. If you’ve built your analytics system manually, and Google Analytics wasn’t in your analytics starter pack, you may call into question the completeness of data. That’s your right. But SLA obligations aren’t just words on paper; they’re backed by Google’s reputation.
Google Analytics 360 is not enough on its own in the following situations:
- Companies need to analyze cost data at the user level. This is not possible due to Google Analytics 360 restrictions. It often happens that companies that have reached the greatest level of data granularity in the Google Analytics ecosystem still want to know more about their customers.
- The black-box nature of Google Analytics 360’s data-driven attribution modeling doesn’t meet expectations. Attribution modeling involves lots of experiments, and trying new models is essential to find one that fits your business. The Google Analytics 360 model is questionable for those who want a transparently calculated attribution model.
Other serious limitations of Google Analytics 360 that should be considered before purchasing:
- No reprocessing is available. Revenue displayed in Google Analytics 360 isn’t reliable—no data on returns or canceled orders can be included. This is partly solved in BigQuery for manual reports, but it’s not solved in the Google Analytics 360 ecosystem.
- Search Ads 360, Display Video 360, and Campaign Manager integrations can help companies with remarketing and view-through conversion reports built at the campaign level, but not with analyzing banner efficiency for segments and individual users.
Conclusion
When comparing Google Analytics and Google Analytics 360, consider the following:
- Google Analytics 360 offers an expanded stack of basic Google Analytics features. It’s a level-up version for those who want the same Google Analytics services, only advanced.
- Google Analytics 360 still has hit limits, integration difficulties, lack of access to historical data, etc.
- You can’t collect raw and unaggregated data or perform a customer-level drill-down, even with Google Analytics 360. This is a real problem if you’re aiming to personalize marketing.
- A variety of potential integrations matters more than the offerings of any one analytics tool.
Working on something related to this? Post a comment in the CXL community!
Related Posts
-

For many, Google Analytics 360 is a black box. Marketing and sales collateral from Google…
-

After reading some subscriber feedback, we noticed that many CXL readers didn't have a solid…
-
A/B testing tools like Optimizely or VWO make testing easy, and that's about it. They're…
-

This post is not a dry feature-by-feature comparison, nor does it include a winner-take-all verdict.…
