

If you ever ran a highly trustworthy and positive a/b test, chances are that you’ll remember it with an inclination to try it again in the future – rightfully so. Testing is hard work with many experiments failing or ending up insignificant. It’s optimal to try and exploit any existing knowledge for more successes and fewer failures. In our own practice we started doing just that.
In 2017 we systematically started to categorize similar test results as patterns to help us better predict more winning tests. In 2017 we ran 51 a/b tests that were purely pattern driven and 71% of these tests were positive at the time of stopping. It is now becoming clearer to us that patterns are a powerful tool for predicting test results and I want to share our approach with you. Here is the process that we follow to identify and use patterns for a higher win rate.
Table of contents
- The Goal: Better Than 50/50 Randomness
- The Pattern: Core Elements For Prediction
- Good, Bad And Better Patterns
- Generating New Patterns
- Using Patterns To Optimize A Web Site
- Do Patterns Work? Promising Results From 51 A/B Test Predictions
- Do More Repeatable Tests Lead To A Higher Prediction Rate?
- Conclusion
The Goal: Better Than 50/50 Randomness
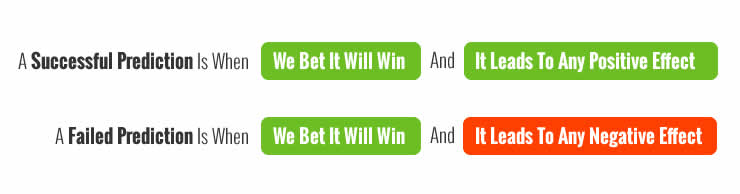
First of all, if we’re aiming to improve our a/b test results prediction rate, then we need to set up a measuring stick for what a successful prediction really means. The simplest answer to this is a binary one – that is whether a test that should have been positive or negative, ended up being positive or negative as predicted.

In other words we are simply trying to do better than randomness. Assuming we ran completely random experiments we might expect that approximately half of our results would end up positive and the other half would be negative. From this perspective our starting goal is humble: to show predictive strength, our patterns need to help us beat randomness and achieve a better win/loss rate than 50/50.
The Pattern: Core Elements For Prediction
I define conversion patterns as easily repeatable UI changes that allow us to predict and repeat effects quickly. Given a pattern we can tactically spot an opportunity (a weak headline, too many form fields, an inauthentic photo, poor visibility of choices hidden away in a pulldown, etc.) and take rapid action to exploit their probable effects. The predictive strength of such patterns comes from one simple assumption: the more a given change performs with similar effects, the more it will perform again in the future with a similar effect. Hence, patterns ultimately obtain their predictive strength from multiple test results – the more the better. The elements of a pattern that make these predictions possible include:
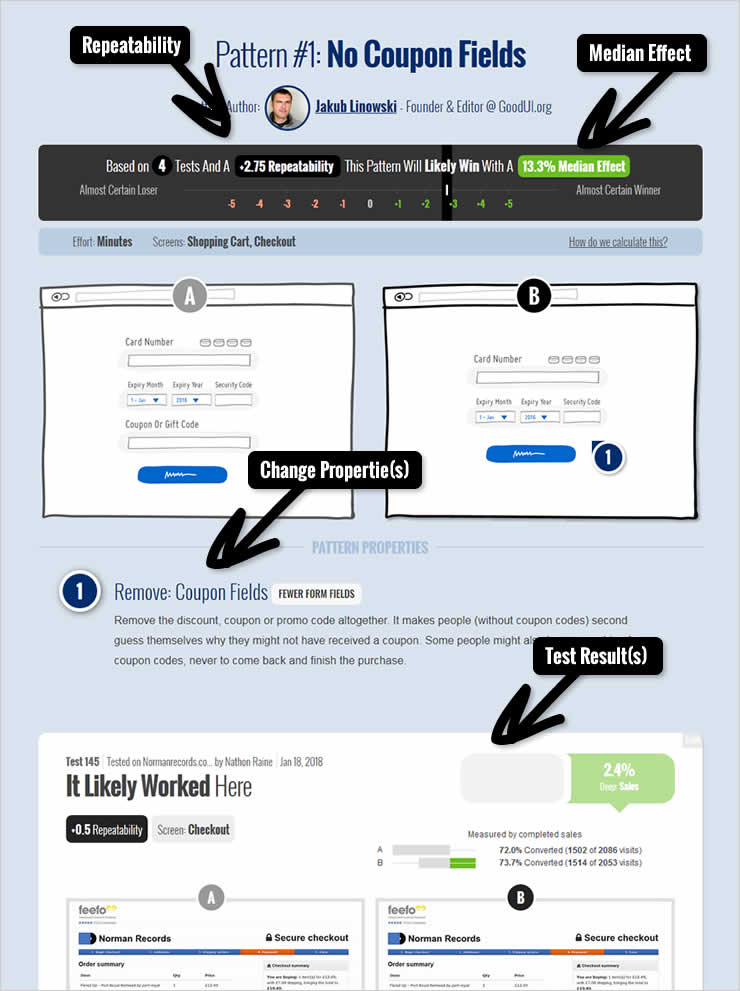
- The Change(s) – a set of properties (one or many) that define the pattern and are abstract enough to make them repeatable. Typically the changes can involve removing, replacing, or adding something new to the UI. Often the change is portrayed with the help of two screenshots: A (before, or the control) and B (after, or the variation).
- Test Result(s) – each pattern gains its predictive strength from test results (the more the better). Tests in turn provide us with two key metrics: repeatability & median effects.
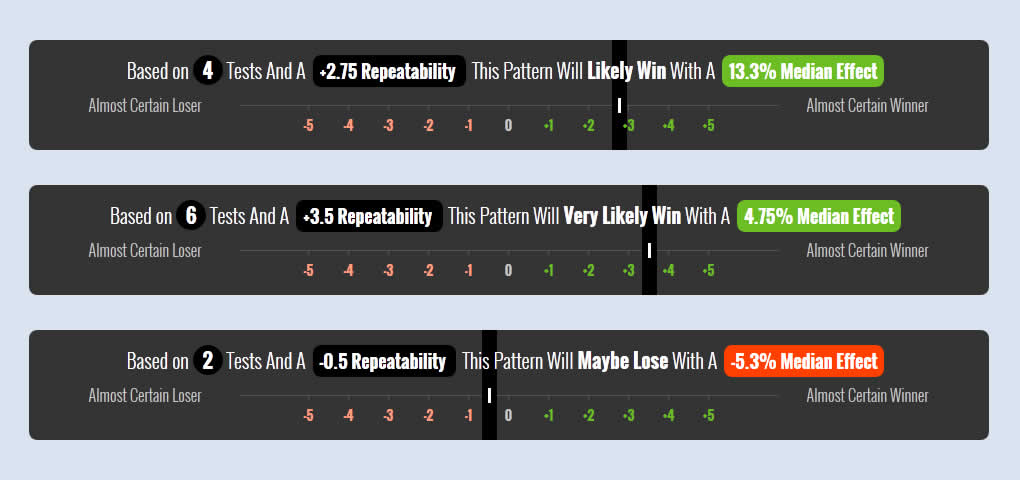
- Degree Of Repeatability – this is a measure of how often a pattern has been tested with winning (positive) results, minus the number of any negative test results. The higher this score (either positive or negative), the more likely the pattern will repeatedly win or lose in future experiments. For patterns that don’t have any test data their repeatability score is a neutral 0.
- Median Effect – the median effect tell us what effect we might expect from a similar change on a future test. It is calculated from the deepest effects of each test related to a pattern (ex: most meaningful measures such as a signups, lead or sales). The more tests that we have for a given pattern, the more accurate the median effects should become.
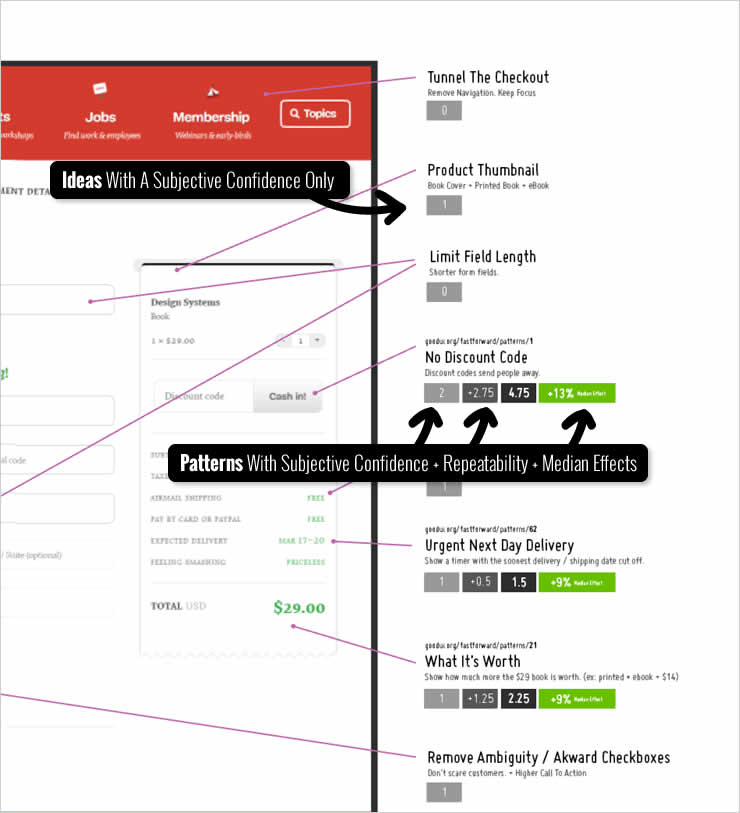
Here is a sample No Coupon Fields pattern and how we tie all of these elements together:

TECHNICAL NOTE: to compensate for test results with different degrees of confidence we attribute a full 1 repeatability point for a highly significant test result (p-value < 0.03), a 0.5 point for any suggestive results (p-value < 0.25), and 0.25 points for any insignificant results (p-value > 0.25) or test results without complete sample size data.
Good, Bad And Better Patterns
As patterns accumulate test results they quickly drift away from innocent neutrality. Those patterns that perform more positively than not, gain in their degree of repeatability (with a higher likelihood to win again). Other patterns might win and lose similarly, staying close to 0 and hinting at a lower probability of success. Finally, those patterns that tend to lose more often than not, will have a negative repeatability suggesting that they aren’t such good ideas after all.
The better patterns therefore can be defined by two criteria: they contain a high degree of repeatability and a high median effect.
Generating New Patterns
Pattern ideas can come from anywhere. The source of a pattern idea however isn’t that important as all new patterns are created equal (with a netutral repeatability of 0). Instead, it’s the test results that provide patterns with their predictive power, charging them negatively or positively. Considering the above, here are some ways by which we generate new patterns:
- Imagination, Pen & Paper – your experience and your creative process can be a valuable source of interesting pattern ideas. Sometimes we simply take a piece of paper and sketch our ideas. We don’t worry too much about forcing ourselves to come up with perfect ideas. We know that however exploratory the patterns are, their potential will eventually come through as they become tested.
- Your Own A/B Tests – when you finish running an a/b test, this is a perfect opportunity to capture the change (or set of changes) as a pattern. No matter what the effect was, nor the degree of confidence, each a/b test contains valuable data that has the potential to repeat in the future. In this case you can design a new pattern and already have initial data for or against your pattern – giving your pattern an advantage.
- Other People’s A/B Tests – there are a/b tests that companies share publicly and these can be another valuable starting point for a pattern. Granted that it’s more difficult to trust other people’s result given the presence of publication bias (tendency to report the positives more than the negatives). At other times, published results also lack detailed sample sizes or conversion data which makes it more difficult to assess their quality. In this case we attribute a lower repeatability score (only 0.25) to compensate for the lack of complete data.
- Customer Research – any qualitative research where real customers or users express their needs can be a valuable source of inspiration for new pattern ideas. This includes any methods such as: surveys, usability studies, interviews, screen recordings, etc.
- Copying Sites That Optimize – finally, it’s always worthwhile to pay attention to web sites that you know are running experiments and actively optimizing. Chances are that whatever changes they have implemented, have gone through some kind of experimentation and therefore may have slightly higher chances of succeeding in the future.
Using Patterns To Optimize A Web Site
STEP 1: Finding Opportunities
When we set out to optimize a set of screens using patterns, our focus is on identifying as many optimization opportunities as possible. We do this by defining a set of screens and metrics to improve. At the same time we remind ourselves of all existing patterns to inspire ourselves with a wide set of common changes. We might also look up more specific pattern types by page type (ex: checkout patterns) or by metric (ex: lead-gen patterns). It doesn’t really matter in which order you begin the process. What does matter is to have the screens, goal metrics and patterns visible in front of you so that you see and capture the opportunities – the more, the better.
Practically we might use Adobe Illustrator (any screen annotation software is fine) to list out the relevant screenshots and annotate them with ideas on the sides like this:

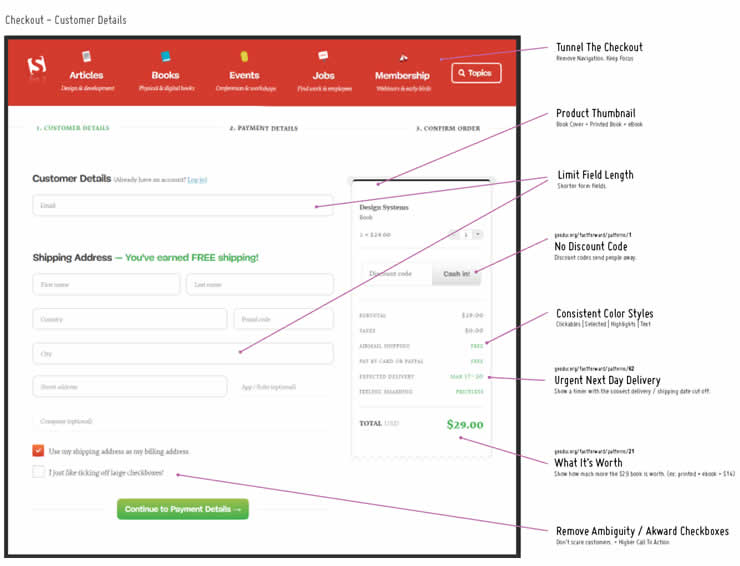
If we have an idea for which we don’t yet have a pattern, we still capture it (without any data references of course).
STEP 2: Prioritizing With Repeatability & Median Effects
Once we list out enough ideas (usually 10 to 100) we then weigh them to see which have the highest probability of success and the highest impact. To do this, for each idea which is based on a pattern we look up its repeatability and median effect and write it down beside the idea. By doing this we officially make a prediction using real data, while our prioritized ideas may start looking like the following:

Optionally, we might also add a subjective confidence for each idea. If we do chose to do this, we limit our confidence to a range between -3 (highest confidence that the idea will be negative) and +3 (highest confidence that the idea will be positive). And if we have multiple team members expressing their subjective confidence we average these values to tap into crowd intelligence.
STEP 3: Designing Tests & Exploring Variations
Once our ideas are prioritized and we start seeing what has the most potential, we continue on with more detailed concepting. Looking at a pattern and seeing an A and B we don’t want to be mislead that this is the only way of applying a given pattern. For every A and B, there is a C, D, E and F just around the corner waiting to be discovered. Here is where we get creative and generate visual alternatives. We might even look through past tests to check for more specific examples where a pattern worked and where it failed.
Not all sketched out ideas become selected into a test, but we definitely like to have more to choose from. Our final visual is a solid test concept containing a series of variations (1 or many) with the exact changes (1 or many) that will go into testing, looking similar to:

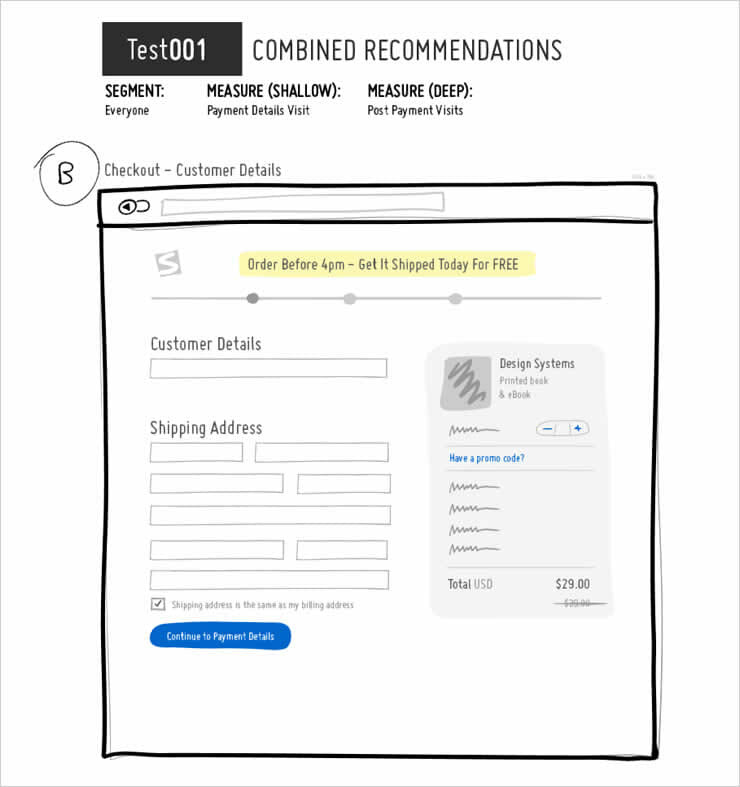
NOTE: You always have an option to either test an idea or directly implement it at this stage. Given enough confidence (subjective or from enough positive tests) we respect the decision to skip testing and directly roll out changes on production (implementation). Exploiting knowledge in such a way although caries risk, is a valid optimization move (depending on the business context: statistical sensitivity, site traffic, predicted impact, degree of confidence, etc).
STEP 4: Feedback Loops & Correcting The Data
When we decide to run a test based on a pattern there is one last element that is critical to complete the process – we update the pattern with the new result. More specifically, both the repeatability score becomes updated (either positively or negatively) and so does the median effect change for better or for worse.
This happens for any test result independent of the effect and independent of the degree of significance. It’s important to remember and learn from any results no matter what the outcome (unless there was technical test setup issue which invalidates the experiment). This feedback mechanism is what makes future predictions more and more accurate with each new test result, further separating the better patterns from the weaker ones.
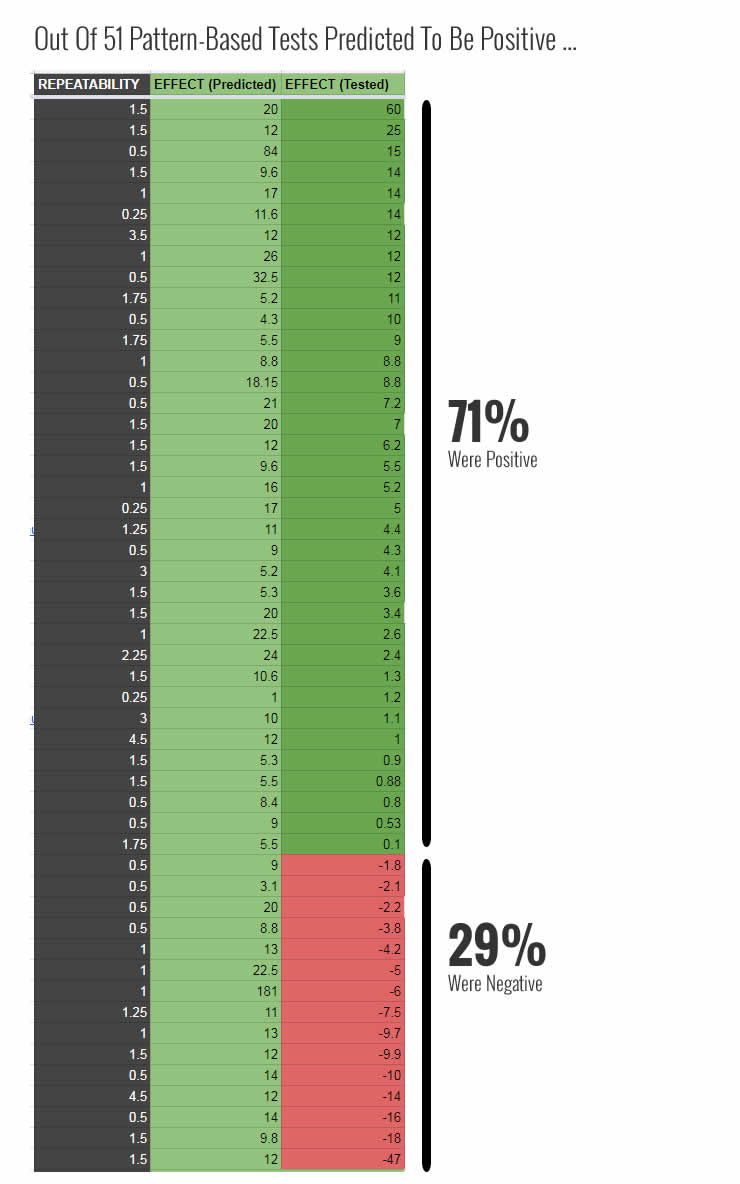
Do Patterns Work? Promising Results From 51 A/B Test Predictions
But how does such an approach perform on real projects? In order to assess if patterns have any predictive power, in 2017 we began tracking our own predictions across numerous optimization projects. We ran and tracked 51 such a/b tests that were strictly pattern driven and here are the exciting results we found.
Out of 51 experiments which were all predicted to be positive (with any positive repeatability scores), 36 of these experiments ended being positive at the time of stopping. This placed the prediction rate of these patterns at 71%. Using patterns in this way clearly helped us move away from a 50/50 success rate suggested by randomness. Hence we have a very positive outlook towards patterns (based on experiments) as a very effective way in running more winning a/b tests while minimizing effort in general. This is inline with business expectations of clients who aim for the highest impact results with the lowest possible effort (maximum ROI).

Do More Repeatable Tests Lead To A Higher Prediction Rate?
There is one more key question that we can ask ourselves in order to check if repeatability is a reliable predictor of test outcomes: does a higher repeatability score lead to more positive test predictions? In other words, if a pattern performs positively more frequently, does that mean that it has better chances of performing positively again in future experiments? To answer this question we organized our predictions by three sets of repeatability scores (reminder: the higher the score, the more positive evidence we have in favor of a pattern). Here is what we found:
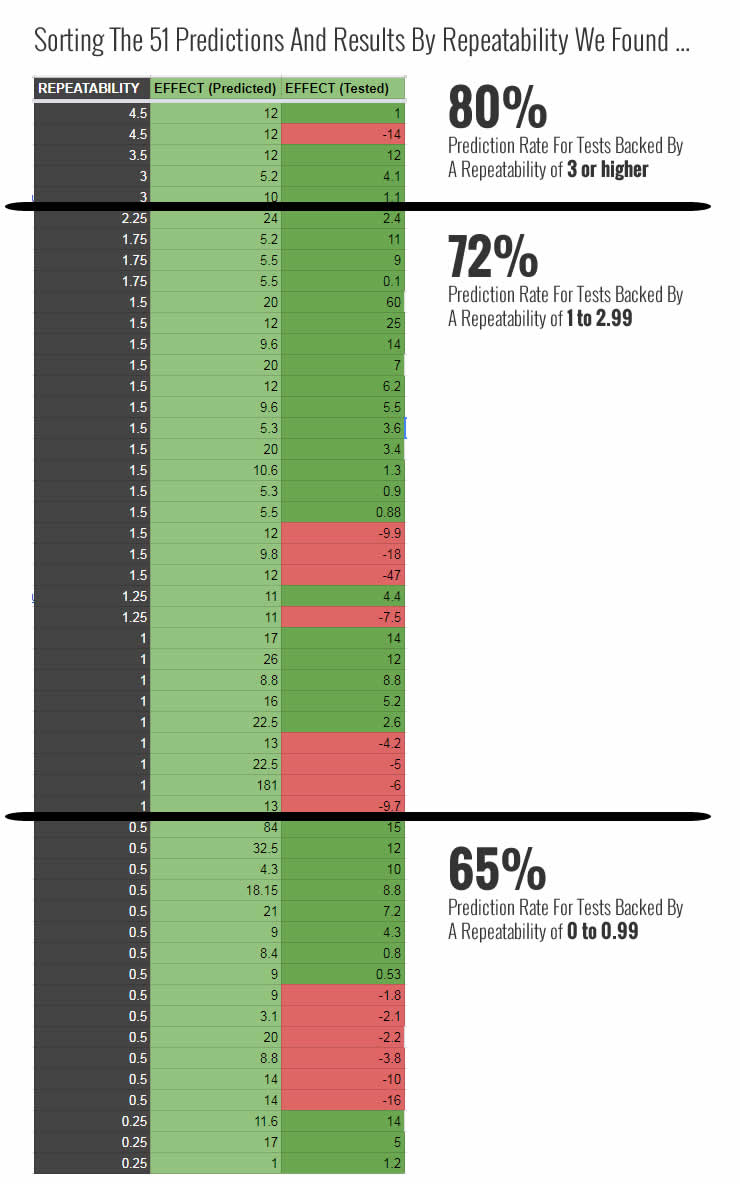
We are seeing a clear indication that the more evidence we have in favour of a pattern, the greater our prediction rate. Our prediction rate is increasing linearly with the degree of repeatability. This is our most promising finding from 2017 in favour of continuing to identify and measure conversion patterns in this way. It’s also highly reassuring as it suggests that conversion patterns can be generalizable (perform across different websites).
From these findings we were more comfortable to add a layer of meaning to our repeatability score. We can always adjust it in the future as we collect more data and assess the accuracy of our predictions, but for now here is what we are starting with:
- Repeatability of 0 = May Win or Lose
- Repeatability of 0 < 0.99 = Maybe Will Win
- Repeatability of 1 < 2.99 = Likely Will Win
- Repeatability of 3 < 4.99 = Very Likely Will Win
- Repeatability of 5 < = Almost Certain To Win
Conclusion
Analysing solely individual a/b tests is limiting. We now see the value of looking at multiple experiments instead. Using patterns in the way we have outlined above is one of many ways that makes this leap possible. Patterns for us have become a powerful way of remembering multiple past experiments – critical in making more accurate predictions. The 71% success rate from last year is just the beginning. As we run and remember more experiments, our work should become easier. And pulling probabilities from past experiments ultimately will enable us to run more winning and higher impact tests.
What works for one site may not always work for another, as some skeptics like to say. But what works for one site, another, and another, will more likely than not work again somewhere else – remember and exploit this.
Related Posts
-

When should you use bandit tests, and when is A/B/n testing best? Though there are…
-

As a marketer and optimizer it's only natural to want to speed up your testing…
-

When should you use multivariate testing, and when is A/B/n testing best? The answer is…
-

One-tailed tests allow for the possibility of an effect in one direction. Two-tailed tests test…
