
When most people hear “web analytics,” they tend to think about counting visitors, transactions, and conversion rate on a transactional site, such as an eCommerce store.
Yes, there’s a lot of insight to be gained from web analytics for eCommerce sites, you can also learn a lot about B2B lead generation if you’re using analytics correctly.
Table of contents
Measuring the Performance of Informational Sites
Online performance measurement for informational sites can actually get pretty complicated.
The typical end goal for businesses with informational sites is to use the site to generate more leads. But that lead generation process usually isn’t streamlined into a sequential funnel like one would see on a traditional eCommerce site where visitors enter the site and go through a series of funnel pages to make a purchase.
B2B clients need multiple touches, more one-on-one conversations, and outreach through various channels in that process of converting them from onlookers to prospects to leads and eventually to customers.
From an online perspective, the lead acquisition funnel has three major steps – brand awareness, prospects acquisition, and lead generation. Let’s expand on the definitions of each:
- Drive brand awareness. The rule of seven says that seven touches are needed before a visitor will convert into a customer. Right or not, the concept that more than a single touch is needed to convince visitors to become customers is pretty compelling. And that journey starts with familiarizing visitors with your brand. This could happen on your site or on social media. More on this as we get deeper into measurable web analytics for B2B marketing sites.
- Acquire prospects. The amount of interest a visitor has in your site’s content is a reflection of the visitor’s interest in your services. And this interest is a crucial step before the person becomes a true lead. Monitor these prospects’ activity so that the site experience can be optimized for higher engagement and conversion.
- Generate leads. This one needs no exposition. A prospect turns into a lead when he or she expresses interest in your services through a variety of ways.
Measuring Brand Awareness
Brand awareness can be expressed in multiple ways.
It could be engagement with your brand on a social media channel such as LinkedIn or Twitter or it could be visits to your website itself. So a full picture of brand awareness can only be obtained by combining data from these sources.
To be clear, though, measuring brand awareness with the intent of tying it back to a tangible goal on the site is very difficult.
Sure, site interactions can be tied to a conversion goal. But impressions, clicks, and interactions on a social media site such as LinkedIn can only be anecdotally linked to conversion metrics on the site. Two major obstacles to measuring actions outside the site are isolated systems in which visitor data resides (e.g. LinkedIn analytics vs Google Analytics) and the number of touches that are needed before a measurable action results on the site.
So we can think of brand awareness as a funnel with the top of the funnel residing in external platforms with little or no ability to measure effectiveness and the bottom of the funnel being your website where you have a deep understanding of visitor interaction.
Here is one way of looking at this brand awareness funnel:
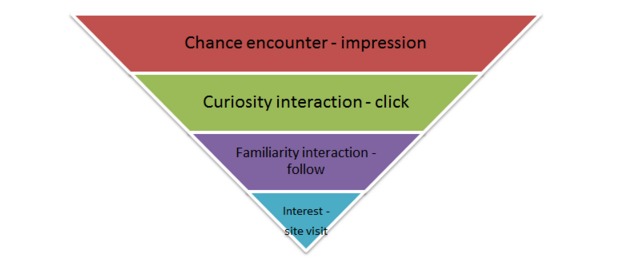
The first three interactions all happen on third party platforms and can be difficult to tie back to tangible results. These three interactions are vital and have a very strong influence on the fourth interaction, which is a site visit. However, it is only from the fourth interaction that the brand awareness funnel becomes easy to tie back to the overall goal of lead generation on a site.
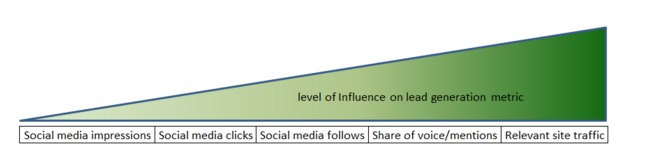
Here are some commonly used brand awareness metrics and their (direct) influence on a tangible business goal such as lead conversion:
So should you measure and action the brand awareness funnel? Absolutely.
But keep in mind that the measurable end goal should be a site visit and not a lead conversion. Each of these interactions can be considered a micro-conversion. These micro-conversions are important but may not directly influence a macro-conversion goal on the site. Optimizing for these micro conversions is important as long as you know how to measure the success of these conversions (i.e. they correlate with the larger goal of quality lead generation).
So while the top of the brand awareness funnel can be a bit nebulous to analyze, the bottom of the brand awareness funnel is site visits, and it is rich in actionable data.
Relevant Site Traffic
Relevant site traffic is very different from plain old site traffic. The difference is in knowing whether the site is being visited by the right audience. Of course, since web analytics traffic is largely anonymous, this key insight needs to be derived from a variety of factors.
Here are some key factors to consider:
- New vs repeat visitors – Was this traffic already aware of your brand or are they truly first time visitors?
- Geolocation of traffic – If you serve a specific geo location, for example the United States, then is the traffic to your site indeed from within your geo location target?
- Key pages visited – Are your visitors visiting pages that provide information about your brand’s services or products? Or are they just visiting an irrelevant page and leaving?
- Bounce rate – Are your visitors leaving without looking at more than one page on your site?
- Source of traffic – What channels are your new visitors entering from? Are your marketing efforts successful in driving new channel traffic?
One way of finding such user attributes is by using cohort analysis. Using it, you could create finer segments with varying levels of relevance.
Creating brand awareness is the beginning of your lead generation funnel, so it is vital to ensure that you are measuring the top of this funnel accurately. The above concepts can be easily applied in any web analytics software. Below is a screenshot of how you could construct a segment in Google Analytics:
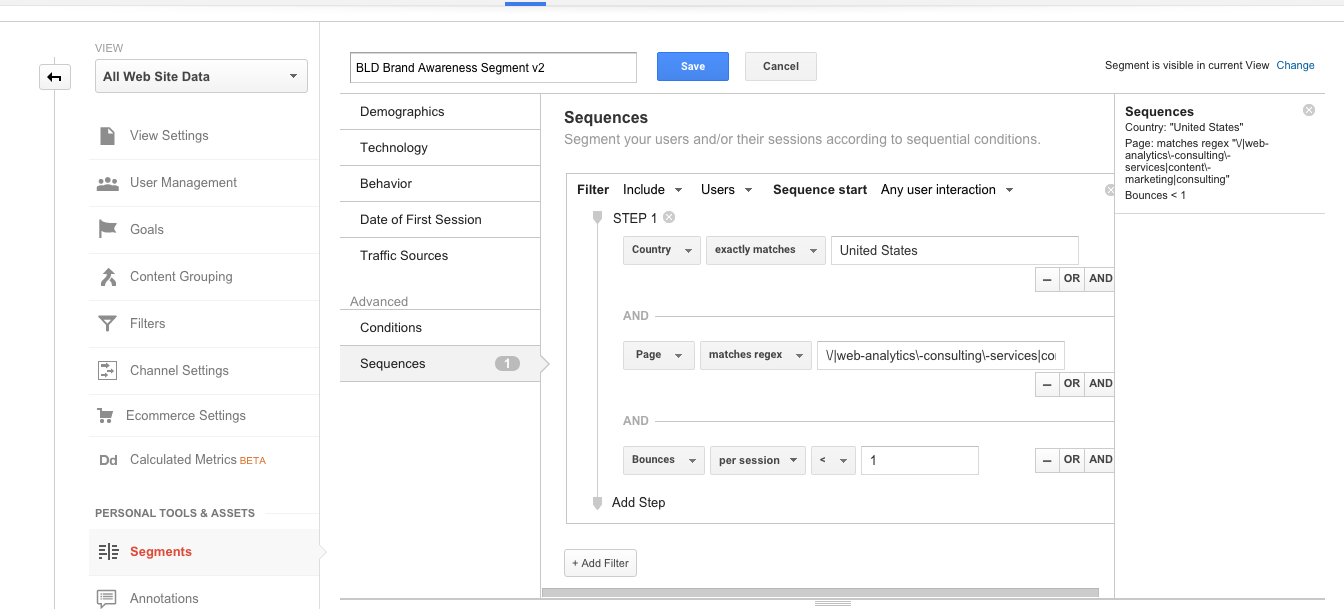
We use the above segment internally to measure brand awareness. This is a top level segment that combines all brand awareness efforts into a single view. This could easily be further segmented into brand campaigns that you may be running in specific channels or for specific services.
In the segment above, brand awareness is defined as traffic:
- Located in United States (the target market)
- That visited services pages (so they showed interest)
- That did not bounce (meaning they saw more than 1 page on the site)
This is a highly restrictive definition of brand awareness, but it really drives the point home that we are not interested in just driving any traffic, but specifically visitors displaying behavior tied to brand awareness. Using this approach, your web analytics measurement of brand awareness will transform from an unqualified high level metric to a highly actionable segmented metric.
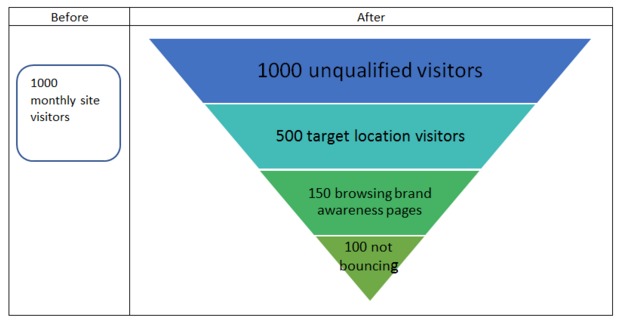
Now you can have a very informed conversation with your marketing team about the quality of their brand awareness efforts. Instead of talking about the number of visitors to the site, you can now talk specifically about your target market in the US, getting familiar with the services you offer, and becoming truly interested in what you have to offer.
But of course, measuring tangible brand awareness is just one third of the story. The rest is about how to convert these brand aware visitors into prospects and leads. Let’s take a look at how we can go about measuring this part of the conversion funnel.
Measuring Prospect Acquisition
The way you convert visitors into prospects is usually by providing them something of value. Often, that item of value is new and exclusive information. This information could be in the form of a white paper, a personalized calculation, or a personalized infographic based on information they share. The expectation is that these visitors will part with their contact information for this item of value.
So measuring prospect engagement revolves around understanding how well that popup, white paper, calculator, or infographic is doing to get the attention of your visitors. For prospect engagement, the macro goal is to get the visitor to part with their email address or phone number. Let’s say the tools you have at your disposal are guides that can be downloaded, popups that can be surfaced, and forms to submit information. So the funnel can be thought of as follows:
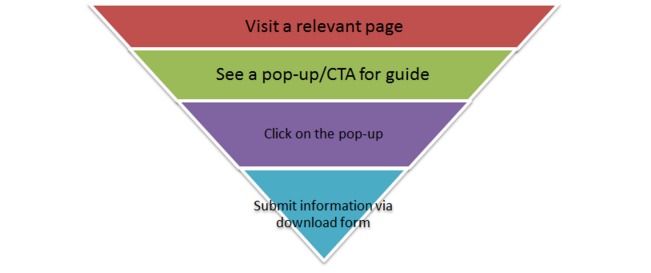
Prospect conversion can be measured by combining these micro conversion steps into a single equation. So the formula for prospect conversion would be:
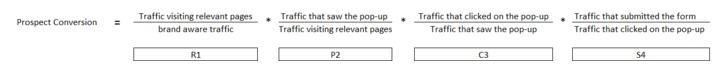
As you can see, there are four ratios that can be measured and optimized to improve the end goal of improving prospect conversion.
Let’s look at each of these ratios briefly:
- R1 measures the effectiveness of driving traffic to pages where popups will be displayed. Of course, this definition needs to be adjusted to meet your specific definition of important pages. Improving R1 involves making the key pages interesting and easily accessible, so your site’s visitors will visit them. Whether improving R1 directly improves overall prospect conversion is beyond the scope of this article, but this micro conversion debate is well addressed here.
- P2 is a ratio that measures the technical capability of displaying the popup on key pages. It is an important metric that monitors the process of displaying popups. A drop in this ratio could mean that the popup is not getting displayed as fast as it should on page render, exit intent, etc.
- C3 measures the effectiveness of the message and the design of the popup to compel your site’s visitors to click on it. This is a key ratio that can be improved with systematic testing for a variety of attributes of the popup such as messaging, call to action, etc.
- S4 is the rate at which the form to download the whitepaper is completed. Designing and optimizing forms is a science by itself. Form titles, calls to action, the number of fields, form validation are just a few attributes to take into account when building and optimizing forms. In fact, the web form design primer by Luke Wroblewski is a great resource to get ideas on how to optimize forms for conversion.
As you can see, the above four ratios can all be optimized to improve the overall prospect conversion process. In addition, one can apply a variety of segments to the prospect conversion measurement to identify segments that work or don’t work particularly well.
Indeed optimizing for better prospect conversion is key to successful B2B lead generation initiatives.
Measuring Lead Generation
The final step in this puzzle is to figure out how to measure the rate at which leads are acquired. Before we get into the details, let’s define leads one more time. Leads are those prospects that explicitly express an interest in your services.
Measuring lead generation actually goes well beyond the realm of web analytics and belongs in the customer analytics realm. Nonetheless, it is worth examining because leads are the ultimate macro goal that marketing teams strive for.
Let’s review the progression of prospects into leads. Once prospects are identified, they are then subsequently interacted with through a couple of different ways. For instance, the sales team could interact with them periodically via phone calls, the marketing team could keep them warm through email drip campaigns, or the prospects themselves could visit the site periodically to seek information. So prospects can be touched multiple times over extended periods of time.
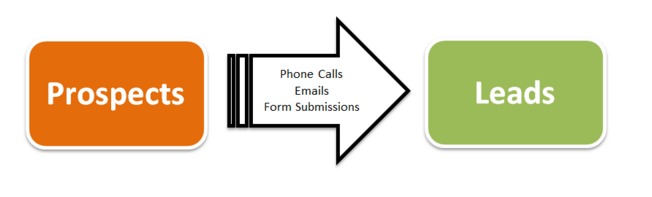
Then the prospects could turn into leads over the phone, via email, or even through form submissions on the site. The trick with measuring lead generation accurately is to summate lead counts across the acquisition sources. A CRM that is tightly integrated with these sources can definitely go a long way in making this task easier.
So although lead conversion can easily be expressed in a simple equation of leads/prospects, the number of touches, the channels through which the touches occurred, and the quality of these touches can all be used to segment and optimize the lead conversion rate.
For instance, we could establish the average number and quality of touches needed to convert a prospect into a lead. Then we would state a hypothesis about the number and quality of touches and design an A/B test that spans offline and online means to test that hypothesis.
The challenge here is that there are several moving parts in the lead generation process that can’t be strictly controlled as required in a traditional A/B test scenario. In testing lead generation, it is sometimes easier to focus on the micro actions to make incremental improvements.
Conclusion
Measuring the conversion funnel on an informational site can be just as complicated as measuring that for an eCommerce site. That said, web analytics can be leveraged very effectively to measure and to identify ways to maximize the lead generating potential of informational sites.
Related Posts
-

We often talk about online conversion optimization without mentioning that many businesses, especially B2B, rely…
-

An average website has a sales conversion of 1% to 2%. So it'd be fair…
-

Are you in B2B / lead gen? Qualifying leads a challenge? There's a new (non-enterprise)…
-
Today I'm reviewing lead magnets. Lead magnets are the key contributors to high email opt-in…

