


When shopping online, you can’t hold the product, test it out, or talk to a salesperson about how different brands compare to one another. For these scenarios, social proof is frequently used to guide shoppers towards the best product choice.
Which brings us to the real question: Which social proof techniques are most effective? Are some of them totally ineffective?
This study from CXL Institute explores how different forms of social proof are perceived (with eye-tracking), and then how they are recalled (with post-task survey questions).
Full Study Report: Which Social Proof Works Best?

Study Setup:
This consisted of 2 study tasks:
Study Task 1. We used eye-tracking to quantify user perception of the web page. We manipulated web hosting site Host Gator so it contained different social proofs.
A total of eight different types of social proof were tested along with a control variation, which had no social proof.
Social proofs were consistently placed in the same location on the web page so that all proofs were equally visible (see red box on the right image).
Participants were given 15 seconds to browse the page after being briefed by a task prompt:
“Imagine your friend has a new business and needs help finding a web hosting company. Please review the following web hosting web page as you normally would to see if you would recommend this service to your friend.”

Social proof variations tested:


The statistics we were primarily concerned with were time to first fixation (TTFF) and total time fixating.
Study Task 2. A 2-question survey determined whether each social proof got into the viewer’s short-term memory.
After viewing the web page, we asked users the following two questions:
- “Remembering the web page you were just on, were there any elements or parts that led to an increase in trust/value to you?”
- “Select which of the two webpages below you recall seeing:” (Here we showed two variations that were similar to each other e.g. high & low social following.)
If participants mentioned the social proof they saw in the first question or selected the correct treatment variation in the second, then that provided evidence of the social proof’s impression on the viewer’s short-term memory.
Findings
1. Eye-Tracking
Though heat maps are more common, we’re going to illustrate our findings with fixation dot maps.
Here’s a gif to show the difference between the dot map and heat map, where we can see that the dot map lets us see individual viewers fixating on the social proof area and the heat map doesn’t.
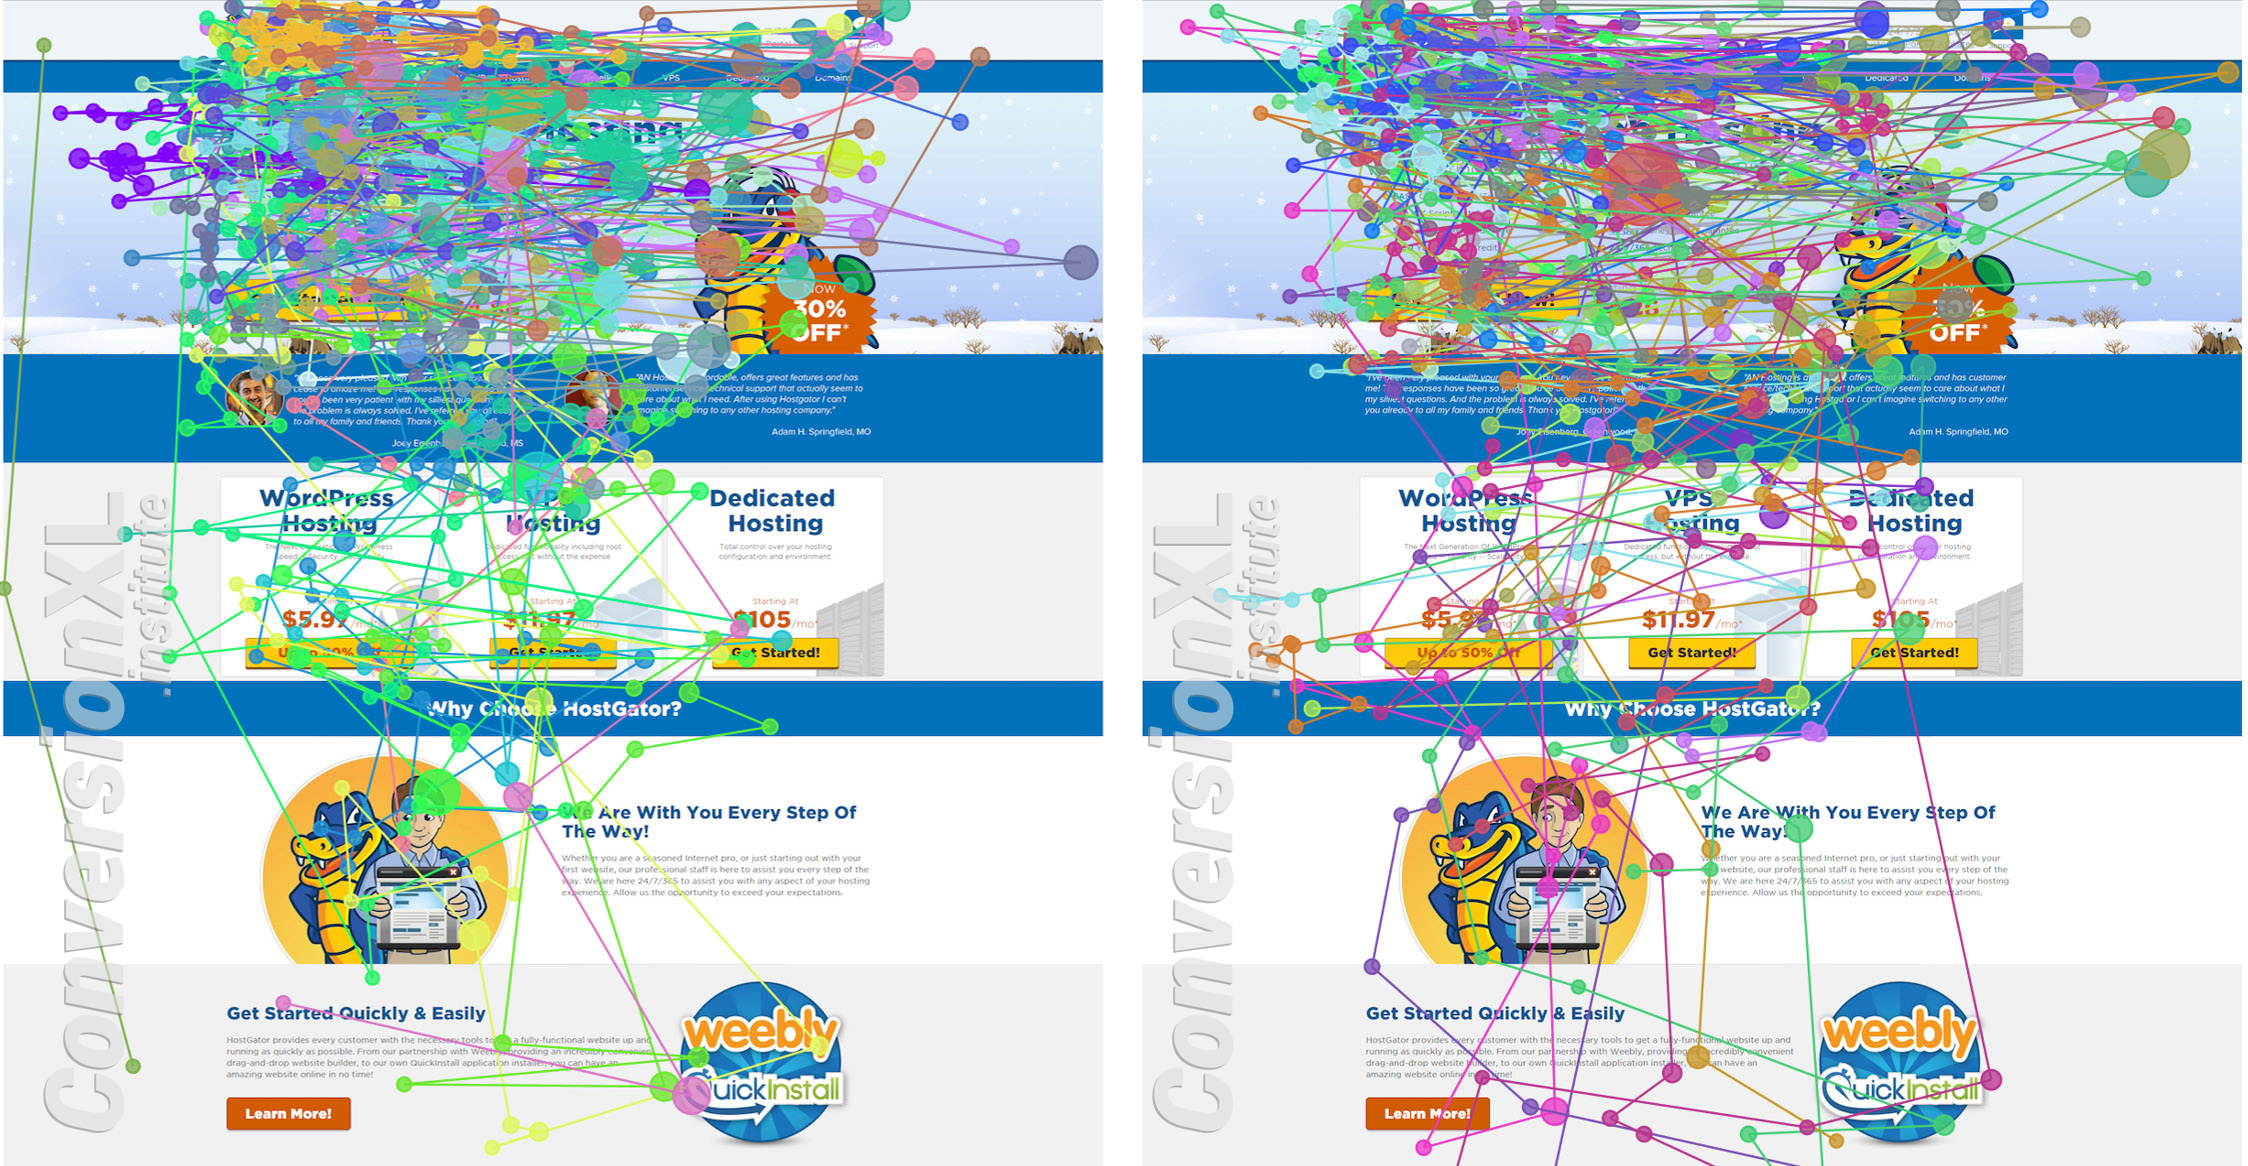
And here are the treatment dot map figures, paired accordingly:

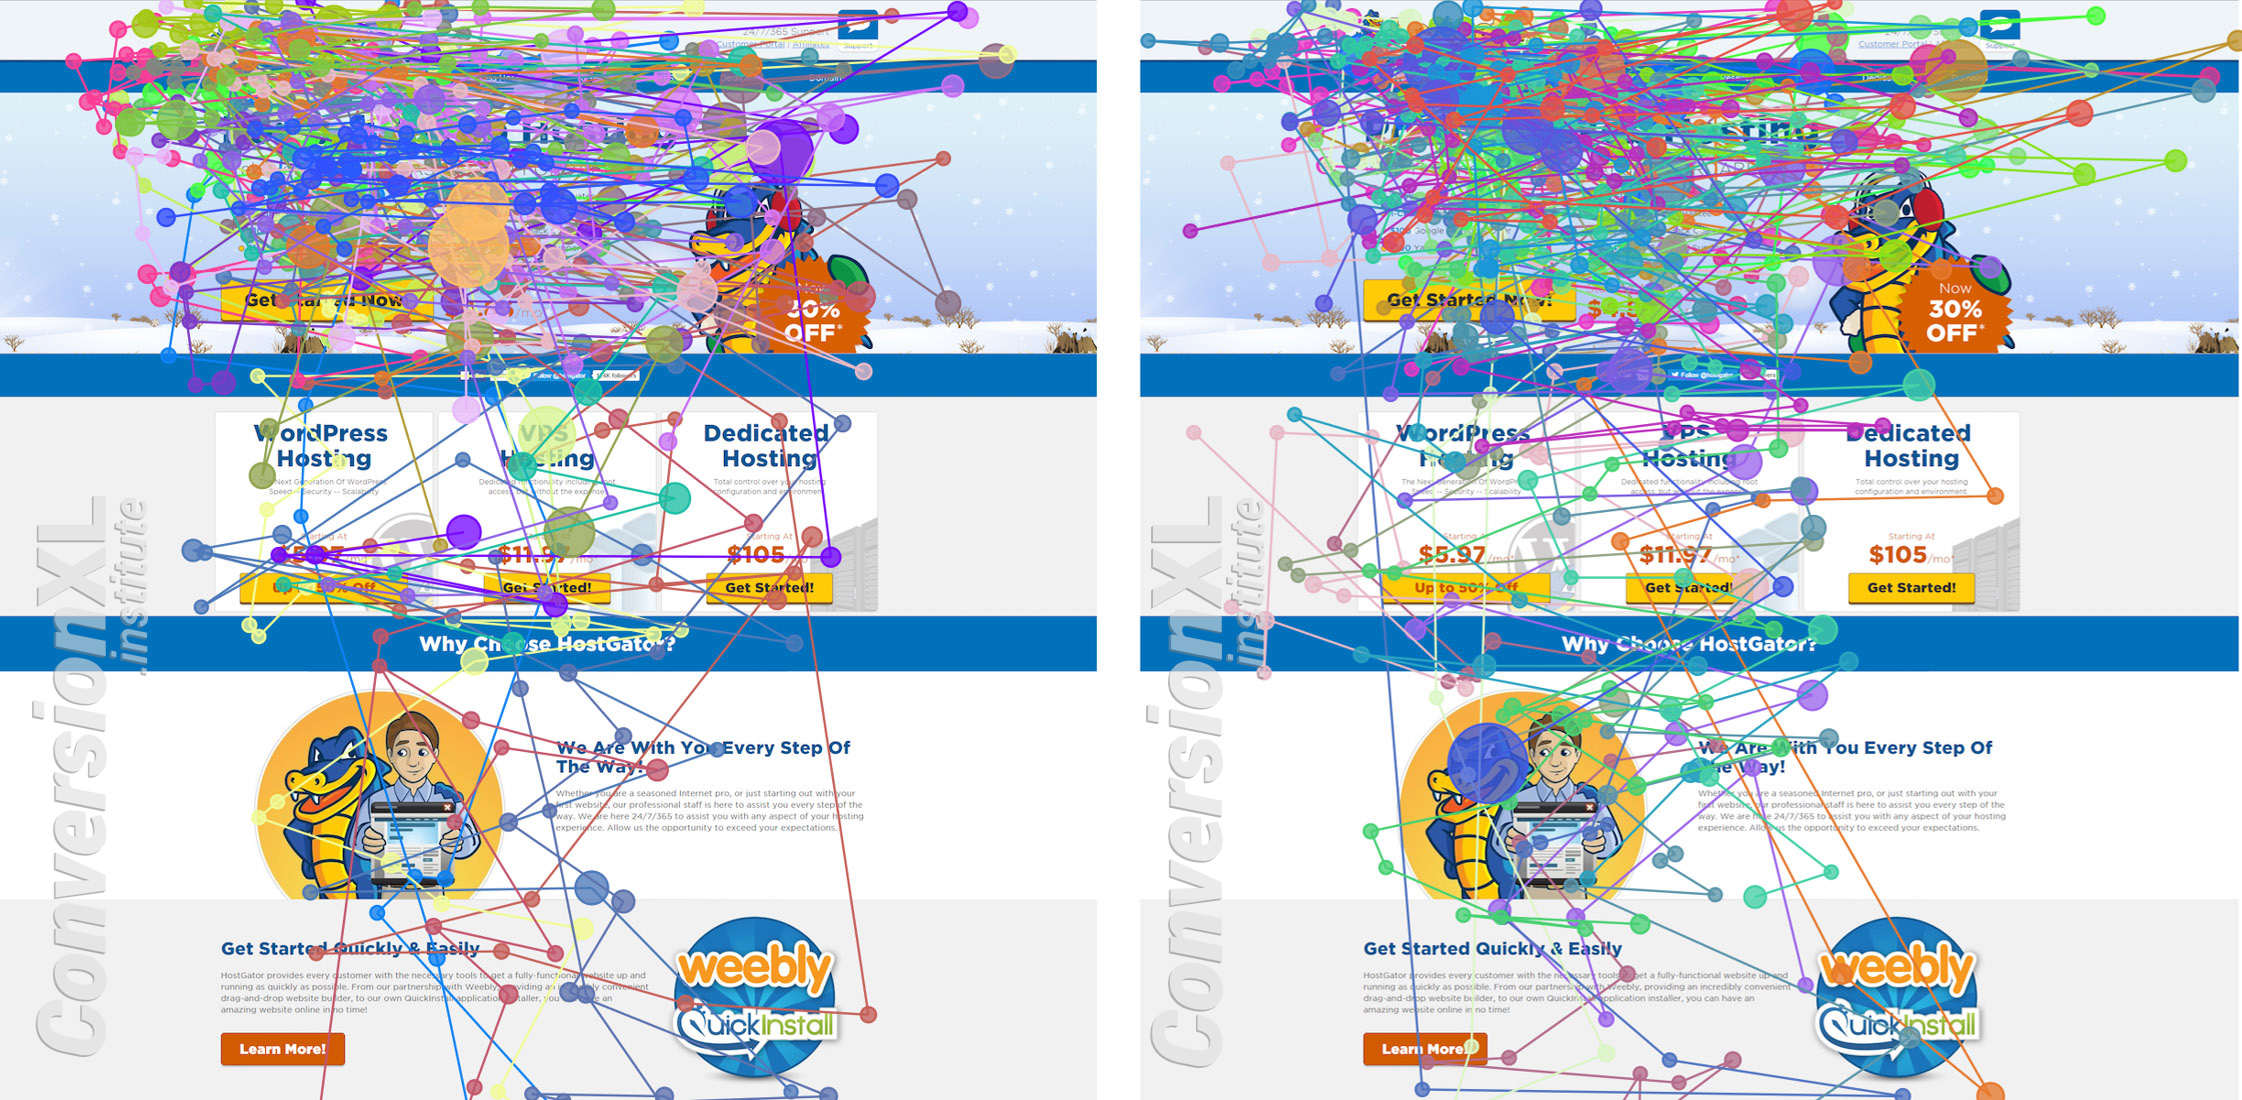
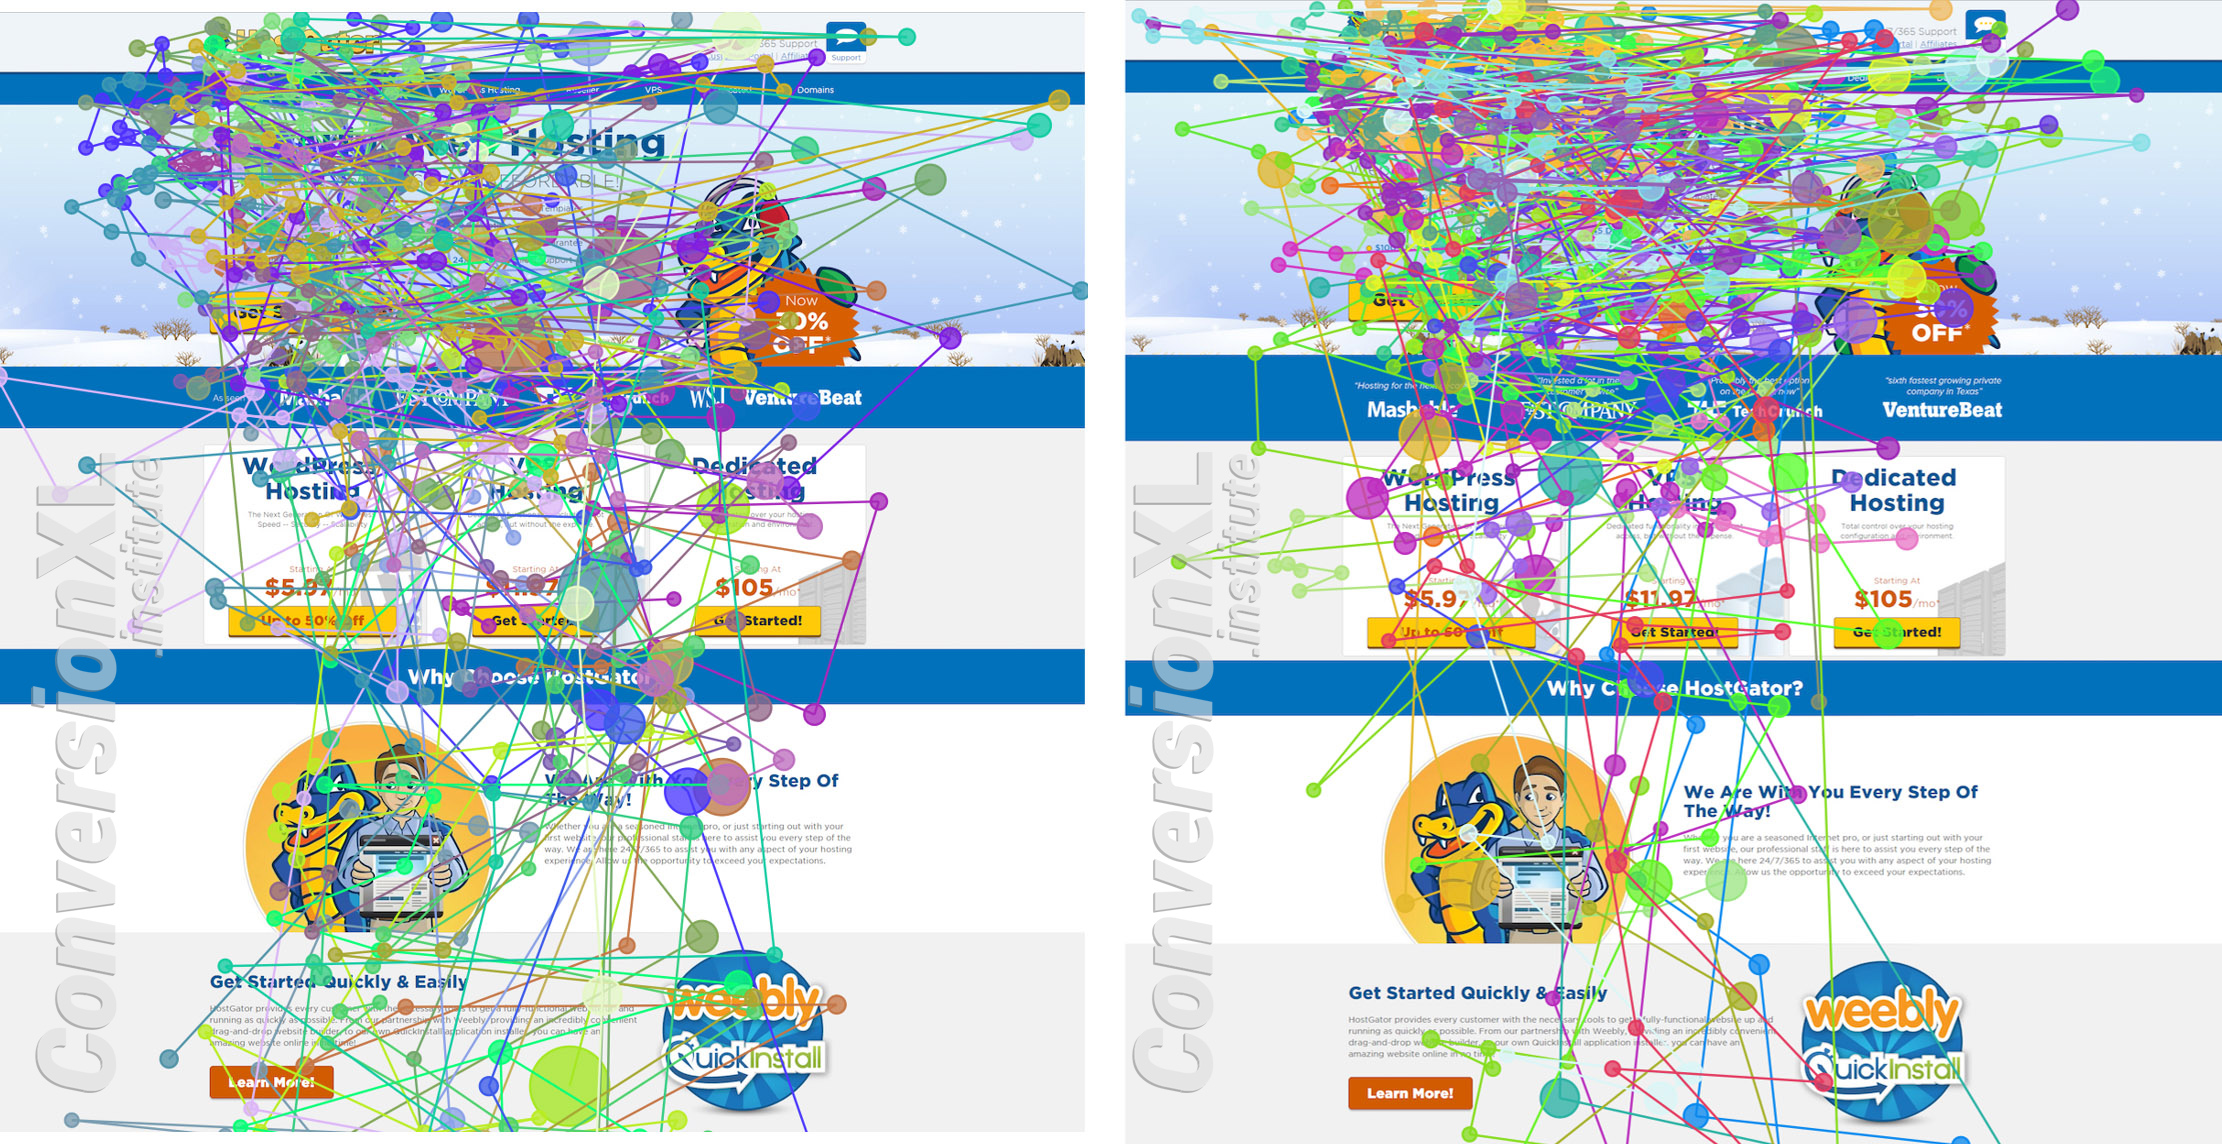
As far as the stats are concerned, remember we’re interested primarily in two metrics, time to first fixation (TTFF) and total time fixating. This helps us understand 1) how quickly the social proof attracted attention and 2) how long it held attention.
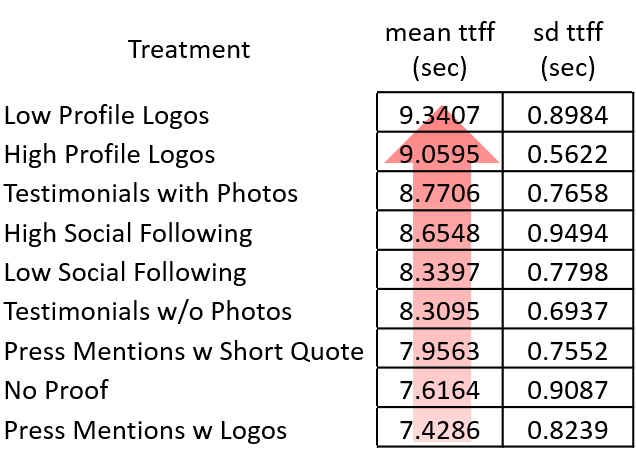
Here are the raw summary stats for time to first fixation, for which an ANOVA yielded no significant differences between treatment groups F(8,191) = 0.6338, p = 0.7487.
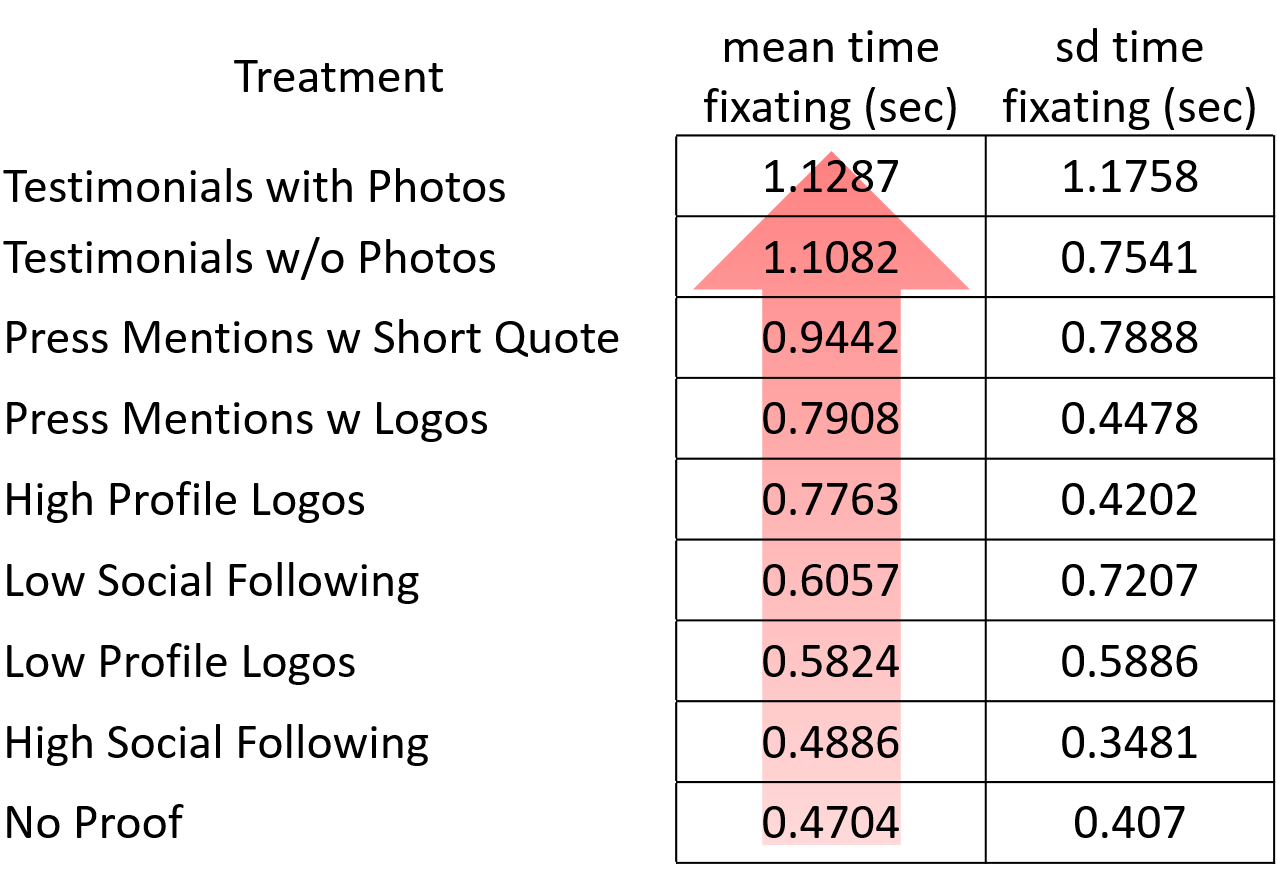
Here are the raw summary stats for total time fixating, for which an ANOVA yielded significant differences between treatment groups F(8,191) = 2.7528, p = 0.0068.
This result was driven by the long time paid to the testimonial treatments, and was likely the effect of the large block of text in the testimonials causing increased cognitive processing, thus resulting in a longer time to process. Note that the three versions with text (the two testimonials and the press mentions with short quotes) are on top of the list with the longest mean times fixating.
2. Survey Questions
Q1: Were there any elements or parts that led to an increase in trust/value to you?
We ran a Chi-squared goodness of fit test to find differences among all our treatments and the relevant pairs. Viewers were significantly [X2 (5, N = 1153) = 34.54, p < 0.001] more likely to remember high profile client logos (not low profile), testimonials with photos (not testimonials without) and press mentions.
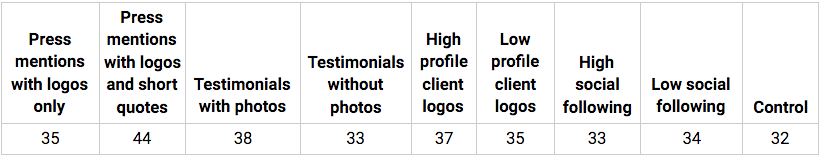
Here are the stats, test results and individual Chi-square results for the related pairs of treatments, and the overall Chi-square test among all treatments reported below the table.
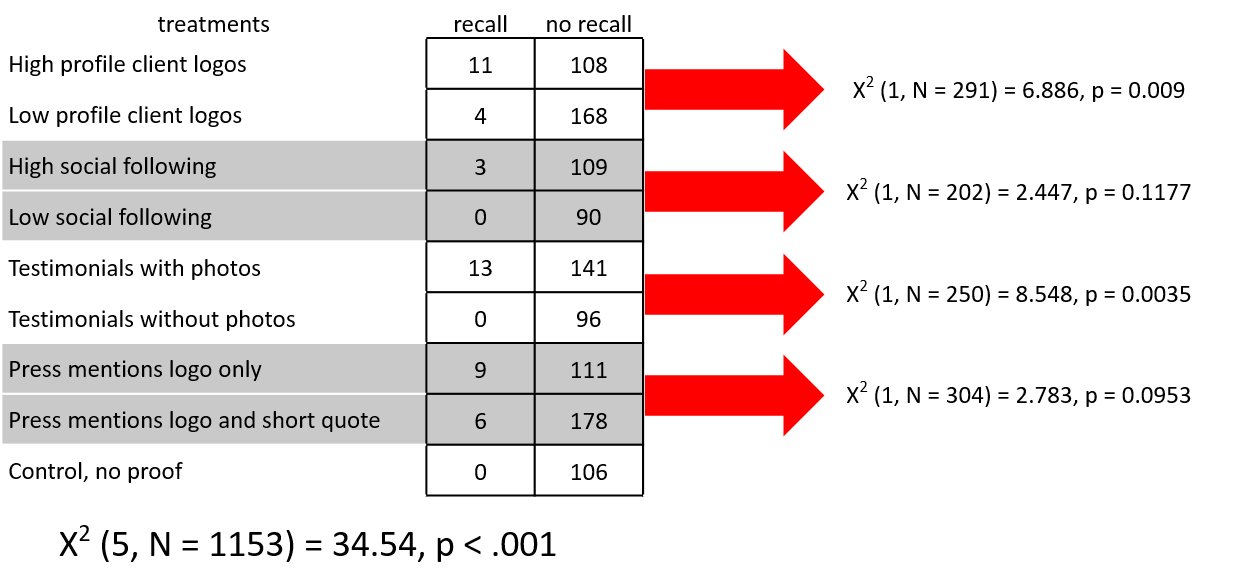
A few specific takeaways:
- High profile client logos did better than low profile at getting into people’s short-term memory.
- High social following didn’t result in significantly more recall compared to low social following (p-value = 0.1177), but the p-value is low enough to suggest that there could be a difference.
- Same for press mentions with logos only, it showed a moderate pattern for more recall that was close to significance (at alpha of 0.05; p-value = 0.0953).
- Testimonials with photos social proof were significantly more effective (p-value = 0.0035) at generating viewer recall.
Q2: Select which of the two web pages below you recall seeing:
For this question, we didn’t want to initially perform an overall goodness-of-fit test (or otherwise) as the differences among the 4 main proof types (client logos, social following, testimonials, press mentions) could be driven by the apparent visual differences within them (e.g. the photo in the testimonial treatments).
Therefore, to test differences between mean recall rates for each paired treatment, we performed an N-1 two proportion test for each. No pair test resulted in significant differences between the recall rates. Here are the numbers:
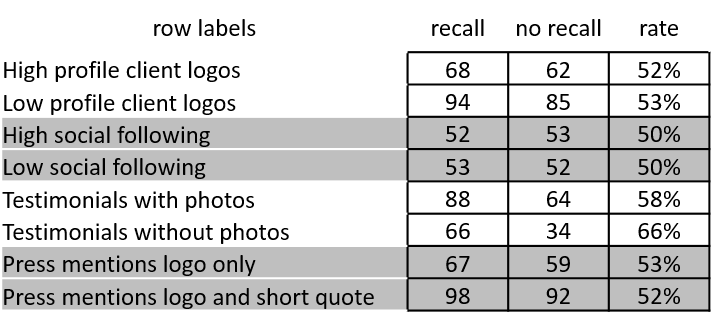
The higher rates of recall for the testimonial treatments did result in a near significant difference among main proof types (p-value = 0.0661) when running a Chi-square goodness-of-fit test (see below). But as mentioned above, this is likely due to the noticeable difference the picture on the testimonial makes when comparing the two versions.

Takeaway: Photos are memorable, logos and numbers are not.
Limitations
- There are tons of forms of social proof. We had to narrow it down to some of the most commonly seen types. Perhaps there are some less commonly used variations that are more effective than the ones we tested.
- We only tested these social proofs on a service website, specifically a web hosting site. Results would vary on a different type of website where trust would be a bigger issue. There’s surely an interaction between the type of business/business goals and the type of social proof that makes sense considering this.
- Our treatments were placed in a similar area, with the same blue bar background, but the height of the treatments varied for a couple, namely the testimonials, which required a bit more real estate. There is a known correlation that elements that take up more pixels draw more attention. However, the pattern of increased fixation time held with the press mentions with short quotes variation, and the recall patterns among all and among related pairs provided support and additional insights.
- The second recall-related question was uninformative, most likely due to a poorly designed test of recall. Rates were little better than random overall, and were highest only when using a drastic change between the two variants presented. This effectively tested inclusion/exclusion of photos, rather than social proof effectiveness. If the social proof presentation in general were more pronounced, a larger part of the page, this question might have produced more useful insights.
Conclusion
Though there are an infinite amount of ways you could implement social proof, this study yielded some interesting insights.
First, it seems that testimonials that included text garnered more attention that simple logo social proofs.
Next, testimonials with photos social proof were significantly more effective at generating recalls. Similarly, high profile client logos were better than low profile logos at generating recall.
Finally, we found that, in general, photos are memorable, logos and numbers are not.
One big takeaway is that if you have great testimonials from known brands, use them. Social proof draws attention in any form, and if you can bolster your brand with these positive associations, it’s worth doing.
![]()
