
Let’s say you get fired from your job.
But – good news – you’ve just been given a new job as a conversion optimization specialist at an eCommerce company. Your job is to increase the conversion rate and revenue per visitor of your employer’s website by 30%.
How would you do it?
Seriously – take 20 seconds to imagine how would you go about optimizing a website you’ve never worked on before.
Your answer will tell me everything about your optimization know-how.
If you start by mentioning tactics – “I’d make XYZ bigger” and “I’d change this and that” – I will instantly know that you’re an amateur. Because amateurs focus on tactics while the pros follow processes.
Maybe you have a list of 100 “proven” tactics. So where would you start? Implement them all at once? Then your website would look like a Christmas tree. Some tactics might work, some will not. They might cancel each other out or even make things worse.
Test the tactics one by one? An average A/B test takes approx. 4 weeks to run, so it would take you 7.5 years to test them all one by one. Nobody has that kind of time to make an impact.
If you had a good process to follow, you’d know which of the 100 tactics to try and which to ignore. You’d know where the problems are and what the problems are.
Conversion optimization – when done right – is a systematic, repeatable, teachable process.
Structured Approach to CRO
The success of your testing program is a sum of these two: the number of tests run (volume) and the percentage of tests that provide a win.
Those two add up to indicate execution velocity. Add average sample size and impact per successful experiment, and you get an idea of total business impact.
So in a nutshell, this is how you succeed:
- Run as many tests as possible at all times (every day without a test running on a page is regret by default).
- Win as many tests as possible.
- Have as high of an impact (uplift) per successful test as possible.
Executing point #1 is obvious, but what about points #2 and #3? This comes down to the most important thing about conversion optimization – the discovery of what matters.
Here’s a framework for this.
ResearchXL™ Framework
ResearchXL is a framework for identifying problems or issues your website has, and turning those into hypotheses that you can test.
You can use this framework for each and every optimization project. It’s industry-agnostic. The process you use to get higher conversions is exactly the same across all websites.

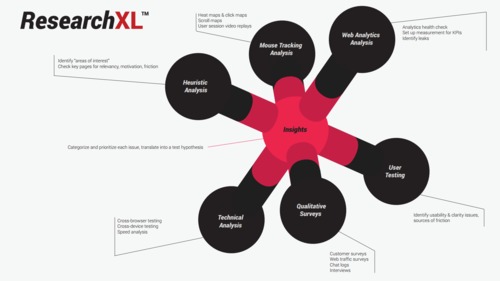
1. Technical Testing
If you think your site works perfectly on every browser version and every device, you’re probably wrong.
Open up your Google Analytics and go to Audience -> Technology -> Browser & OS Report.
Drill down to a specific browser version (e.g. IE8, IE9) and see if a particular browser converts less than others. If so, fire up that browser and go figure out what’s up.
Besides browser testing, site speed can be low-hanging fruit for optimization.
To find site speed data, log into Google Analytics and from there, go to: Behavior → Site Speed → Page Timings. Turn on the “comparison” to easily spot slower pages.
Look at the top traffic pages (because they affect the most people) and use a tool like Yslow or Google Pagespeed Insights (accessible via Google Analytics) to get a diagnostic on your site. Enter all the URLs of slow pages and these tools will find the issues for you.
2. Analyzing Digital Analytics Data
In a nutshell, we want to learn:
- What people are doing.
- The impact and performance of every feature, widget, page, etc.
- Where the site is leaking money.
Start with an analytics health check. This is just a series of analytics and instrumentation checks that answer some of these questions:
- “Does it collect what we need?”
- “Can we trust this data?”
- “Where are the holes?”
- “Is there anything that can be fixed?”
- “What reports should be avoided?”
The big point here is that, in order to collect the right data, everything needs to be set up correctly and you have to have the skills to set up the right reports.
3. Polling Website Visitors
For qualitative research, I like to start out with polling tools.
Generally there are two versions of visitor surveys:
- Exit Surveys – Hit them with a popup when they’re about to leave your site.
- On-Page Surveys – Ask them to fill out a survey as they’re on a specific page.
Here’s what the visitor survey process will entail:
- Configure which pages to have the survey on.
- Write your own questions (no pre-written template bullshit).
- Determine the criteria for when to show the survey.
That’s it. And don’t worry too much about whether or not the surveys are annoying people. The insights you’ll gain are worth it.
4. Surveying Existing Customers
Customer surveys are slightly different than on-page surveys, solely due to the fact that you’re getting answers from current customers. Problem is, most people are seriously messing up their customer surveys.
So to summarize a complex process, here are the basics on how to do customer surveys for CRO:
- Send an email survey to recent, first-time buyers. If you send an email to people from too long ago, they’ll have forgotten about you or why they purchased. They’ll give you totally irrelevant data.
- Then try to get 100-200 responses. More than that and the answers will get repetitive. Any less than 100, though, and you might not be able to draw substantial conclusions.
- The quality of the questions is the most important factor. Don’t ask yes/no questions, avoid multiple choice, etc.
5. Mouse Tracking and Session Recording
Mouse tracking is one of the lesser important spokes of the research process, but we can still gain some insights here.
Quickly, here are some of the different types of mouse tracking technologies (and related tools):
- Mouse Movement Heat Maps – A graphical representation of data where the individual values contained in a matrix are represented as colors. Red equals lots of action.
- Click Maps – Just as it sounds, click maps track where people click. The visuals make it easy to explain things to executives and other team members. Another good use for them is to identify if users are clicking on non-links.
- Attention Maps – A map of which areas of the page have been viewed the most by the user’s browser with full consideration of the horizontal and vertical scrolling activity. This is especially illuminating for assessing the effectiveness of the above the fold area.
- Scroll Maps – This shows you scroll depth (how far down people scroll). Can be very useful for designing long sales pages and whatnot.
- User Session Replays – Many tools also offer the capability of recording video sessions. It’s like user testing, but no script or audio. Plus they’re actually using their own money.
- Form Analytics – These tools basically identify where users are dropping off, which fields draw hesitation, which fields draw the most error messages, etc.
6. User Testing
User testing lets you watch people use your site in real-time while they comment on the process. Ask testers to perform a specific task, a broad task and move through your entire funnel.
(Note: If you’re debating on which tools to use, for any of these categories, check out our list of conversion optimization tools reviewed by experts.)
Putting It All Together
These six spokes of our ResearchXL framework should have given you sufficient insight and issues to work on. Now we’ve got to categorize them in a way that promotes efficiency.
We dump them into the following 5 buckets:
- Test. This is the bucket for things with a big opportunity to shift behavior and increase conversions.
- Instrument. We put things that need technical tweaking in this bucket (e.g. beefing up analytics reporting, fixing/adding/improving tags or events).
- Hypothesize. We put things in this bucket that, while we know there is a problem, we don’t see a clear solution. Then, we brainstorm hypotheses and, driven by data and evidence, create test plans.
- Just Do It. No brainers go here. This is where a fix is easy to implement or so obvious that we just do it. Low effort or micro-opportunities to increase conversions right away.
- Investigate. Things in this bucket require further digging.
Next, we prioritize the items in our bucket using a 1-5 star scoring system. (There are many ways to prioritize tasks, but this works well for us.) 1 = minor issue, 5 = critically important. The two most important things to consider when giving an item a number are:
- Ease of Implementation (e.g. time, complexity, risk).
- Opportunity Score (i.e. subjective opinion on how big of a lift you might get).
Then create a 7 column spreadsheet. It should look something like this:

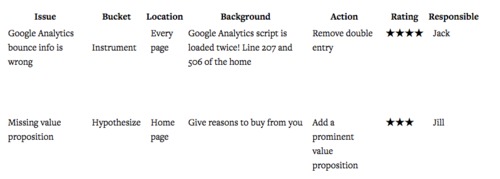
Beginners are often worried about what to test, which breeds listicles offering “101 Things to Test Right Now”. Funnily enough, after doing conversion research, what to test is never a problem (usually, you’ve identified 50-150 issues).
Once you prioritize, you can begin writing and testing hypotheses. A good way to write your hypothesis is like this (credit to Craig Sullivan):
“We believe that doing [A] for people [B] will make outcome [C] happen. We’ll know this when we see data [D] and feedback [E].”
What’s Next?
Now you’ve got everything you need to double your conversion rate: data, insights, and a prioritized testing map.
Good luck!
Back to Start or Download guide as PDF
-
Introduction to Conversion Optimization by Brian Massey
Copywriting, A/B testing, analytics, psychology... we'll cover it all. But first, Brian Massey, the Conversion Scientist, reminds you of the basics. -
How to Write Copy That Sells Like a Mofo by Joanna Wiebe
Joanna Wiebe of Copy Hackers and Airstory on how to write copy that converts like crazy. -
Introduction to Designing for Conversions by David Kadavy
David Kadavy, author of Design for Hackers, on designing for conversions. He debunks today's biggest design myths and tells you what actually matters. -
How to Use Psychology in Conversion Optimization by Bart Schutz
Bart Schutz of Online Dialogue and The Wheel of Persuasion on using psychology to increase conversions. -
Emotional Targeting 101 by Talia Wolf
Talia Wolf of Conversioner talking emotional persuasion. Building on what we learned from Bart, she explains how to appeal to your visitors' emotions. -
How to Build a List and Send Emails That Convert by Justine Jordan
Justine Jordan from Litmus walks you through collecting emails, improving your open rate, designing for all browsers / devices / email clients, A/B testing emails and more. -
How to Setup Analytics and Measure the Right Stuff by Chris Mercer
Chris Mercer from SeriouslySimpleMarketing.com on how to setup your analytics in a meaningful way that ensures you're gathering useful data. -
How to Use Analytics to Find Insights by Yehoshua Coren
Yehoshua Coren, the Analytics Ninja, walks you through extracting insights from your analytics using segmentation. -
How to Gather Qualitative Data for Insights by Jen Havice
Jen Havice of Make Mention on how to use qualitative research to answer one of the most important questions in conversion optimization: Why? -
What to Test (Conversion Research) by Michael Aagaard
Michael Aagaard, senior conversion optimizer at Unbounce, on how to strategically decide what to test using conversion research. -
How to Run A/B Tests by Peep Laja
Peep Laja teaches you everything you need to know to run valuable, statistically valid tests that will actually lead to applicable insights. -
How to Create a CRO Process by Peep Laja
Peep on how to combine everything you've learned into a systematic, repeatable CRO process.