


The success of an online business is measured by various indicators.
The data required comes mostly from web analytics tools – the most popular being Google Analytics. But what if the tool isn’t reporting what people expect it to report? What if you can’t trust all of the metrics in GA?
Table of contents
Google Analytics – One Size Fits All
Google Analytics is simple. The predefined tracking code is implemented in the source code of the webpage – usually without major adjustments – and the data begins to flow.
This is quick and easy and certainly one of the reasons why this tool is used in practice by so many companies (oh yes, and it is also free ;)).
Google Analytics’ tracking code is designed to cover any website in the world as good as possible. A kind of “one size fits all analysis hat,” which fits any site, anywhere. In the basic version of the tracking code, Google Analytics does not do much more than measure and interpret the page views of your web page.


Why Shouldn’t I Trust the Data?
Of course, the metrics are not wrong.
It is just that sometimes they are not what they are expected to be. To give more proof to this statement, we will take a look at two important (and often misunderstood) metrics:
- Sessions
- Bounce rate
A Session Does Not Equal a Visitor
The metric “Sessions” is a good example. Sessions are often used for the calculation of key metrics, such as the conversion rate.
A session in Google Analytics is defined as, “a group of interactions that take place on your website within a given time frame.”

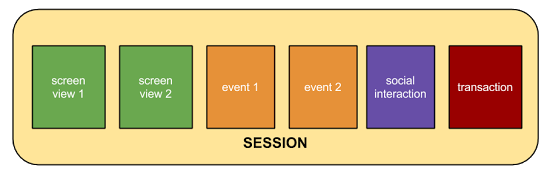
Also you have to know, that a session ends when…
- inactivity lasts longer than 30 minutes (a visitor interacts with you website, goes to lunch, comes back after 31 minutes, and keeps interacting).
- a new day starts (a visitor enters the website at 11:59 PM, at 12:00 AM his session is terminated and a new one is started. End of day is determined by your view timezone settings).
- the campaign source changes (a visitor directly enters the web page and closes it again. After a couple of minutes he comes back via organic keyword search. For example: just using Google Chrome and typing the website’s name without top-level (i.e. .com, .org,) in the url box).
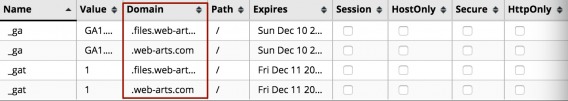
- a visitor enters the site on a sub-level-domain (a website owner uses sub-level-domains for several landing pages and did not define the domain in the cookie settings properly. If the visitor starts his journey on one of the sub-levels, a new session will generate as soon as the visitor switch to the regular domain).

These facts should not be regarded as errors. They are simply the definition of a session – and everyone who is working with Google Analytics has to be aware of it.
The Problem with Sessions
The error is to equate a session with a visitor. Because, as described above, a single visitor can trigger several sessions and will do this – usually.
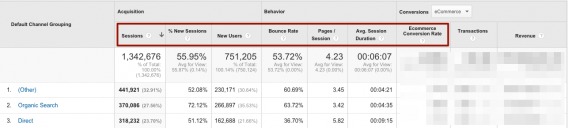
If you now look at the channels report in Google Analytics, you have to know that the metrics displayed there are calculated based on sessions.
The E-commerce Conversion Rate is also calculated based on sessions (transactions*100/sessions).

A session is a combined metric of Google Analytics, whose criteria you need to be aware of in order to draw conclusions.
It may also be that for the respective business model (e.g. affiliate), sessions represent the correct reference. In the common e-commerce site, however, this is usually not the case.
Solution: Customized Dimensions
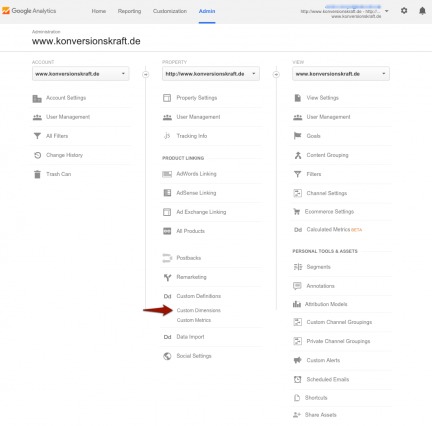
Enrich sessions with more detailed information is the first step to increase the quality of your data. A good start for getting this done is the establishment of custom dimensions in your Google Analytics account.
In the property settings in Google Analytics you’ll find the needed menu items:

In addition to the adjustments in Analytics, the tracking code also has to be adapted. The technical possibilities are manifold. For example, a visitor ID can be transferred from the shop system to Google Anlaytics, which makes it possible to track a user across sessions and even devices.
The privacy issue should be clarified in advance. In general, user-related data such as e-mail addresses cannot be passed on to Google Analytics. But a randomized, system-generated number might solve this issue. However, what to track and what to pass on must be clarified in each individual case to make sure no laws are broken.
An exact technical integration of useful dimensions can be found on the analytics blog of Simo Ahava, which is, by the way, a great blog regarding all questions about Google Analytics.
> Click here for Custom Dimensions
What Bounce Rate Actually Means
Another very exciting and popular metric is the Bounce Rate.
Similar to the metric sessions, the Bounce Rate simplifies matters to make easier conclusions. That’s not bad per se, but it also offers room for misinterpretation. Here’s Google’s definition of Bounce Rate:
“Bounce Rate is the percentage of single-page sessions (i.e. sessions in which the person left your site from the entrance page without interacting with the page).”
The problem with the Bounce Rate
To make this statement 100% clear, a few points should be added:
Point #1
The part “without interacting“ is often overlooked, but it is very important, because not just a pageview affects the bounce rate but also a defined interaction on the page.
Example:
An auto-play video or a live chat window each trigger a pageview or an event and are implemented on a landing page. This landing page will have an enormously low bounce rate. But this does not mean that the quality of the page is very good.
A true quote from Caleb Whitmore I read in a blog is: “A 3.8% bounce rate isn’t really good, it’s broken.”
Point #2
Visitors who have been registered as a bounce have still visited the site. This may sound trivial, but it is not always taken into account.
Example:
A visitor looks for opening times, phone numbers, address, etc. and finds them directly on the first page. He could even fill out a form, depending on how this is implemented. The visitor leaves the page happy, but is counted as a bounce – a happy bounce.
Point #3
The bounce rate refers to people who entered the website on this particular page (entries). So only single pageview sessions are important. That means on the other hand, that subpages on which only a few users enter, the bounce rate is completely irrelevant.
Example:
Your basket has a bounce rate of more than 90%. However, since the basket recorded only ten entries (the rest of the visitors had previously been on the page), this metric gives you no statement at all.
Furthermore, as described above, the bounce rate is also calculated based on sessions.
Therefore, using the bounce rate is very tempting when it comes to quickly identify potentials. But misinterpreted, it is also very prone to error. Therefore it is extremely important to be aware of the exact measurement. Because:
- A bounce isn’t good.
- A bounce isn’t bad.
A bounce is just a bounce.
Solution: Adjusted Bounce Rate
The bounce rate can also be cut off from arbitrariness by being enriched with information.
For example, adding the time on the page and even the scroll-depth of the visitor will get you a new “adjusted” bounce rate. This one is very interesting for bloggers and service providers, because it gives information about how much the visitor has dealt with the page. But also be careful. The adjusted bounce rate is not easy to implement and can also be misinterpreted.
If you track the scroll-depth of your visitors, you need to decide to track them either by
- pixels
- elements
- percent
By choosing pixels or percent, it is better to track the visitors in an predefined area (i.e. 50%, etc.) then the actual percentage. Otherwise you will have problems to analyze the data.
When it comes to adding the time the visitor spent on your page, you need to know after how many seconds (or even minutes) you can tag a bounce as a soft “prospect.” This is a very specific question, which sometimes you cannot even be answered for one company. It can be different from page to page.
Let’s say you have a blog. People need to be having a look for maybe at least 60 seconds, after you can be sure that they are interested in your content.
If you have a landing page selling only one Product, it might be okay to tag visitors as a prospect after twenty seconds. Also it might be okay if the visitor did not scroll at all, because all relevant information is above the fold.
So you see, the whole adjusted bounce rate thing is giving you more information, but it does not take the responsibly of interpreting these numbers from you. It just makes it easier (or harder – depending what you think of numbers ;))
Again, if you want to use adjusted bounce rate on you webpage, you will need to do several code implementations on your website. And here is a great description of how this can be done.
Conclusion
Google Analytics is, by default, a tool that measures and summarizes page views. This makes the integration easy and reduces barriers for new users. However, as easy as it is to integrate the code, it is just as easy to make a mistake when it comes to evaluating the data.
But don’t get me wrong – this is not only happening in Google Analytics. Misinterpreting data is a cross-tool-phenomenon, which has its roots in the credulity of the people. Blind data trust leads to destruction. An understanding (at least in rudimentary form) for the determination of the data will lead to more skepticism. You can not keep all the reports from an analytics tool safely as a fact.
Metrics such as sessions or bounce rate are good examples of why we cannot blindly trust data. To avoid misinterpretation, we should therefore turn the “one size fits all analytics hat” into “made-to-measure” analysis. Then, as easy as Google Analytics is at the beginning, it will give you many opportunities to expand it. This must be used to bring your own data to a level which will avoid misinterpretation and bring new insights.
Related Posts
-

If I were to tell you - what would you do with that information? Honestly,…
-

What's a good conversion rate? A conversion rate that's better than the one you currently…
-

Google Analytics is widely used. But most marketers only scratch the surface when it comes…
-

This post is not a dry feature-by-feature comparison, nor does it include a winner-take-all verdict.…
