What Do You Do With Inconclusive A/B Test Results?

So you ran a test – and you ran it correctly, following A/B testing best practices – and you’ve reached inconclusive results.
What now?
So you ran a test – and you ran it correctly, following A/B testing best practices – and you’ve reached inconclusive results.
What now?

You have an A/B testing tool, a well-researched hypothesis and a winning test with 95% confidence. The next step is to declare the winner and push it live, right?
Not so fast.
![Don't Do A/B Testing If You Aren't Ready [Rant]](https://cxl.com/wp-content/uploads/2015/10/typography-white-door-fence-320x160.jpg)
A/B testing is highly useful, no question here. But a lot of businesses should not be doing it. They’re not ready yet.

You may be wondering, “why should I make my own visualization of my A/B test results?”
Because the A/B testing tools in the market already provide you all the necessary tables and graphs, right? They tell you when an A/B test is significant and what the expected uplift is. So why bother?
The thing is, these tables and graphs are comprehensible when you – a data driven analyst – take a look at them. However, if you’re the manager that bumps into them as a screenshot in an email or presentation document, then they aren’t that clear at all.
Moreover, you should always analyze your A/B tests in your analytics tool instead of in your A/B testing tool. Problematically, your analytics tool doesn’t tell you whether or not your A/B-test was a significant success. It doesn’t provide you the statistical significance (p-value), power level and error margins. You need to calculate and visualize this yourself.
Problem is, it’s tricky coming up with an A/B test visualization that everyone gets. However, we’ve gone through the process and have come up with a clear way to do A/B test visualizations.
If you follow, hopefully it will result in a graph that positively convinces everyone of your awesome job. You’ll be able to easier convince people that you need more resources for A/B testing. A good graph doesn’t just look nice, but it helps you to get the message across and boosts the credibility of your A/B test results.
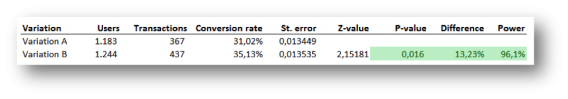
In the first couple of months when we started analyzing the results of A/B tests ourselves (in a spreadsheet), we used no graph at all. We just presented a table with the main results. Being good statisticians we included the standard error, the z-value, the p-value and the power. So at least we knew for sure that no one would understand it☺.
Oh well, we did use color coding; green meant we have a winning result!
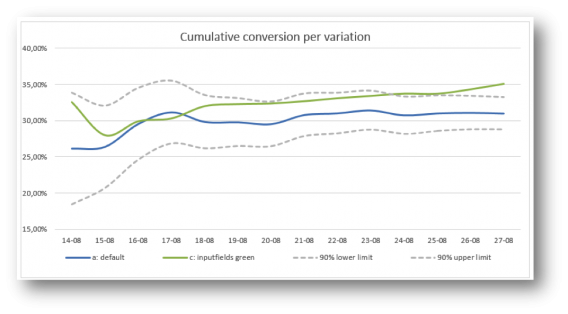
We started by copying what every other A/B test tool reports: a graph with the conversion rate per day, accumulated over time. We do added two lines: representing the 90% lower and upper limit of the default variation (computed by the conversion rate of the default variation plus/minus the critical z-value times the standard error).
The main problem we ran into was the simple fact that conversion over time doesn’t really give us an insight.
This graph tells you whether there’s a significant and stable effect, but that’s only interesting to the web analyst. Others are, of course, only interested in the main conclusion: does this A/B test have a significant winner and could we make a big positive impact on our KPI’s when we implement it? This graph didn’t give a clear answer to that question:
We wanted to get rid of the graph with the conversion rate over time and only show the main conclusion. This meant clearly visualizing the last data points of the graph: the conversion rates of variation A and of variation B.
In addition, the 90% lower and upper limit (the confidence interval) of both variation A and variation B were needed to see whether the difference is significant.
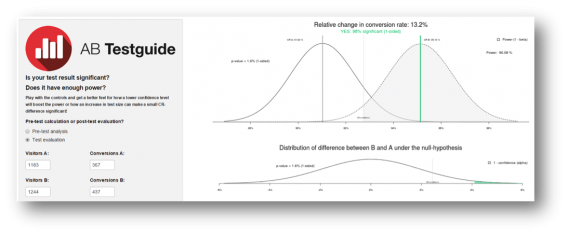
Basically, we wanted to replicate what statisticians use to visualize a test: two bell curves, a critical value and a shaded area (as used in the A/B test calculator of ABtestGuide or CXL’s AB test calculator), but more comprehensibly presented. Problem is, this bell curve visualization won’t get the message across in a persuasive and clear way to your company. It simply looks too difficult:
This is what we came up with to overcome that problem:
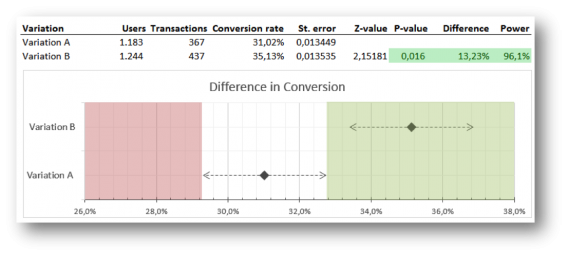
What you see are two clear points representing the conversion rate of variation A and B.
The dotted lines are the confidence intervals of them both. If the conversion rate of variation B lies outside the reach of the confidence interval of A, variation B is significantly better. The green shaded area accentuates this. A dot in the red area would mean that the variation is performing significantly worse.
The graph could easily be refreshed by changing the users and transactions for each variation (and thereby automatically changing the conversion rates, standard errors, z-value, p-value and power), but the shaded green and red areas had to be adjusted by hand.
No biggy if you’re running few tests, but if your job is analyzing more than 10 A/B-tests a week, this becomes really annoying. Another minor issue was that the graph still looked too nerdy. It looked like something you had to draw for your mathematics homework ☺.
On a Friday afternoon, we sat down with the data scientist that programmed the R calculations of the ABtestguide calculator and showed him our visualization. We consulted him, because the calculation of power wasn’t accurate and we didn’t know what was wrong with it (it took some time, but we found the small error in the formula).
However, the conversation soon turned to the visualization at hand. According to him – and probably the whole scientific community – our visualization wasn’t scientifically correct ☹.
Basically, we displayed the two bell curves in a one-dimensional graph and used this to verify whether the A/B test was significant or not. However, the correct way would have been to show the graph of the distribution of a difference between variation B and variation A (the lower graph of the ABtestguide calculator).
This distribution can be calculated by computing the standard error of a difference (take the root of the sum of the squared standard errors of variation A and variation B) and use this in the calculation of one overall confidence interval.
Great, now the calculation was correct, but consequently it had a huge impact on our visualization. We no longer could present a single row for each variation, but we had to merge the two to represent the distribution of a difference between variation A and B, so we did:
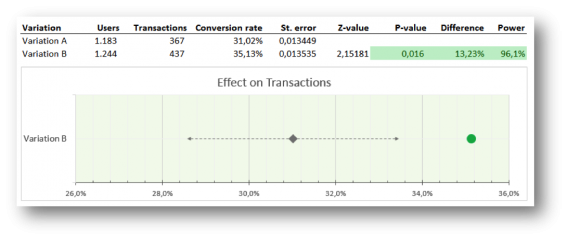
Here’s what this graph can tell you: if the conversion rate of variation B lies within the confidence interval, this variation isn’t significantly better; if it lies outside the confidence interval, it is, and the dot turns green (positive) or red (negative).
The problem with our previous visualization was the lack of automation. This graph and table solved that. We just had to import the data through the analytics API (the users and transactions per variation) and bang…the results and graph were ready!
That seemed like a dream come true, but when we started using this visualization with a couple of our clients we soon noticed that we still had to explain (even more than before) what they were seeing in this graph…
Especially, with multiple variations in the A/B test the graph becomes confusing. A test with a default and 3 variations would show 3 rows with grey diamonds and grey dotted lines (the confidence intervals) surrounding them that were all just slightly – barely noticeably – different, because all the standard errors of a difference between the variations and the default are usually roughly the same.
People were puzzled as to why there were only 3 lines and not 4: what happened to the default variation? And every row looked basically the same, so it felt like the impact of winners wasn’t that big.
Hmm…we just woke up from our perfect dream. Back to the drawing board.
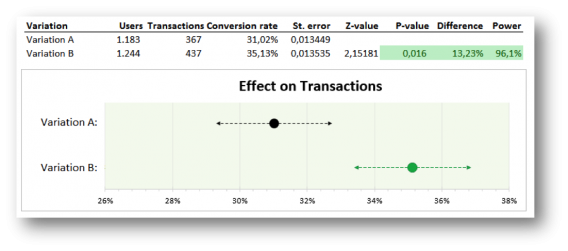
So, we went back to our visualization of our 2nd try – one row for every variation. We know this might not be the perfect scientifically correct way of displaying results, but it is understandable and that was our main goal. We did keep the new design and sharpened it a bit by using dots instead of geeky diamonds. And by looking into all the possible features of graphs in Excel we came up with a way to automate this kind of visualization too…yeah!
Before we went ahead and used this visualization with our Online Dialogue clients (and confuse them once more with a different A/B test visualization), we consulted our own colleagues.
We found out that the graph was very clear to all participants in our A/B test teams, but stakeholders, managers and other important people, not directly involved in testing, could still have many questions and/or remarks:
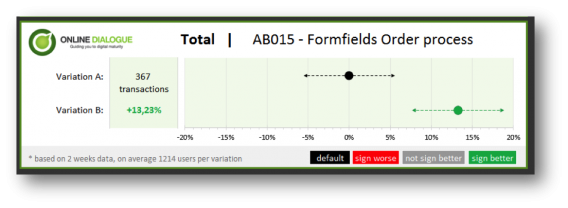
These questions and remarks were taken care of in our next (and so far final) visualization. Besides a visual update to make this visualization client and Online Dialogue PR friendly we made 2 major changes:
With this visualization you will be able to see the uplift and the expected impact immediately. We also added the number of test weeks and the average population per variation – so the data analyst can still feel confident with the results. The analyst could also easily explain that with a 90% certainty the increase in conversion after implementation will be somewhere between 7.5% and 19%.
We now think this visualization offers enough information to convince the manager and the analyst – so we got rid of the table (which is still there when the analysts in the team open the Excel of course – but it’s removed from the PowerPoint, result email and/or PDF).
The Online Dialogue clients are happy with this new visualization and at Testing.Agency we already hired a developer to automate this visualization based on data from the Google Analytics API, but we think there’s still room for improvement.
Though A/B testing tools provide graphs and charts, it’s important to create A/B test visualizations the whole team understands. We’ve gotten to the point where we’re conveying our results clearly, but we’d like to get even better at it.
Something we know we want to do is to give way more focus to the real possible impact once you implement a winning variation on your website. How many conversions or revenue will it add? We already know that not every page reaches all visitors and therefore not all conversions.
Moreover, sometimes tests aren’t run on 100% of the population on that page. Consequently, this makes the reported number of transactions in the default less important – and possibly even confusing – to managers. They just want to know the number of extra conversions every month once this new variation is implemented and what that means for the uplift of total revenue. We may need that in our visualization.
So, according to you, what else is missing? What would you change?
Thank you for reading our quest and join in by adding your feedback below, thanks! You can download our Excel template by clicking here.
![What Can You Do With Other People's A/B Test Results? [Rant]](https://cxl.com/wp-content/uploads/2015/09/resultsw-320x160.jpg)
Lots of people on the internet are running a/b tests, can I just copy their winning tests? Let other people do the failing, I’ll just test (or implement) the winning stuff. Good idea, right?
![Advanced A/B Testing Panel with Top Experts [Video]](https://cxl.com/wp-content/uploads/2015/07/panel-320x160.jpg)
At CXL Live 2015 we had an amazing a/b split testing panel featuring statistics and testing gurus Lukas Vermeer from Booking.com, Matt Gershoff from Conductrics and Yuan Wright from Electronic Arts. And the audience asked some of the toughest testing questions ever. All of them got answered.

While there are no universal rules in conversion optimization, there are some things that tend to work more often than not. This article will give you some of these tactics to test for yourself.

You have a hypothesis and run a test. Result – no difference (or even drop in results). What should you do now? Test a different hypothesis?

A/B testing is great and very easy to do these days. Tools are getting better and better. As a result, people rely more and more on the tools. As a result, critical thinking is much less common.
It’s not fair to just blame the tools of course. It’s very human to try to (over)simplify everything. Now the internet is flooded with A/B testing posts and case studies full of bullshit data, imaginary wins. Be wary when you read any testing case study, or whenever you hear someone say “we tested that”.

AB testing is supposed to be straightforward and extremely transparent. It should be so easy to see the ROI – especially when compared to opaque stuff like SEO. But is it really so transparent as we’d like to think?