
One of the most challenging parts of producing high-quality content is finding and sourcing accurate statistics and research. You’ll often go down the sourcing rabbit hole only to discover that a statistic is from 2012 or that the study’s sample size consisted of just a few people—and that’s only after you make an effort to dig deeper.
With many outdated and misleading statistics crowding the first page of Google, how do you know which stats are legitimate? How can you use research to strengthen your content rather than regurgitating the same old stats?
In this article, we’ll look at some commonly cited statistics and see how they hold up today, as well as share how you should approach research in your own content efforts.
Table of contents
- You do not have the attention span of a goldfish.
- Yes, 40% of small businesses don’t have a website—if you believe a 500-company sample from years ago.
- People did check their email right after waking up…in 2012.
- Do you really retain a message more effectively when watching a video? No one seems to know.
- Only 1 in 7 AB tests are winners, give or take.
- Does it cost 5–25x more to acquire a customer?
- 5 ways to improve your approach to stats and research
- Conclusion
You do not have the attention span of a goldfish.
As a marketer, you’ve likely heard that your prospects and customers have an average attention span of a goldfish—or according to some, less than that of a goldfish.
Thanks to an overload of information and distraction, you have only eights seconds to capture attention. Worse, it appears our attention spans continue to become shorter. In the early 2000s, for example, average attention spans were around 12 seconds.
The idea that you need to “market to goldfish” has become standard practice for the last five years. Use click-baity headlines. Break your content into single-sentence paragraphs. The list of tactics to combat this worrying phenomenon is long.
The problem is, the claim simply isn’t true.
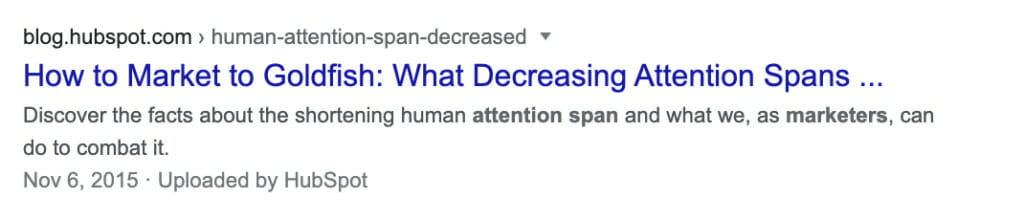
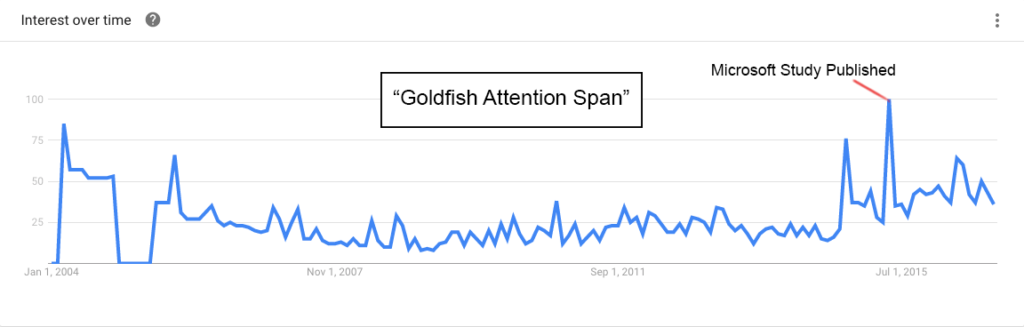
Back in 2015, the consumer insight team at Microsoft Canada released a report called “Attention Spans,” which appears to be where the attention span myth was born.
As research company WARC notes:
This became the headline in coverage all over the world, from The Guardian to The New York Times. It continues to worm its way into innumerable agency and media company presentations. It’s a striking image, appending something that feels true to something we think we all know, bolstered by association to a reputable source.
Digging even further, WARC discovered:
The Microsoft report was based on studying the brain activity of 112 people, but the headline was not derived from that research. It is sourced to a company called Statistic Brain. Upon visiting the site, it appears to be a research company. A chart with the fishy fact appears there. A reverse image search led me to the source of the claim, a software manual called Building Information Modeling and Construction Management. Here the chart is sourced to the National Center for Biotechnology Information and US Library of Medicine but when asked, both denied any knowledge of research that supports it.
While attention span is difficult to measure at scale, Dr. Gemma Birggs, a psychology lecturer at Open University believes that measuring average attention span is pretty meaningless: “It’s very much task-dependent. How much attention we apply to a task will vary depending on what the task demand is.”
We even indulged the goldfish myth previously on CXL:
Listen – people don’t care about you and their attention span is shorter than a goldfish’s memory, so if they can’t get some crucial answers from your site right away, they will leave.
When a visitor comes to your site, they need answers and they need them quickly. The first thing they read needs to provide answers to questions like ‘what is this site?’, ‘what can I do here?’ and ‘how is it useful to me?
While your audience does face an increasingly large number of distractions, it’s time we put the goldfish myth to bed.
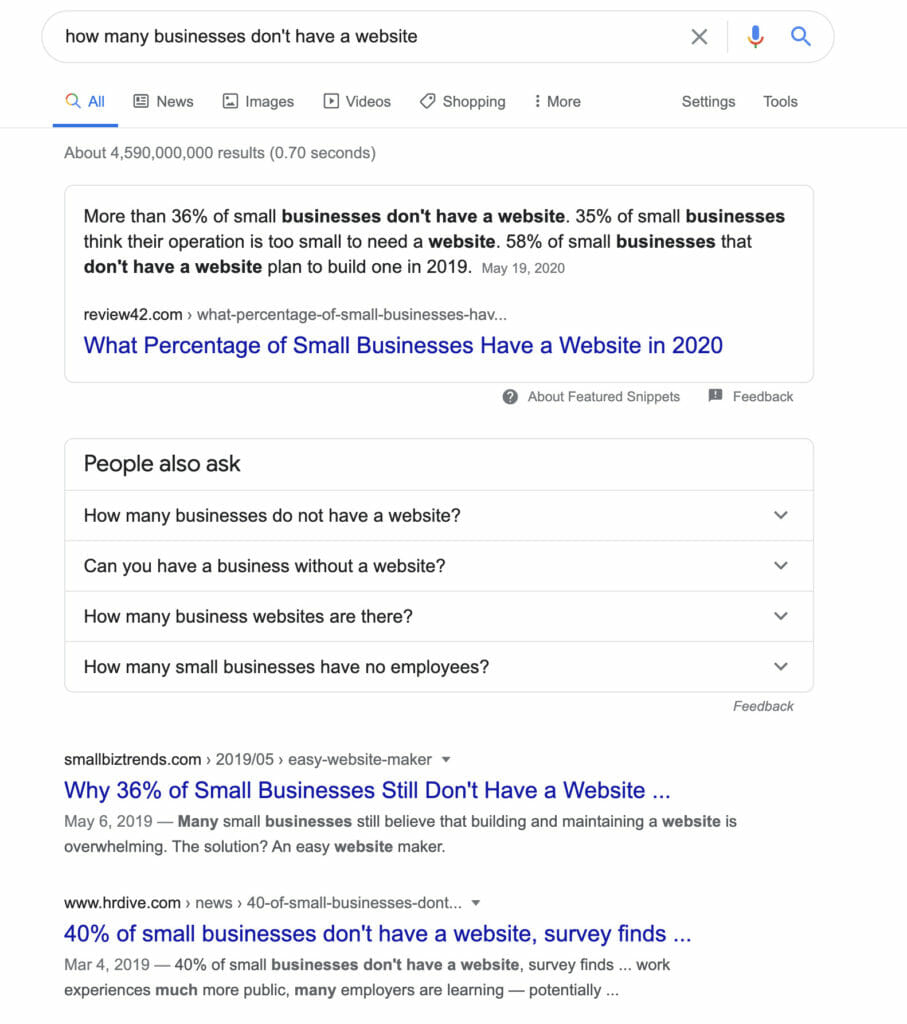
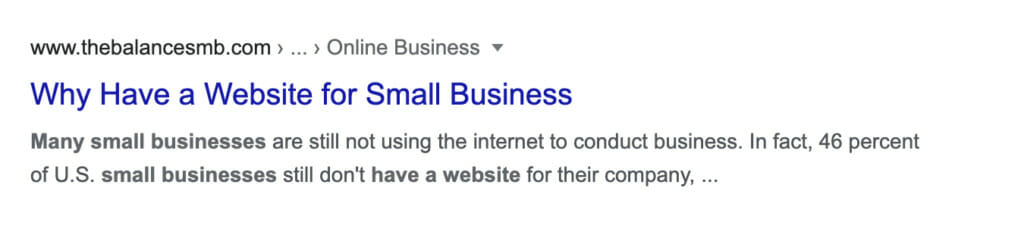
Yes, 40% of small businesses don’t have a website—if you believe a 500-company sample from years ago.
What about the claim that only 40% of small businesses have a website?

For most marketers, that seems like an incredibly large percentage, given that customers are spending more time purchasing online.
A lot of people are trying to transact online these days. It doesn’t matter if you’re Amazon or a mom-and-pop shop – More and more people want to do that transaction online, or start that transaction online, and a digital presence makes you more legitimate.
Jackson Fox, user experience director at Viget.
Having a website is a no-brainer, especially because of the many cost-effective tools that make it easy to build a site with little technical knowledge.
But again, a closer look at the claim quickly reveals a few cracks.
One study, done by Visual Objects, which has been widely cited, was based on a survey of only 529 small businesses.

Obviously, roughly 200 businesses not having a website isn’t representative of all small businesses and the study doesn’t have any additional data about whether it’s a representative sample. Yet, that’s the way it was framed on dozens of websites and publications.
Furthermore, in that same study, 23% of the respondents noted cost being a factor, which has decreased dramatically in recent years, thanks to the likes of DIY website builders Squarespace and Wix.
Additionally, the study did not note whether the small businesses that didn’t have a website had an active social media presence (e.g., a Facebook page), which could be considered a replacement.
People did check their email right after waking up…in 2012.
What better way to increase your open rate than to send your emails when your list wakes up?
With 50% of people beginning their day emailing in bed, marketers should rush to send emails first thing in the morning. Right?
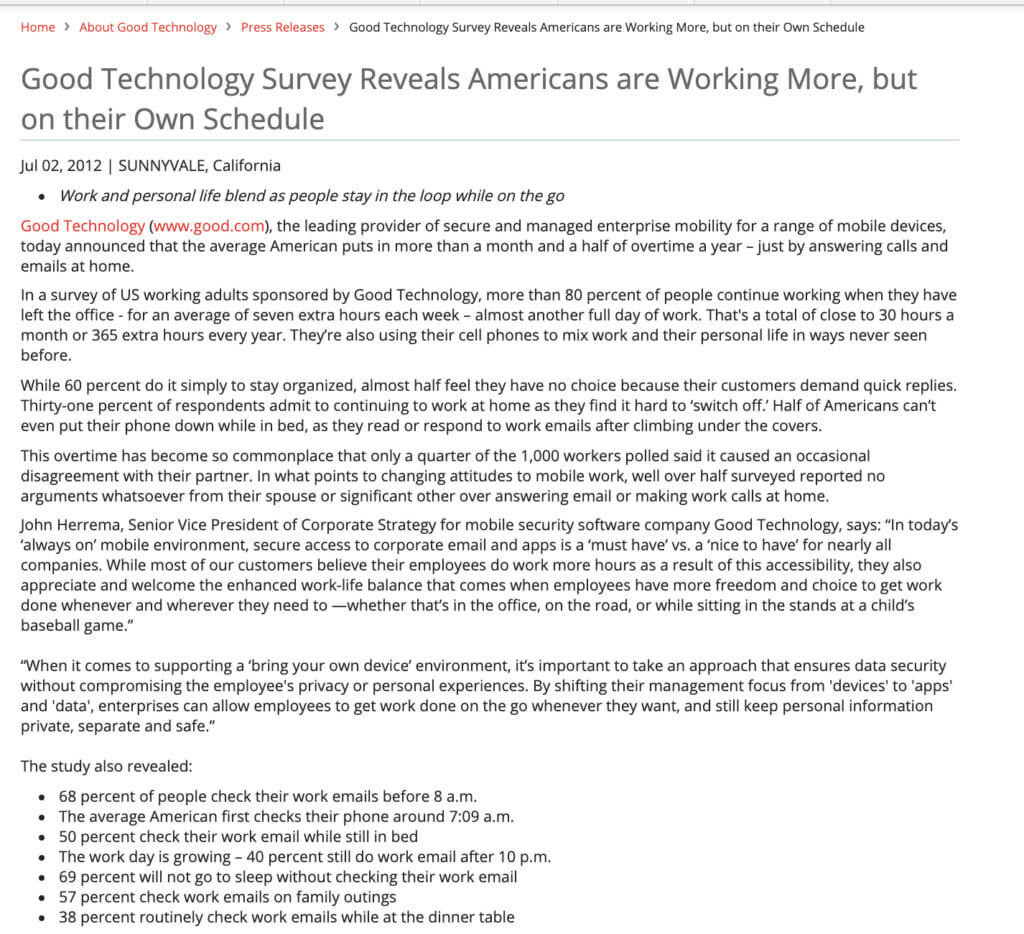
The claim that 50% of people check their email first thing when they wake up was first shared in a May/June 2014 issue of MotherJones and continues to be cited in prominent marketing statistic roundups (yes, even those “updated for 2020”).
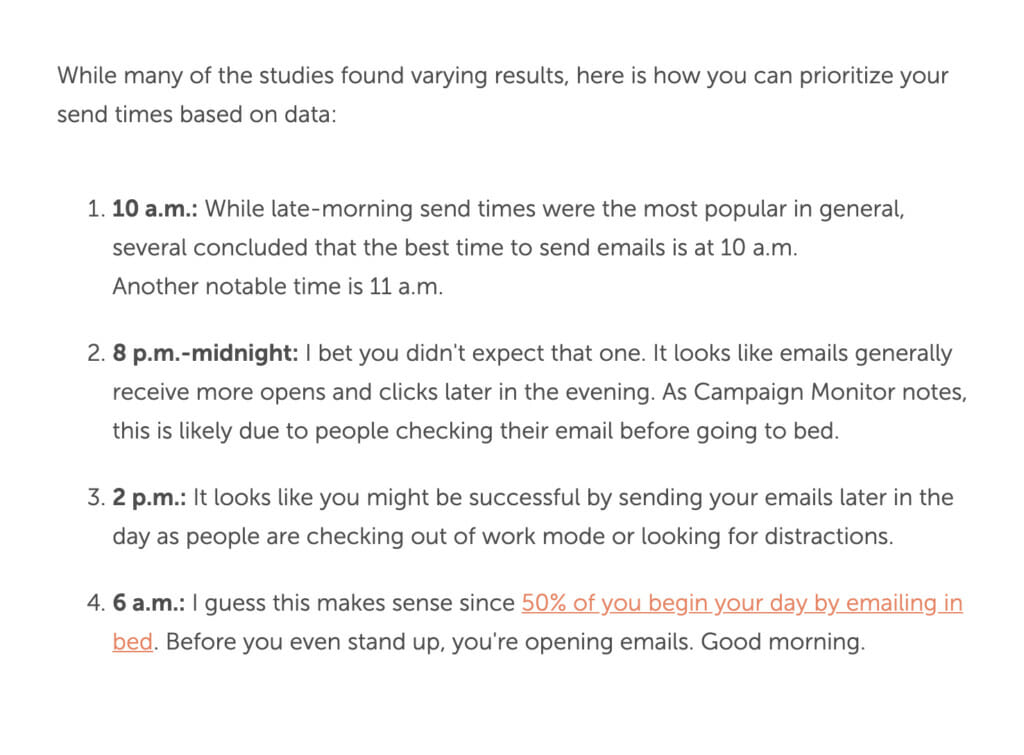
The study, cited by MotherJones, was based on a survey of 1,000 workers by Good Technology, which was done in 2012—eight years ago!
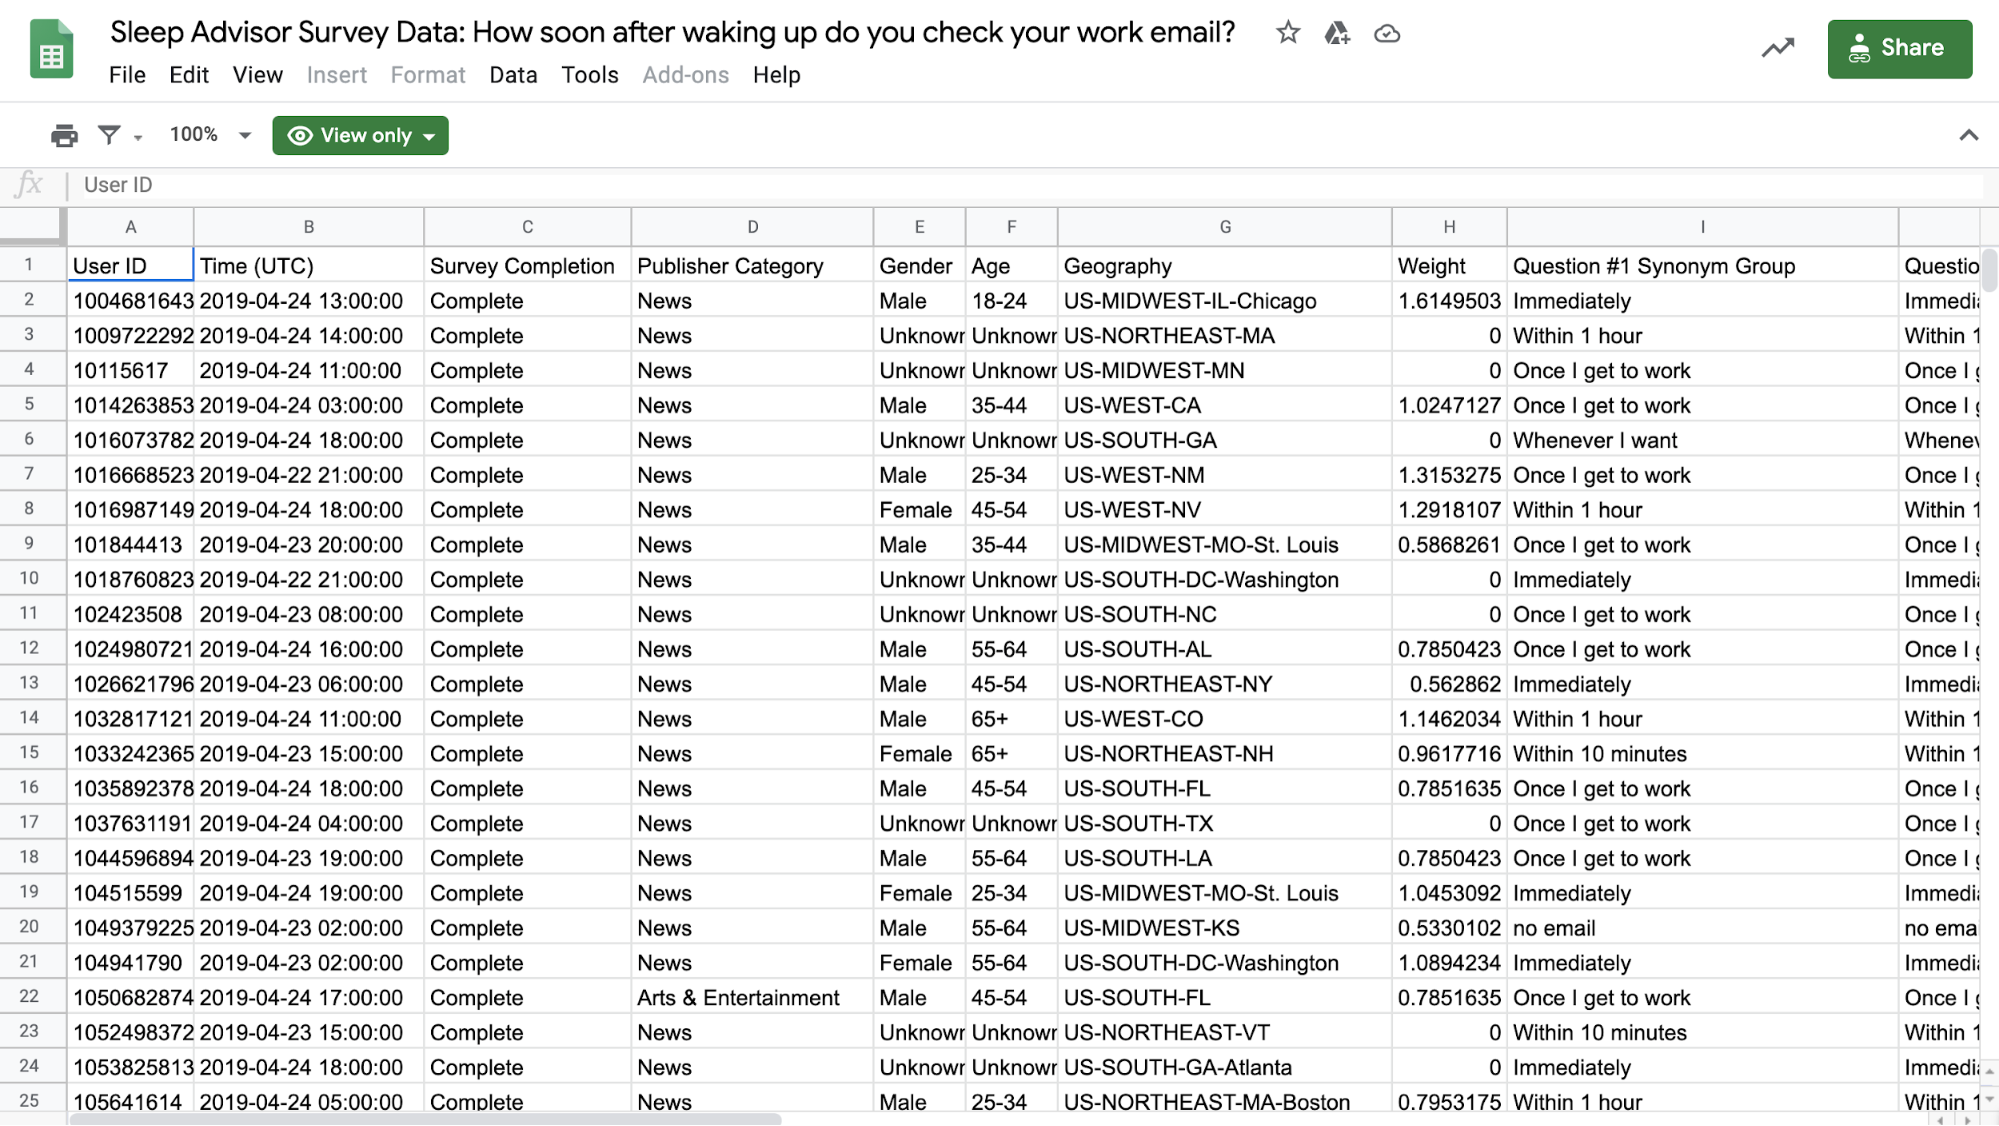
More recently, SleepAdvisor surveyed 1000 Americans about their email consumption habits in the morning and found that:
- 55% of people check their email some time before they go into work.
- 17% of Americans check their email immediately upon waking up.
They even shared their data in a publicly viewable Google Sheet. There’s quite a bit of difference between 50% of people checking their email when they wake up vs 17%. Different surveys are going to yield very different results—no single survey gets to define the ultimate truth.
While the general trend of individuals checking their phone in the morning may be increasing, the fact that the research is over eight years old should be some cause for alarm. Back in 2012, for example, Google+ was the latest up-and-coming social network, expecting to reach 400+ million active users. Slack didn’t exist, and Zoom was just a year old.
Ideally, your email marketing strategy should be changing every few months based on recent data, and certainly not off a study that was done nearly a decade ago. If you’re going to rely on eight year old email marketing best practices, than you’ll also want to spend time setting up a Myspace account, and ignore making your website mobile friendly.
To CoSchedule’s credit, who listed the stat above, it all comes down to testing. Different audiences will respond differently to different send times, it’s up to you find out what works best for your list. But if you’re going off outdated stats to kick off your marketing strategy, you’re going to have a bad time.
Do you really retain a message more effectively when watching a video? No one seems to know.
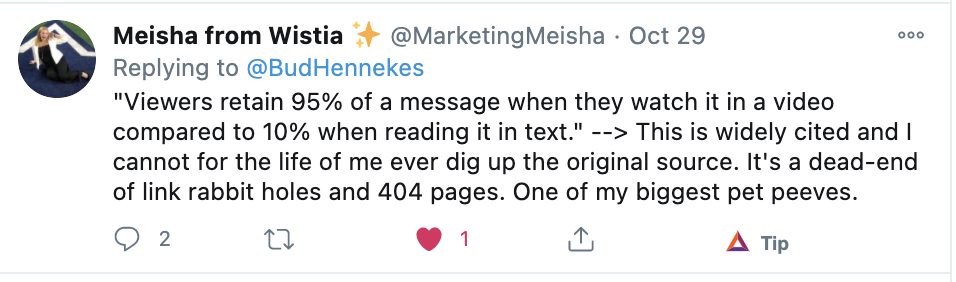
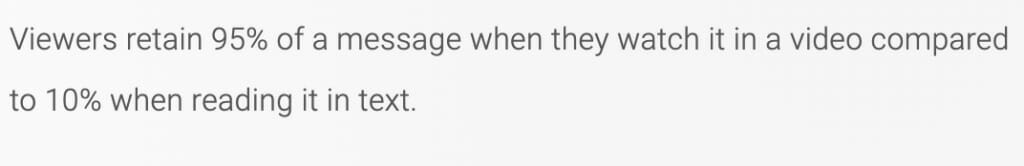
Another commonly cited stat is that we retain 95% of a message when watching a video compared to 10% when reading text.
It took a bit of research to get to the bottom of this claim, but PopVideo lists the statistic in their article: “Looking at the facts-why video content has the highest retention rate” and is the source used by many online.
Given that they are a video agency, it makes sense that they want to highlight the value of video, but as with other stats we vetted, the claim appears to be quite outdated.
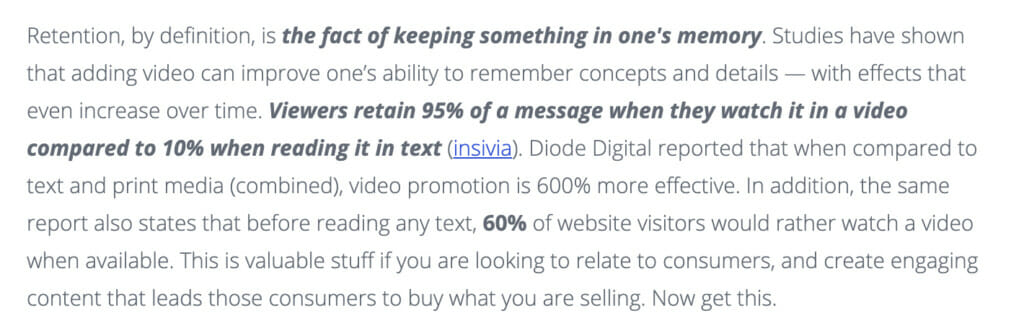
And that’s the lesson here—it’s not uncommon for an unsourced stat from 2013 to get recycled in 2016/2017 and proliferate everywhere with no one being able to trace it back to its source… ever.
Once it’s a few degrees removed, it’s easy to fall into the trap of citing a psuedo-source from a respected publication, and the wheel of endless sources keeps spinning.
At best, this claim is outdated, but without knowing the true source of the claim, it remains unclear how accurate it is or what the study consisted of.
Only 1 in 7 AB tests are winners, give or take.
In the world of AB testing, it’s “common” knowledge that most of your A/B tests will fail.
The 1 in 7 A/B tests stat can be traced back to Rahul Jain of VWO, who shared findings from a short survey of customers in their VWO app to better understand the A/B testing industry.
Other industry leaders, such as Noah Kagan, found similar results. Sharing his experience with VWO.
AppSumo.com reaches around 5,000 visitors a day. A/B testing has given us some dramatic gains such as increasing our email conversion over 5x and doubling our purchase conversion rate.
However, I wanted to share some harsh reality about our testing experiences. I hope sharing this helps encourage you not to give up with testing and get the most out of it. Here’s a data point that will most likely surprise you:
Only 1 out of 8 A/B tests have driven significant change.
In yet another study, Convert.com analyzed 28,304 tests picked at random by Convert customers and found that one in five CRO experiments is a statistically significant winner.
So when it comes to A/B testing, yes, most of your tests will fail. Whether that means 1/7, 1/8, or 1/5 will vary, but the 12.5–20% failure rate seems to hold up as an industry average.
Does it cost 5–25x more to acquire a customer?
Another commonly cited stat, this one has been embedded in marketing lore for years. Assuming the statistic is accurate, it could have a profound impact on your overall marketing strategy. If it costs 5–25x more to acquire a customer, retention deserves most of your attention.
But is it true?
The old rule of thumb was that it cost 5x more to get a new customer than it did to keep an existing customer. However the 5x rule is based on mass-produced products, and business models that focused on pushy sales tactics.”
Blake Morgan Senior Contributor to Forbes
It gets even more interesting.
As shared with IPOS, the authors of the book the Loyalty Myths argued that any retention strategy based entirely upon this myth is a recipe for financial disappointment:
Although it is difficult to determine the exact origins of this platitude, the earliest sources that we can find attribute it to research conducted by the Technical Assistance Research Project (TARP) in Washington, D.C. in the late 1980s.
Around the same time, other loyalty pundits claimed exactly the same findings as their own (for example, the Customer Service Institute, Consumer Connections Corp., and ITEM Group). Soon the myth found its way into the pages of prestigious journals and books…. popular business strategist Tom Peters likewise repeated the myth in his best-selling book Thriving on Chaos. This myth is so pervasive and so seemingly intuitive that it has stood unchallenged for 20 or more years!
Most notably, this belief fails to acknowledge that a company’s customer base is made up of a broad mix of customers who vary in their costs to acquire and retain. Before you begin focusing solely on retention, make sure the numbers work for you.
5 ways to improve your approach to stats and research
So how can you effectively use research and stats in your own content?
1. Beware of bias.
When linking to any statistic or research, spend a few minutes familiarizing yourself with the original source. Do they have any bias that may affect the positioning of the research?
Remember the stat about information retention while watching video?

Every company has biases, but you should at least be aware of potential conflict of interest.
As Rand Fishkin or SparkToro notes, Google has a strong incentive to downplay their market share of search; SimilarWeb doesn’t have a strong reason to bias one way or another. He says, cite your source (obviously) mention its recency, biases, and potential incentives.
2. Update your content regularly.

Research and stats are naturally going to change over time. Set aside time to update your content on a regular basis, looking specifically for claims that are out of date or potentially inaccurate.
At CXL, we update about a quarter of our posts each year, and a big part of that is checking studies we’ve cited to see if there’s updated data.
One way to offer more transparency: When updating, don’t use terms like “recent” (e.g., “A recent study…”) because it won’t be a recent study after the post sits online for a few years. Use the actual date (e.g., A 2018 study…).
If you do cite a dated study because it’s the only one out there, let people know (e.g., “According to a 2014 study, still the only study on the topic as of November 2020…).
3. Be skeptical of “Updated for 2020/2021.”
Google clearly favors (in most cases) updated and recent content. But just because an article on the front page of Google says it’s “updated for 2020” doesn’t mean those stats are actually up to date. When using stats, always work to find the original source. The stats in that “2020 article” are often from years earlier.
4. Cite your source with the stat and link to the original research.
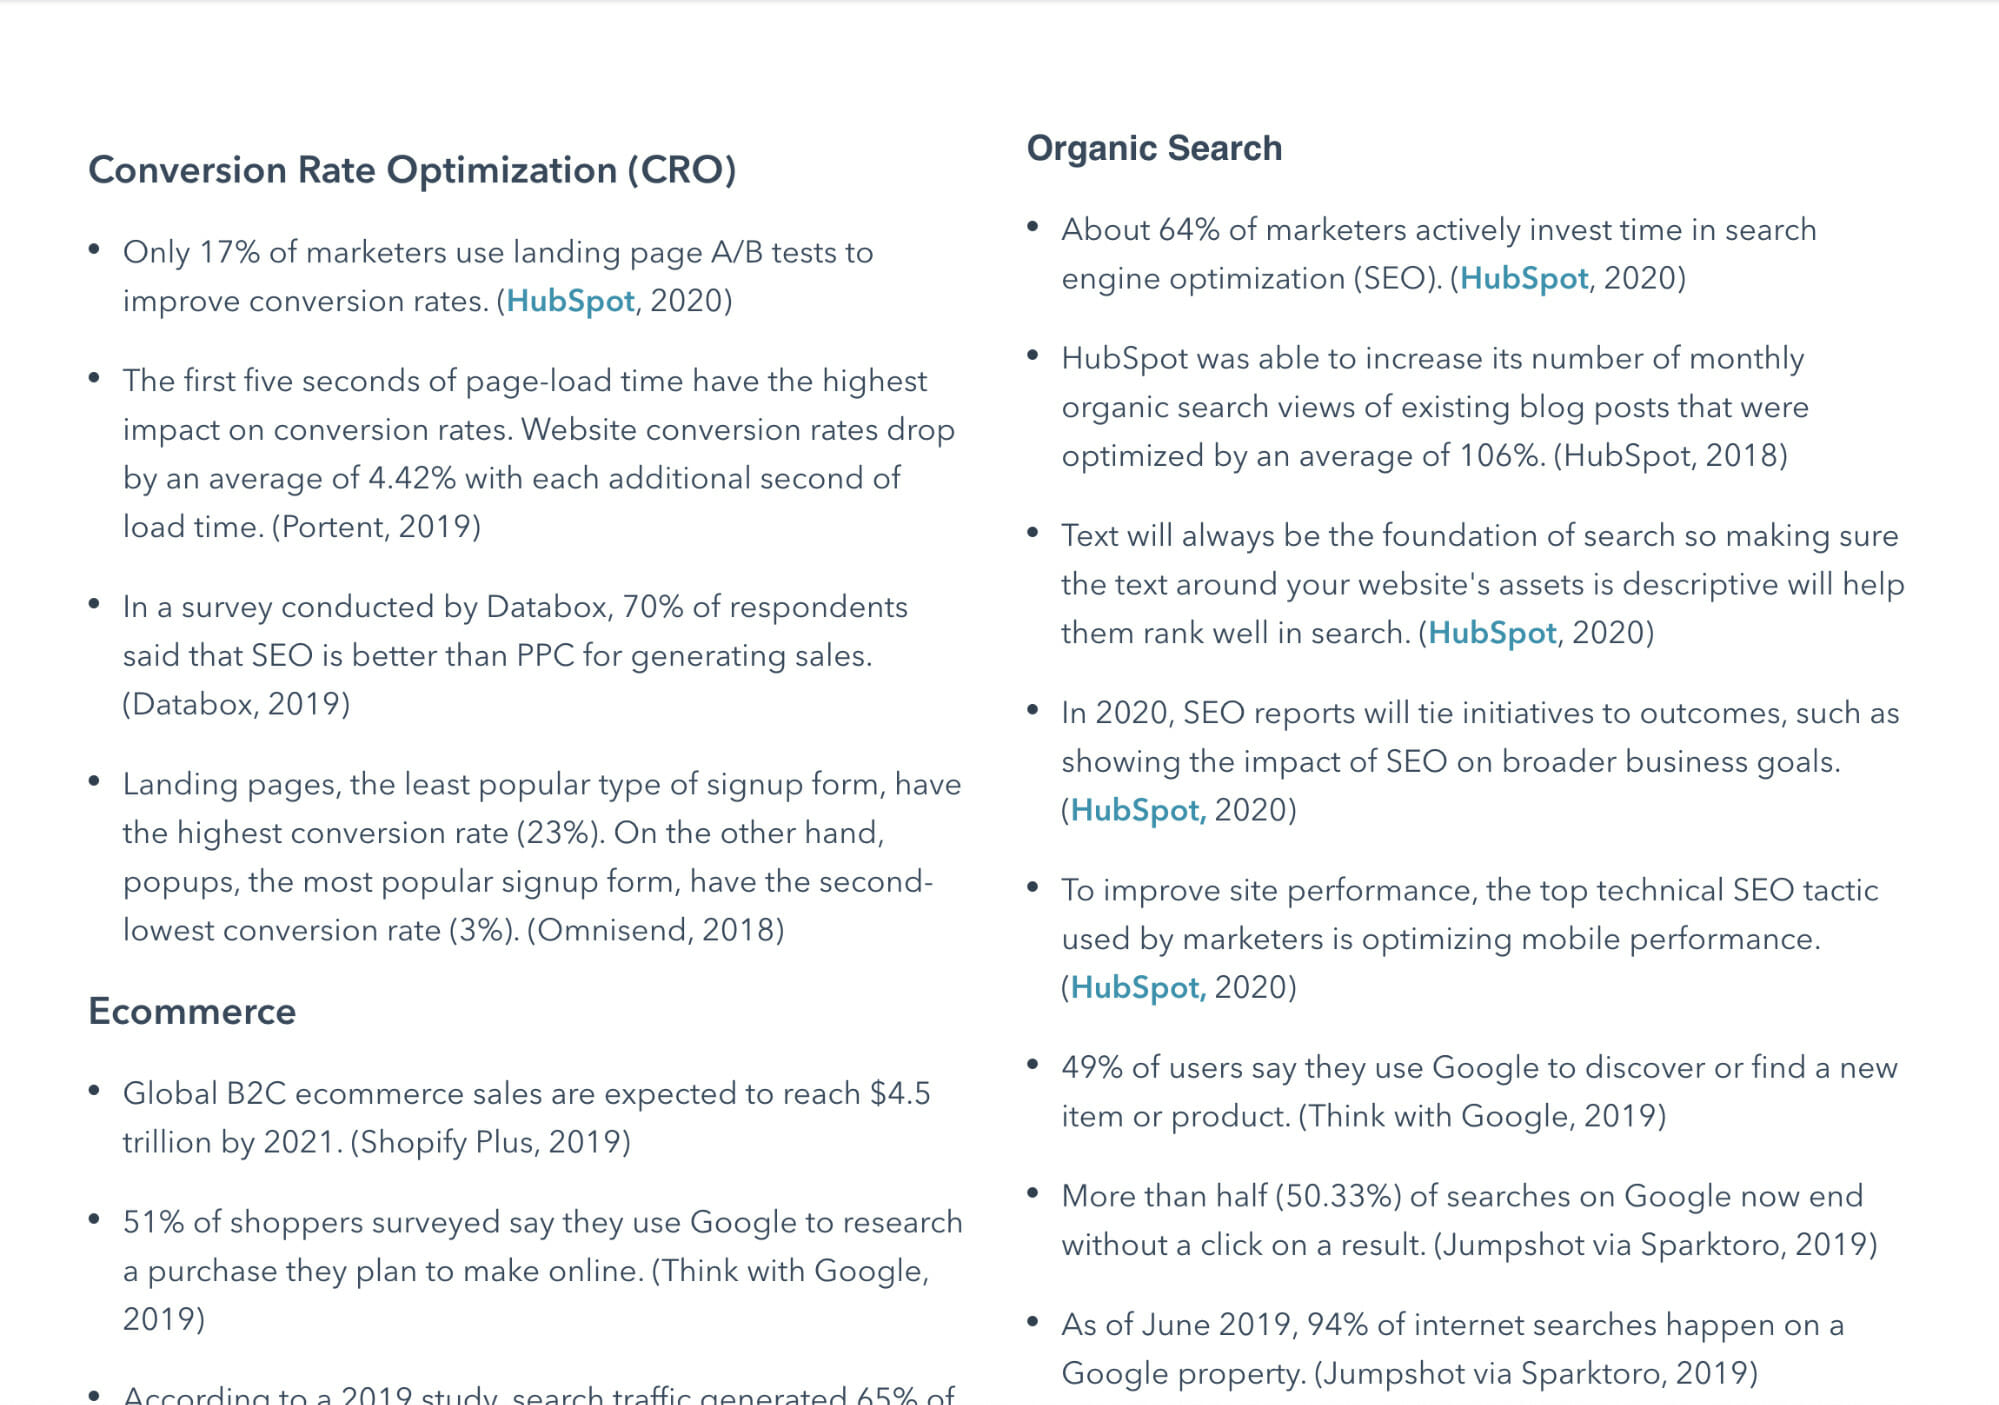
When possible, always include the stat and an in-line link to the original research (bonus points if it’s downloadable). Here’s a great example from HubSpot.
While including your sources at the end of an article is better than not listing them at all, avoid throwing a bunch of links at the bottom, which makes it more difficult for readers to find your data sources.
5. Set a higher standard.
Including research and statistics in your content is difficult. It takes time to do it the right way, but no one benefits from a massive list of misleading or out-of-date statistics. You’re not doing your audience or the marketing community a favor by including an undated stat from 2012 in your 2020 list.
Meisha Bochicchio, Content Marketing Manager at Wistia has established rules at Wistia to push her team to that higher standard:
When I started at Wistia, I implemented a formal policy on referencing research and stats. First and foremost, we always link to whatever source or statistic we reference. Second, we always make an effort to track down and link to the original source. This is often easier said than done as it takes additional time and is a fairly manual process. It would be much easier to simply link to whatever listicle includes a shiny number or impressive stat, but we want to be sure that anything we are referencing in our content is accurate and legitimate. Ultimately, if we cannot get to the bottom of a source, we simply won’t include that point in our content.
Conclusion
As marketers, the quality of your content is only as good as the quality of your research and statistics. Here’s how to get it right.
- Always cite your sources.
- Check for bias of each study or statistic.
- Find the original source, even if it takes you an extra few minutes; if you can’t find the final source, don’t include it—or include clear qualifiers about its validity.
- Update your content regularly.
- Question commonly cited stats.
Related Posts
-

Thinking about emailing influencers to ask them for backlinks or tweets? Most people are terrible…
-

One of the hardest things for any internet marketer is to figure out what to…
-
ABM works - when it's done right. Taking shortcuts can cost you time and money.…
-
U.S. companies spend billions on training each year. What about marketing departments? How much do…


Hi Bud – Thanks for sharing your wisdom! Your article does a great job of debunking a lot of myths that marketers (myself included) have relied on to shape strategy. With that said, and most of the usable statistics now somewhat debunked, can you share any direct links to find reliable statistics on these same topics? Meaning – what are your go-to sources for this type of directional support/insights? Any help is appreciated – Thanks, Jason