Data is big business. 90% of corporate strategies involve investing in data to reach new audiences and personalize experiences.
But what if the data they’re relying on isn’t accurate? Most analytics setups are flawed. And broken configurations and skewed results often lead to misguided decision-making.
Since bad data is worse than no data, this means most popular analytics tools (including Google Analytics) are leading most businesses astray.
If you’re using data to guide your marketing, it’s critical to make sure that data is trustworthy. This post will help you audit your analytics and stay on track to meet your business objectives.
Table of contents
- Missing your marketing campaign targets? Audit your analytics
- How to audit data analytics for better marketing performance
- Identify the KPIs that matter to your marketing
- Review your current analytics setup to improve data quality
- 1. Check that analytics codes are correctly installed
- 2. Verify user access to maintain security
- 3. Check that data is segregated to deliver accurate results
- 4. Ensure filters exclude irrelevant data
- 5. Compare analytics data with back-end figures
- 6. Check that you’re not collecting Personal Identifiable Information (PII)
- 7. Does tracking match your marketing goals?
- How to perform a Google Analytics audit (i.e. health check)
- 3 common Google Tag Manager issues:
- Conclusion
Missing your marketing campaign targets? Audit your analytics
Marketing data analytics has two central purposes:
1. To measure the effectiveness of your marketing campaigns;
2. To determine what you can do differently to improve results across your marketing channels.
The raw data that analytics collect informs your marketing strategy and lets you create an action plan that delivers more bang for your buck.
But improvements can only be made if the data stacks up, and simply having analytics running offers no guarantee that it does.
According to a study by Netacea, 68% of businesses say they’ve been affected by skewed analytics to the cost of 4% in yearly lost revenue on average. That makes bad analytics data as damaging as ad fraud (using bots to fake clicks on ads), which costs businesses $42 billion annually.
Skewed data can occur for several reasons:
- Errors in data sets. Redundancies, typos, irregular naming, and incomplete and outdated data.
- Lack of normalization. Data not being transferred in a consistent format to allow for comparable and compatible analysis (e.g., one data set showing annual income and another showing quarterly income).
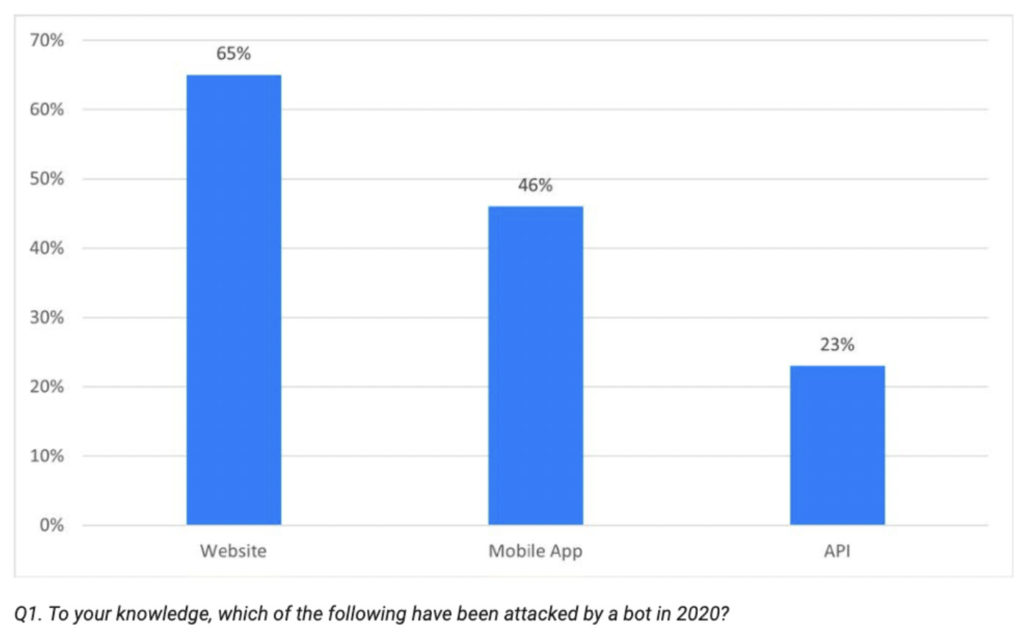
However, a bigger issue is bots.
Hackers and scammers use bots to click ads and waste advertising budgets, buy goods, steal content through bulk scraping, hack accounts, and steal card details. Such activity impacts the data you see.
Even if the bots don’t target you directly, they skew statistics so you’re not seeing what’s really happening in the market.
The result is poorly executed campaigns and wasted spend. Netacea’s research shows that over half of businesses have run special promotions, ordered new stock, or burned through their marketing budget because of incorrect analytics.
Brian Uffelman, VP and security evangelist at PerimeterX told Ecommerce Times:
With bots often accounting for up to half of web traffic, losses from bad business decisions made due to skewed analytics can be significant, ranging from millions to a few billion dollars.
Bots skew many KPIs and metrics, including user tracking and engagement, session duration, bounce rates, ad clicks, look-to-book ratios, campaign data, and conversion funnel.
For ecommerce, travel and media sites, unauthorized scraping bots mimic humans by dynamically checking listings, pricing and content resulting in skewed data.
A marketing analytics audit assesses the data quality and credibility to prevent skewed information. It’s a risk assessment that ensures the figures you rely on for decision-making are accurate and relevant.
Regular auditing gives you confidence that your data will improve—not damage—marketing campaigns.
Auditing asks the right questions
Marketing analytics is any type of data analytics that assists you in your marketing efforts. This can include web, social media, or sales analytics, and a wide range of analytics tools, such as:
- Google Analytics;
- Adobe Analytics;
- Google Ads;
- Marketo;
- Salesforce;
- Woopra;
- Hootsuite;
- Sprout Social;
- SEMRush;
- Ahrefs.
But regardless of channels or software, analytics covers one or more of three main categories:
- Descriptive analytics. Using data to find out what happened in the past. For example, using Google Analytics (GA) to measure how many page views and clicks a blog post had in 30 days versus a similar post you’ve published in the past.
- Predictive analytics. Using machine learning algorithms to make accurate predictions about future outcomes, such as identifying profitable segments based on audience demographics, interests, and behavior.
- Prescriptive analytics. Using past data to recommend impactful next steps. For example, if predictive analytics suggests a boost in new visitors, prescriptive analytics can help you identify the best products and messaging to promote.
A marketing analytics audit can be applied identically to descriptive, predictive, or prescriptive analytics to answer the same questions:
- Is data accurate? Can data be trusted, and does it line up with other systems? For example, is GA data accurate with data from your ecommerce software?
- What’s missing? Are you getting the full picture from your data? Is everything set up and configured correctly? Is anything broken?
- Is the data meaningful? Are metrics relevant to what you’re trying to achieve? For example, are likes really meaningful, or are clicks the better metric?
- What can you measure and analyze for more meaningful results? What tracking can be put in place for optimal insights, team accessibility, and actionability?
- Have you done proper quality assurance? Do numbers make sense? Numbers that are too surprising or different should never be taken at face value
How to audit data analytics for better marketing performance
The marketing analytics audit process is broken down into two parts:
- Identify what to measure;
- Review your current analytics setup.
Before we get into these steps, it’s important to acknowledge that analytics data is never perfect.
Don’t expect to be able to achieve 100% accuracy between data sources after auditing. Ad blockers, device type, javascript errors, page timeouts, disabled cookies, different methodologies between tools, and bots will all influence data.
Google Analytics uses sample data to generate reports. For example, if you create a custom report in GA with a data range that includes 700,000 sessions, Google won’t use all of those sessions. Instead, it might use half and provide an estimated total, making it easier to load the report.
On data sampling, Google’s help page says:
In data analysis, sampling is the practice of analyzing a subset of all data in order to uncover the meaningful information in the larger data set.
For example, if you wanted to estimate the number of trees in a 100-acre area where the distribution of trees was fairly uniform, you could count the number of trees in 1 acre and multiply by 100, or count the trees in a half acre and multiply by 200 to get an accurate representation of the entire 100 acres.
If you have 90–95% accuracy, you have good data to work with. If you’re presenting data to stakeholders, it’s important to make it clear that data can’t be 100% trusted.
Identify the KPIs that matter to your marketing
The wider you cast your net, the greater your chances of capturing irrelevant information that doesn’t contribute to your overall objectives. The first step of your internal audit is to be clear on what’s important to measure for your marketing goals.
Review your current marketing campaign strategy and measurement plan. Marketing tactics should align with key performance indicators (KPIs).
For example, if your marketing campaign involves creating more blog content, a supporting KPI might be to increase branded organic search traffic. If increasing website traffic is the most important KPI, a metric such as social media followers might be less valuable and not worth measuring in this campaign.
Here’s an example of a marketing plan by Fresh Egg:
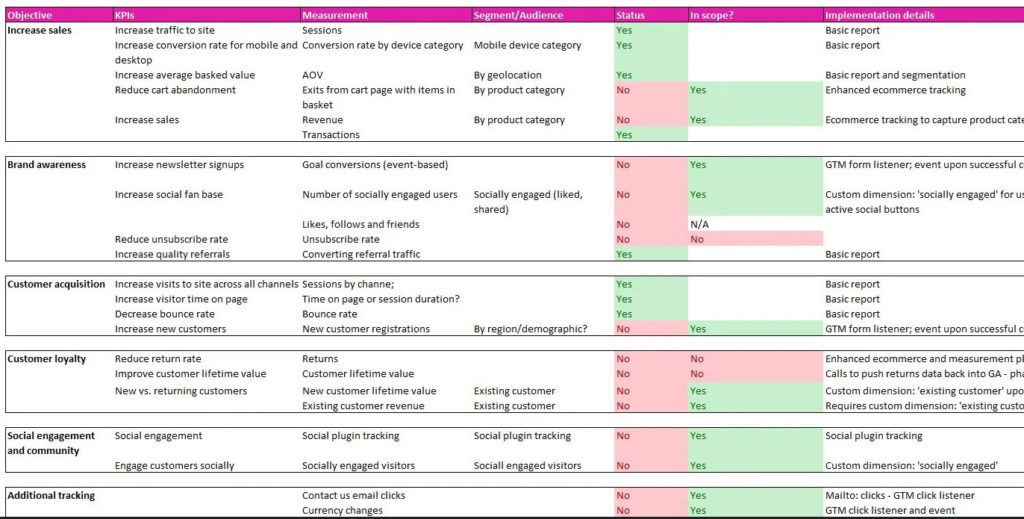
Look closely at your KPIs and assess each one for relevance.
- Does it utilize obtainable data (i.e. does the data help improve marketing effectiveness)?
- Does it relate to your marketing objective?
- Is it a ratio or comparison (e.g., a KPI for boosting user engagement might be to increase session duration or time on site for one period versus another)?
- Is it easy to report on? Can your team easily understand the KPI and why it matters?
Anything that isn’t relevant does not need tracking.
Next, ensure company-wide analytics is aligned. For example, can sales be attributed by channel?
Attribution is important for the marketing team to understand how their efforts have led to a sale and for the sales team to see whether their material results in conversions. It’s useful for audit teams to be made up of members of marketing and sales to check audit quality as it relates to their needs.
Check that custom channels are in place for specific KPIs. For example, if you’re using social media as part of your marketing campaign, is organic social segregated from paid social and content shared by your audience?
Tracking each channel separately will make it easier to report on and assess how campaigns contribute to marketing and company goals.
Marketing strategy evolves with every campaign. Review your measurement plan to assess the value of KPIs at least annually, but preferably quarterly or when you launch a new campaign.
Review your current analytics setup to improve data quality
While audit teams will benefit from specialist data science and technical skills, analytics tools are increasingly user-friendly. Anyone familiar with your company’s analytics platforms can carry out this internal audit analysis.
Before starting, to fully assess performance, you’ll need admin-level access. If you don’t already have this, ask your system administrator for access.
Make a list of the items you need to analyze and ensure correct configuration. The items on this list will relate to metrics that matter to your KPIs.
For example, if you run an ecommerce store and your objective is customer acquisition, you’ll want to review ecommerce tracking.
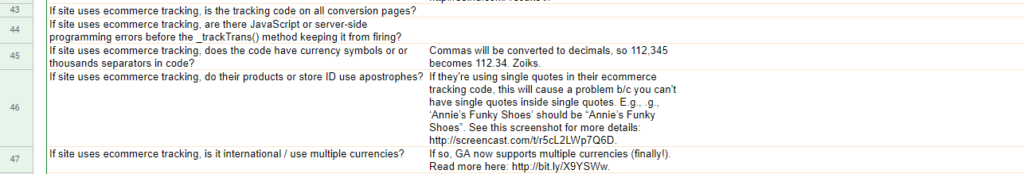
Amongst other checks, Annie Cushing of Annielytics runs the following analysis when carrying out Google Analytics audits:
- If site uses ecommerce tracking, is the tracking code on all conversion pages?
- If site uses ecommerce tracking, are there JavaScript or server-side programming errors before the _trackTrans() method keeping it from firing?
- If site uses ecommerce tracking, does the code have currency symbols or thousands of separators in code?
- If site uses ecommerce tracking, do their products or store ID use apostrophes?
For a breakdown of how to run a full GA audit, check out our DIY health check guide.
Your specific checklist will differ depending on your marketing and measurement plan, but there are eight essential tasks that every audit should complete.
1. Check that analytics codes are correctly installed
The integrity of your data depends on analytics codes working correctly. The first thing to check is that you’ve installed the code (or Google Tag Manager code for Google ads) correctly on all pages of your website.
The analytics code should be pasted in full just before the closing </head> tag. It will work if installed in the body or footer section of your website code but will take more time to load and may not capture all data.
Tracking related issues will be evident in real-time reports. If you have active visitors and the tracking code isn’t sending information in real time, the code isn’t working correctly.
Use one of the following tools to verify the correct installation:
2. Verify user access to maintain security
Do the right people have the correct access and permissions to your analytics? Research from Beyond Identity shows that almost 25% of employees say they still have access to accounts from past workplaces.
Since analytics are cloud-based platforms, anyone with access to your data that doesn’t need it compromises security.
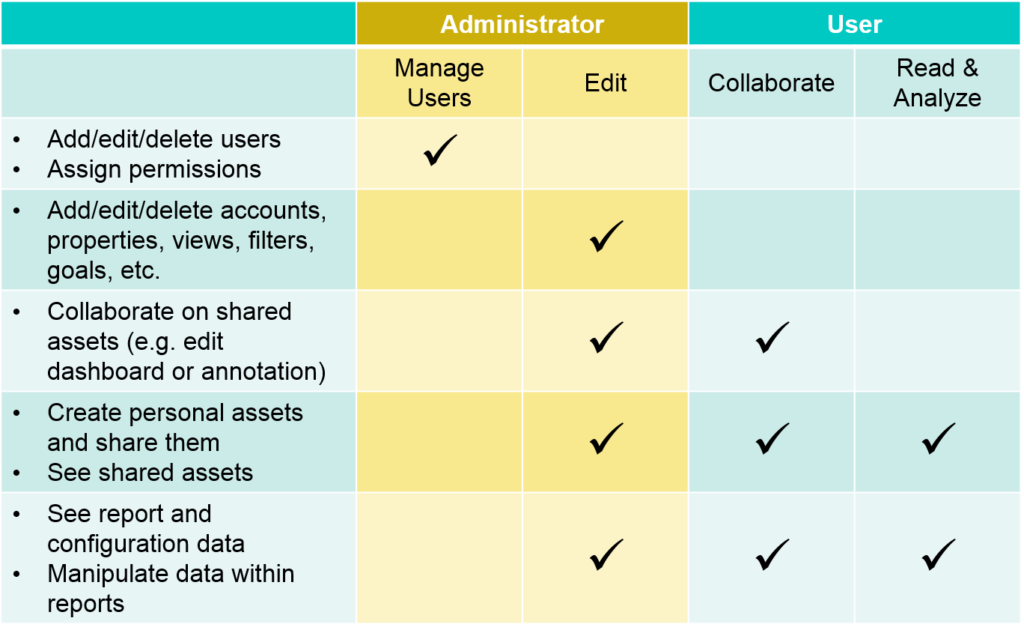
Access details will be available in your admin panel, control panel, or user settings. Each user will typically have a role. In GA, there are four user levels:
- Administrator. Full control of analytics and the ability to manage users and grant permissions.
- Editor. Full control of settings, but cannot manage users.
- Analyst. Can create, edit, delete and share property assets (e.g., custom reports, dashboards, and conversion segments), and can collaborate on shared assets.
- Viewer. Can see data but cannot edit, delete, share, or collaborate.
This chart by ClickInsight highlights which permissions should be reserved for administrators and which should be assigned to users:
Have a system in place that notifies your analytics administrator of an employee leaving the company or changing roles so that access can be updated. This can be as simple as an email or message in your project management system.
3. Check that data is segregated to deliver accurate results
Data segregation is crucial for accurately showing how your audience engages with your website and marketing campaigns.
Without clusters in place, you’re likely tracking employee usage and test traffic. Employees will use your website in specific ways when testing different page aspects. This will often be different from how a visitor will navigate the page. Bundling data together may skew your analytics favorably or negatively.
Check that web data is segregated into three views:
- All data. Leave this view unfiltered so you can easily access everything collected and not risk losing useful information.
- Test data. Use this view to test new filters and see how traffic is affected before it gets added to your main view. By testing first, you can ensure visitors you expect to show up aren’t being filtrated, giving you more reliable results.
- All data + filters. Make this your view for day-to-day analysis. Here is where you can add tested filters.
You may also want to separate data by internal and external traffic to exclude marketing team actions from visitor data.
4. Ensure filters exclude irrelevant data
Filters are designed to limit the information displayed in tables, graphs, and reports. For example, you can use a filter in social media analytics to show data for a specific keyword such as brand mentions.
Review all filters and check they are up-to-date. For web traffic, pay particular attention to IP address filters. Many devices use dynamic IP addresses, which are assigned by a network when they connect to the internet and change over time. They don’t always change, but if they do, filters will no longer exclude data.
Automation filters should also be in place to block bot traffic and prevent distorted data.
In Google Analytics:
Go to Admin > View > View Settings and ensure Bot Filtering is checked (this is done automatically in GA4).
In Adobe Analytics:
Go to Admin > Report Suites > Edit Settings > General > Bot Rules and ensure Enable IAB Bot Filtering Rules is selected.
If you have custom bot rules set up, check that user agents, IP addresses, and IP ranges are correct.
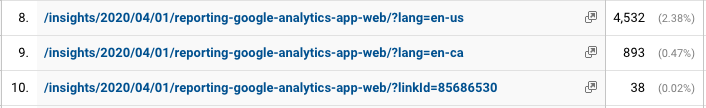
As you carry out filter checks, review any URL query parameters. Each time a query parameter is added to a URL, data are reported on a separate page. This can result in hundreds of pages being reported, making it harder to get accurate data.
There are two types of URL parameters to look for:
- Content-modifying parameters. Parameters that change the content displayed on a page. For example, “http://mywebsite.com?productid=xyz” would send someone directly to the “xyz” product page on your website.
- Tracking parameters. Parameters that pass information (e.g., which campaign or ad group the traffic came from) but don’t change the page content. For example, “https://mywebsite.com/?utm_source=newsletter&utm_medium=email” might be used to track traffic from your newsletter.
Any parameter that does not change the page content or only changes the page slightly in a way that doesn’t affect content should be excluded.
5. Compare analytics data with back-end figures
As said earlier, analytics will never be fully accurate, and you should never use data to replace your financial reporting or ecommerce systems. But numbers should closely match.
Choose a given period in your back-end reports and compare the data to the same period in your analytics (e.g., transactions in Q1).
Data should be 90% accurate or above. If that’s the case, you have reliable information to inform marketing campaigns. If it’s below that, it indicates a minor issue that may or may not need attention.
Where there are discrepancies, look at:
- Filters. Is transactional data being recorded in the back-end that is filtered in analytics? For example, if you exclude internal traffic and an employee makes a purchase, the transaction will be recorded in the back-end.
- Location. Some countries such as China, France, and Italy block GA. If a purchase is made from that country, it won’t be recorded in GA but will be in the back end.
- Timezone. Does your analytics timezone match your back end?
- Cancellation settings. If a purchase is canceled by phone, live chat, or email, it might still be recorded in analytics, but removed in the back-end. Make sure that sales data in your analytics is up-to-date. Check out Optimize Smart’s guide to reverse transactions.
6. Check that you’re not collecting Personal Identifiable Information (PII)
Personally Identifiable Information (PII) is any information that could be used to identify, contact, or locate an individual. This includes:
- Email addresses;
- Mailing addresses;
- Full names or usernames;
- Phone numbers;
- Driver’s license number;
- Passport number;
- Precise locations (e.g., GPS coordinates);
- Credit card information or SSN.
Cookie, advertising IDs, and IP addresses are not considered PII.

PII data collection is prohibited by General Data Protection Regulation (GDPR) laws in the EU and consumer data privacy laws in the U.S. and internationally, unless you have explicit permission from an individual.
Google, Adobe, and other analytics platforms also have strict privacy laws mandating the protection of user privacy that prevent personal data from being passed on.
Ensure analytics isn’t collecting PII by checking:
- Pages. Search for @ in the filter to see if email addresses are being collected.
- Event dimensions. Look at Categories, Actions, and Labels for personal information.
- Custom dimensions. Run custom reports that pull custom dimensions and make sure no PII values are being collected.
- Search terms. Check search term reports for any sign of personal details.
- Data imports. Search data sets for PII before importing them to your analytics.
If personal information has slipped through the net, notify your development team to find the source and remove it. When your site is no longer collecting PII, back up existing views for visualization and export important data.
Check that no personal details are accidentally stored when you do so, as any kind of storage can violate privacy laws. Delete the corrupted view and create a new one that’s clean of PII.
7. Does tracking match your marketing goals?
The final step is to check that analytics is doing what you want it to. Run through your marketing goals and check that the necessary data is being collected.
For example, if your goal is to drive traffic from social media, are network referrals set up to track which channels perform best? If you want more people to download your lead magnet, are you tracking form submissions? If you want to improve ad effectiveness, is revenue tracking set up to measure cost per acquisition (CPA) and return on ad spend (ROAS)?
Remember, you don’t have to track everything, only the data related to KPIs that matter to your business. Sort data into three categories:
- Crucial data. KPI data points that drive your marketing.
- Supporting data. Data points that complement your KPIs for deeper analysis and big-picture views. For example, if you’re tracking the growth rate of new users, you might also track user attribution to know where the user came from.
- Curiosity data. Data points that you’re curious about but don’t impact marketing campaigns if they’re not tracked correctly.
Analytics should adjust with your marketing needs. Use your audit to stop tracking data that isn’t important and focus on what matters right now.
How to perform a Google Analytics audit (i.e. health check)
In the past, we’ve covered setting up and using Google Analytics fairly extensively. If you haven’t already, you can read our Google Analytics 101 and Google Analytics 102 guides.
More recently, we covered segmentation and how to do it right. Still, things go wrong. A Google Analytics health check is a series of checks that help you answer the following three questions:
- Am I collecting all of the data I need?
- Can I trust the data I’m collecting?
- Is anything broken or tracking/reporting incorrectly? Why?
Our checklist will guide you, but this is an exploratory mission—especially if you’re an agency or freelancer. You might not have had control over the initial Google Analytics setup, so you might not know what to expect.
You may find new, unexpected quirks. As time goes on, add these types of issues to your checklist.
4 common tracking issues in Google Analytics
1. The basics
Starting with the basics, here’s a list of common tracking issues that Google has published:
- Using incorrect snippet and/or viewing the wrong account or view. If you track multiple websites and/or have access to multiple Analytics accounts, you might be using the snippet from another account and/or view. Make sure you are viewing the correct account and view.
- Extra whitespace or characters. Copy the snippet and paste it directly onto your website using either a text editor or an editor that preserves code formatting. Don’t use a word processor to copy the snippet from your account. Doing so can add an extra space or change the quotation marks in the tracking snippet, which requires precise formatting to work.
- Customization errors. If you’re making customizations to the tracking code, make note of the following:
- Function names are case sensitive and should have correct casing.
- Boolean values (e.g., true or false) should not be enclosed in quotes.
- Incorrect filter settings. Incorrect filter settings can affect the data you see and can inadvertently filter all data from your reports. In most cases, this occurs when users apply multiple “Include” filters.
- Other scripts on your page. If you’re running other scripts on your page, make sure you’re not using any variables that Google Analytics uses.
2. Missing pages
To identify pages that are missing your Google Analytics code, you can look for irregularities in your data. Or, you can use a tool like Google Analytics Checker.
Once you’re sure that every page of your site has the code, you need to ensure it’s the latest (asynchronous) code.
This means that instead of Google Analytics loading synchronously, it loads asynchronously to avoid blocking resources that load later on the page. Essentially, it enhances the speed at which the tracking code is loaded.
Click here for more information on async.
3. Different data in your shopping cart tool
If you’re in ecommerce, you’re likely using some sort of shopping cart tool. So, what happens when data in your shopping cart tool differs from Google Analytics?
There are four possible issues:
- Your Google Analytics ecommerce tracking isn’t properly installed. Read this thorough guide to ensure you’ve done it correctly.
- Time zone. If your shopping cart tool and Google Analytics are configured to report in different time zones, you may have mismatched data.
- Time of day. If you set up your ecommerce tracking in the middle of the day, transactions that occurred before will not appear in Google Analytics, but will, of course, appear in your shopping cart tool.
- Canceled transactions. Transactions with no value (i.e. $0) and canceled transactions do not appear in Google Analytics.
4. Cross-domain tracking
You’ve seen cross-domain tracking mentioned a few times now. What is it exactly? Chris Mercer from MeasurementMarketing explains:
It’s called “cross-domain tracking,” and it could come into play if your client’s site has multiple domains as part of their funnel or buyer’s journey. In these cases, you’ll absolutely want to setup cross-domain Tracking.
If you’re using the traditional Google Analytics (boring) try doing this. If you’re using Google Tag Manager (you should be) it’s faster to do this.”
For example, your checkout process might be on a different domain. Unfortunately, Google Analytics uses first-party cookies, which can be read only by the domain that issued them.
So, in order to do cross-domain tracking, you need to share cookie information with the different domains involved.
An alternative to the Google Analytics resource Chris provides above is Optimize Smart’s Google Analytics cross-domain tracking guide.
Perform a marketing analytics audit every three months
Research from Databox shows that over 40% of marketers perform an analytics audit monthly. If your marketing campaigns are fast-moving, this cadence might suit you.
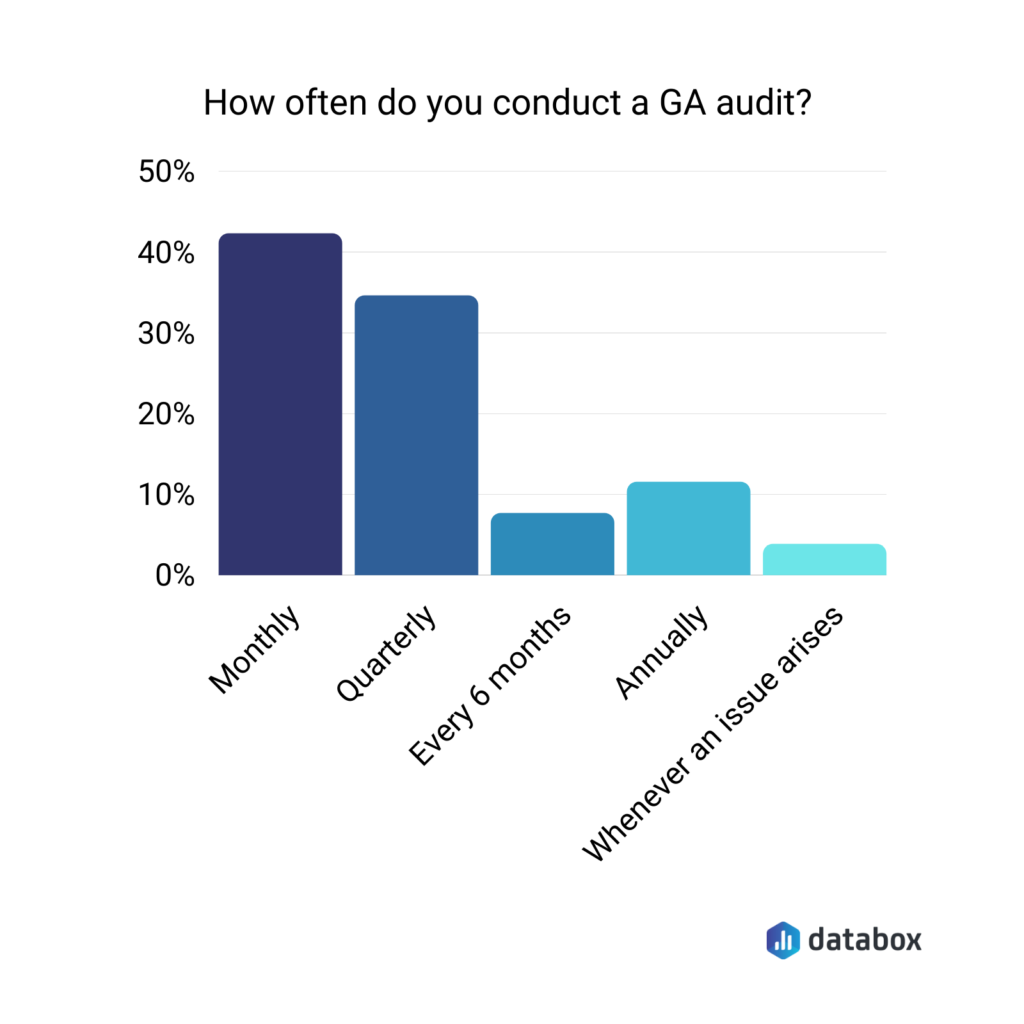
Consider that an audit can take several hours to complete. In most cases, a quarterly audit approach is enough to check and clean up data that impacts your strategy. If objectives or campaigns change between audits, use the launch as an opportunity to review your current analytics setup.
3 common Google Tag Manager issues:
Tracking issues are commonplace during the setup and use of Google Tag Manager. Here are three of the most prevalent issues to recognize during your audit, along with simple fixes:
- Tag isn’t firing. There are a number of reasons your tag might not be firing. You have unpublished changes, your triggers are too specific, your triggers are configured incorrectly, etc. Find a full list and begin troubleshooting.
- Wrong filter settings. When you apply multiple Include filters, you can accidentally end up filtering all data from your reports. Read up on how to use Include filters properly (i.e. the hit is discarded if the pattern doesn’t match the data) and Exclude filters (i.e. the hit is discarded if the pattern does match the data).
- Unpublished container. Before adding the tag, be sure you’ve published the container—or else it won’t be saved. For more information on publishing containers, click here.
Conclusion
Regular auditing stops you from basing important marketing and business decisions on bad data. Look closely at your objectives and measurement plan and focus on the things that matter. More data isn’t always a good thing if that data isn’t relevant to what you’re trying to achieve.
Take your time with the audit procedure. Ask questions of the data and configuration: Do the numbers make sense, and does your setup benefit the users?
Periodically run through your checklist and monitor essential elements. The fruits of your labor will show in future campaigns.
Learn more about digital analytics, including how to audit GA and present solutions, in our Digital Analytics Minidegree.
Related Posts
-

Over the last years, Google Data Studio has evolved from an appealing but clunky application…
-

Not long ago, it was common for marketers and web analysts to spend the bulk…
-
Set up the measurement tool. Clean and process the data. Turn it into information. Analyze…
-
Google Analytics and Google Tag Manager have limitations. Often, these limitations are outside your control…