Conversions are crucial to your business. But a good conversion rate doesn’t always mean more sales.
The magic of a conversion rate formula lies in gleaning marketing insights. It’s a window into what’s working and what isn’t so you can test, optimize, and improve.
In this article, we’ll explore how to calculate conversion rates and its application across different channels and customer journeys. We’ll also dive into the relationship between conversion rate and profitability and how to leverage your conversion rate formula to drive optimization efforts.
Table of contents
What is the conversion rate?
Conversion rate refers to the percentage of users who visit your website a complete your desired goal (a conversion), out of the total visitors.
How to calculate conversion rate
Conversion rate can be calculated with the following formula:
(Number of Conversions / Number of Visitors) * 100
For example, let’s say we generated 12 purchases from 240 visits to a product page. The conversion rate from visit to purchase is 5%:
(12 Purchases / 240 page visits) * 100 = 5%
However, this formula is missing context. For big-ticket items, a 5% page conversion rate on 240 website visitors is a big win. Those same numbers for a t-shirt brand tell a different story—one where volume is the antagonist.
The method for calculating conversion rate varies by channel, sales cycle, and stage of the marketing funnel. The benchmark for a good conversion rate depends on factors like pricing, average order value (AOV), and lifetime value of a customer (LTV).
Context also matters around traffic sources and customer journey stages. For example, if you’re investing in Facebook Ads—where CPA is on the rise—you’ll need healthy conversion rates to ensure a positive ROAS.
On the contrary, you’re likely to afford a modest average conversion rate from search traffic. If you consistently generate 100,000 unique visitors a month at a 1.2% conversion rate, that’s 1,200 new customers. From here, the levers you can pull to increase bottom line are:
- Increase search traffic
- Increase conversion rate from organic traffic
But again, context matters. Increasing search traffic comes down to creating new landing pages and content. The question is, what should you prioritize? The answer is usually “more of what works.”
From this example, conversion tracking should be used to generate insight on your marketing and customer journey.
Examples of calculating conversion rate
With this in mind, let’s look at some more specific conversion rate formula examples.
Ecommerce purchases from Facebook Ads
Paid media is one of the most lucrative sources of customers for ecommerce. According to data sourced from Statista, 16% of ecommerce companies spent between $20-$150,000/month and 14% spent over $150,000/month in ad spend in 2020.
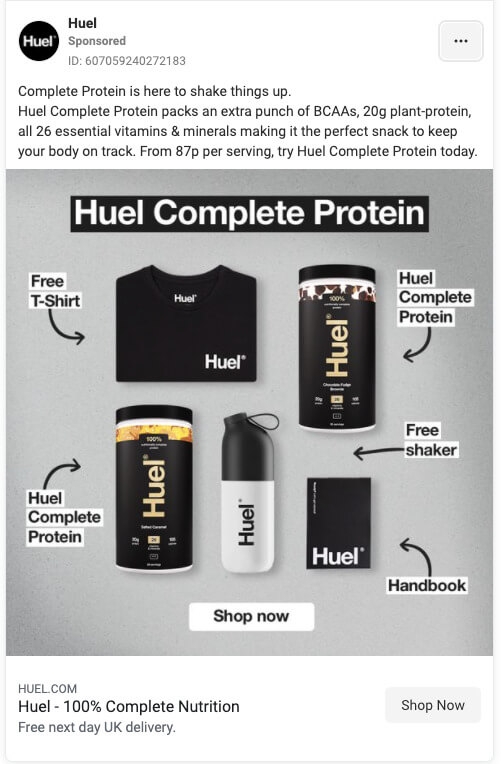
For example, Huel run ads to product bundles in order to increase their AOV:
On their landing page, users are immediately offered a subscription over a one-time purchase in order to save 10%:
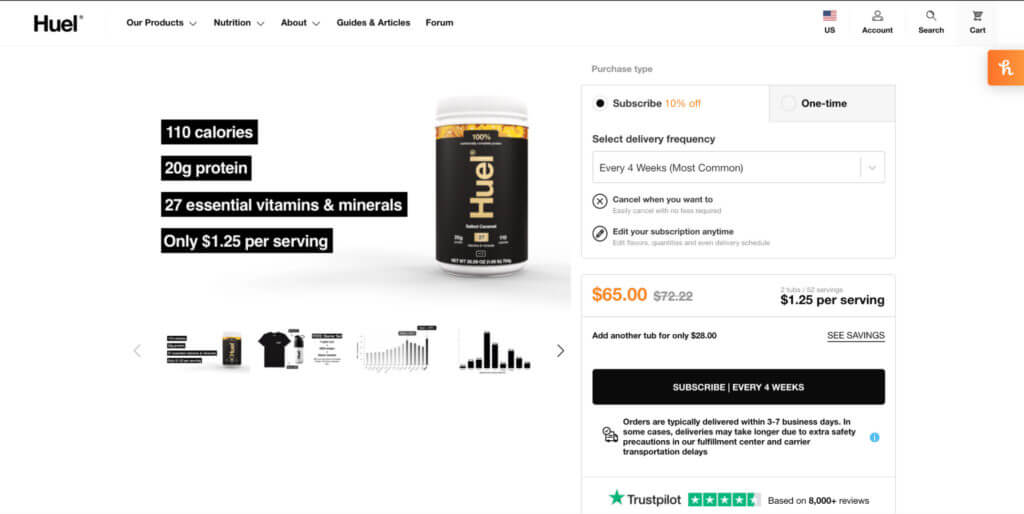
This encourages more visitors to become long-time customers and increases LTV as a result.
Here’s how we’d calculate the conversion rate for this journey:
(Subscriptions / Clicks) * 100
For example, if Huel generates 100,000 clicks and 1,200 subscriptions over a one-month time period, their conversion rate would be:
(1,200 / 100,000) * 100 = 1.2%
They could use this same formula to compare conversion rates on one-time purchases. This would help add context around what their customers want, and how they could encourage future purchases.
For Huel, a low conversion rate on subscriptions may be acceptable. If the conversion rate for one-time purchases are higher than subscriptions, but the LTV is lower, then they would know to continue prioritizing the latter.
Email subscribers from search traffic
Not all conversions are directly tied to revenue. If audience building is a priority, email subscribers should be an important metric.
For example, on the Backlinko website, Brian Dean makes newsletter subscriptions the prominent CTA on each web page:

Brian is bullish on organic traffic. Every article he produces is built for search. Therefore, a critical KPI might be: “number of email subscribers generated from organic traffic”. To calculate this conversion rate, we’d use the following formula:
(Email subscribers / Organic traffic) * 100
For example, if Brian generated 500,000 organic visitors last month, of which 3,100 subscribed, then:
(3,100 / 500,000) * 100 = 0.62%
This formula can be repurposed for other channels, as well as user segments such as returning visitors.
Leads generated from content
If you’re using content to generate leads for your B2B or SaaS business, it’s critical you measure how well your activities are contributing to the cause.
For example, Vidyard have a library of resources on various video marketing topics:
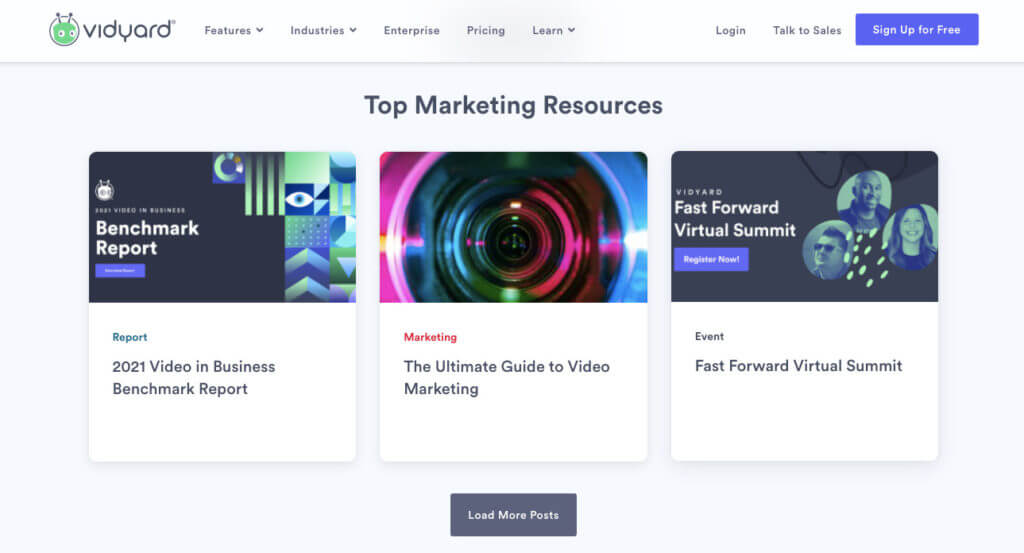
If you’re producing content at this scale, you better be sure it’s converting. A formula we can use to calculate this would be:
(Leads / Landing page visits) * 100
Let’s say Vidyard’s “Ultimate Guide to Video Marketing” generated 1,400 views a month, of which 46 converted into leads:
(46 / 1400) * 100 = 0.30%
This formula also applies to readers of your blog content and podcast listeners.
How conversion rates affect bottom line
How do marketers use conversion rates to build a more profitable business?
Understand there’s no such thing as a universally “good” conversion rate. A good conversion rate is better than what you had last month. You are your own benchmark.
Understanding the value of a conversion
The value of conversions depends on several factors. Borrowing from our earlier Huel example, let’s create some hypothetical conversion rates for their protein bundle product:
- Subscriptions convert at 0.59%
- One-time purchases convert at 1.04%
Looking at surface-level conversion data, we could assume one-time purchases are the clear winner. However, this doesn’t take into account customer behavior and LTV.
Let’s say paying customers keep their subscription open for an average of six months over a 12-month cohort. That’s an LTV of $390 on the front-end alone ($65 subscription * 6 months).
Over that same 12 month period, the average customer who purchases the protein bundle as a one-off purchase (for $72) also buys three different products with a combined value of $150.
That’s an LTV of $222 over 12 months; $168 less than subscriptions. This doesn’t factor the costs of email marketing and retargeting into overall profitability.
The point of this thought experiment is to understand the true impact of conversions and customer behavior. If a customer spends more as a result of taking a different action, then you should prioritize that action—even if conversion rates are lower.
Gleaning insights from your conversion rate data
Conversion rates aren’t simply a metric for you to beat (although there’s no doubting it’s enjoyable). They exist to help you make better strategic decisions over your marketing.
Data helps you generate insight, and that insight is most useful when it helps you answer questions. These questions include:
- Overall conversion rate: How good is our conversion rate across all marketing channels?
- Acquisition conversion rate: Which channels produce the best conversion rate, and why?
- Page-level conversion rate: Which of our landing pages and content are better at converting traffic, and why?
- Campaign conversion rate: Do targeted ads convert more, if so, which ad groups convert better?
- Keyword conversion rate: Which keywords drive conversions? Do they deserve more ad budget?
Granular insights around metrics such as keyword conversions, for instance, is where strategic decisions can be made. For example, you may uncover a group of keywords with high commercial intent converting traffic at a higher rate than your overall conversion rate.
To capitalize on this insight, you can increase the budget spent on those ad groups. But what about investing more in SEO and organic growth?
For example, Huel rank organically for terms such as “meal replacement powder” and “powdered food:”
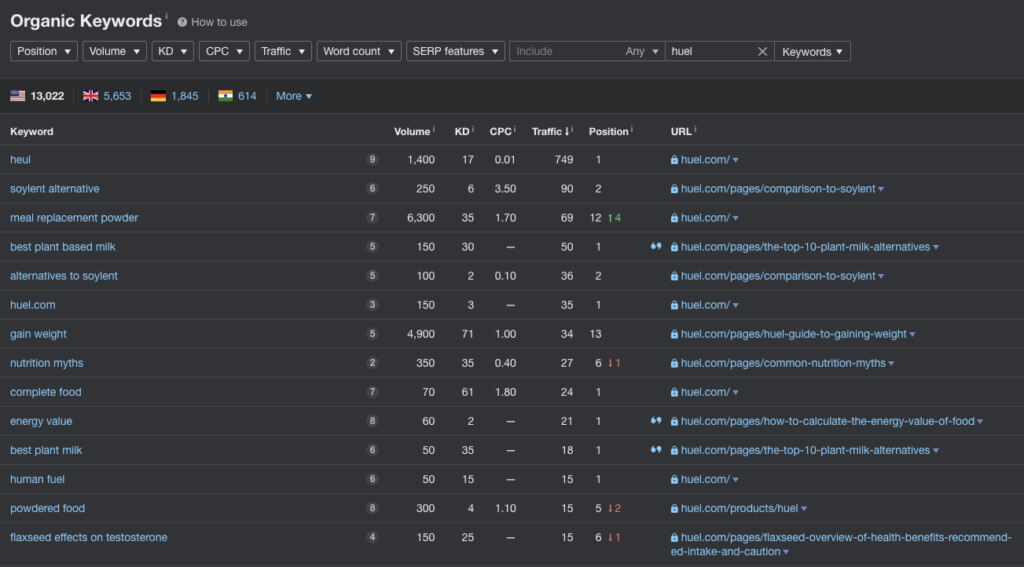
According to Ahrefs, Huel would have to invest $184,000 a month to capture the paid equivalent of their monthly organic traffic:
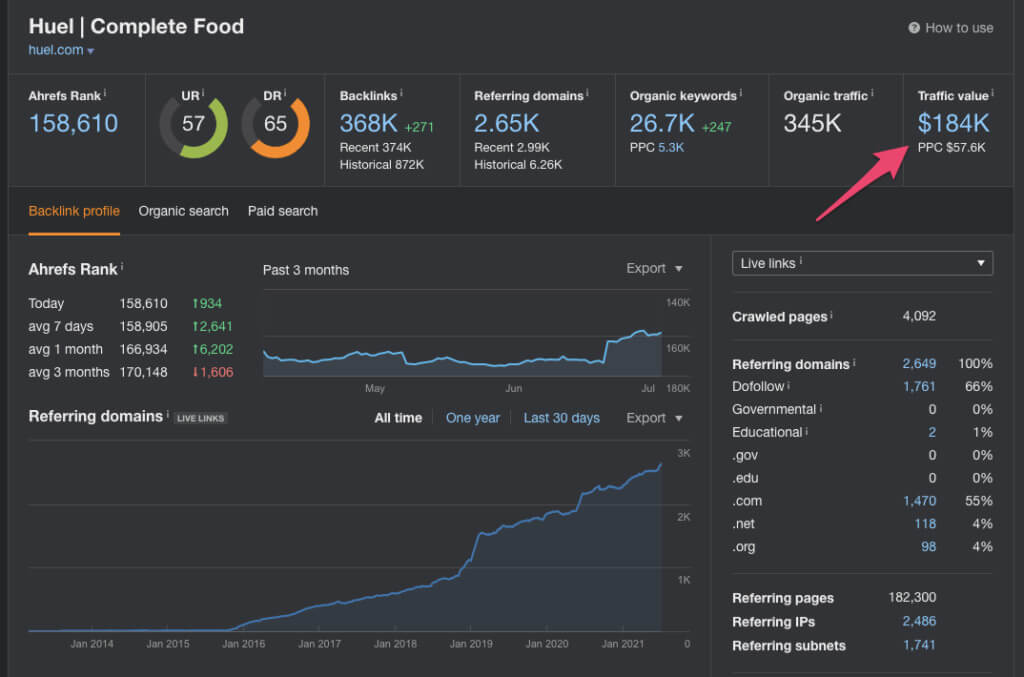
Investing in new marketing channels can feel like a gamble. When you have insights from your conversion data at hand, you can confidently make these decisions knowing there’s a high chance of a positive return on investment in the months and years to come.
How to leverage your conversion rate formula to drive optimization efforts
Conversion rate insights also help you prioritize new growth and conversion rate optimization opportunities. Here’s how to do it.
Collecting high-quality data
Make sure the data you’re collecting is accurate and whole. To improve data quality, start by optimizing how you collect your data and defining what data matters most to you.
For example, running Facebook Ads gives you a tremendous number of metrics across how your audience is interacting with creative. But which of these metrics makes a real impact?
Some immediate Facebook Ad KPIs that come to mind include:
- How many clicks are we generating?
- What’s the click-through rate?
- What’s our CPC?
- What’s our CPA?
- What’s our Facebook Ad conversion rate?
Knowing these answers will allow you to collect, organize, and segment data in an accurate manner.
It’s also important to normalize your marketing data, especially when different platforms report different numbers for the same metric.
For example, there’s often a discrepancy between the number of clicks generated from Facebook Ads and number of page visits from that source from Google Analytics. Unfortunately, it’s difficult to get to the bottom of who is right.
Instead, decide on which is your “source of truth” and adhere to it accordingly. Use that source as your “true north” in order to make decisions based on consistent data.
Prioritizing your experiments
Using the ResearchXL model, we can come up with tests we’re more confident will win:
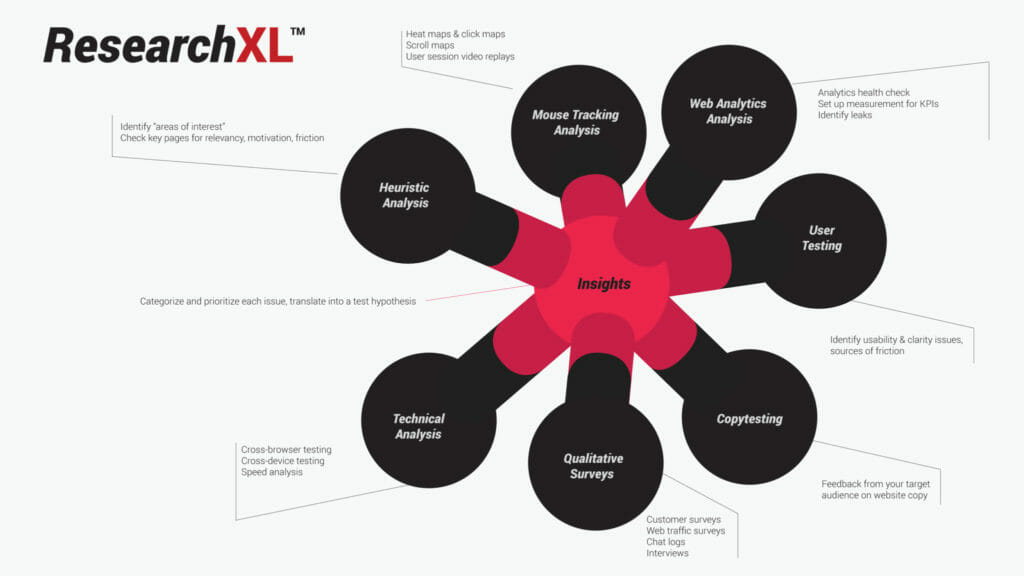
The model works on the understanding that most experiments succeed through a three-step process:
- Run as many tests as possible
- Win as many of those tests as possible
- Ensure successful tests have as big an impact as possible
While the first step is obvious, steps two and three rely on discovering what goals and outcomes matter to you the most to inform those experiments.
For example, you might run a 30-day experiment A/B testing new headlines on your landing pages. This can lead to incremental improvements, but it ignores what really matters.
Instead of making arbitrary conversion optimization choices, first figure out what inputs, actions, and outputs lead to the biggest financial impact on your business. Without research, testing is useless.
Start with a structured review of your website. Assess each asset against the following criteria:
- Relevancy: Do your pages meet the user where they are? Do they deliver on expectations?
- Clarity: Is the offer or action you want users to take clear?
- Value: Are you clearly communicating the value your product or service delivers?
- Friction: Is anything on the page creating doubt or hesitation? Can you simplify the process?
- Distraction: What draws attention away from the primary action you want users to take?
This is called heuristic analysis, where a page or asset is scored based on previous experience alone. It requires opinion to make those conclusions, which means a more data-driven analysis is needed to confirm or challenge those biases.
Collecting quantitative and qualitative data can be done in six ways:
- Technical analysis: Identify and fix any bugs that ruin the experience (and hinder SEO performance). This includes checking your site speed and comparing conversion rates against different browsers in Google Analytics.
- Analytics analysis: Learn what people are doing on your website and what impact each feature is making on conversions.
- Mouse tracking analysis: Using click maps, scroll maps, and user session replays, you can get a more granular view of how visitors are interacting with your website.
- Qualitative surveys: Ask users what’s preventing them from taking action right on your page. Tools like Hotjar make this a breeze.
- User testing: Watch people actually navigate around your website. You get to see how they interact and their physical reactions to certain elements and user journeys.
- Copy testing. Get feedback on your copy from the people you’re marketing to – what’s unclear, what’s compelling and what’s a “meh”.
Copy is the communication vehicle that compels, convinces, and educates users on your offer. It’s critical you get it right.
Copy testing will help you answer questions like:
- What does your headline make them feel?
- Do they care about the arguments you’re making?
- Which benefits are they most interested in?
- Do they even understand the copy in the third paragraph?
- After reading everything, what remains unclear?
To do this, you can recruit users manually, or use a service like Wynter to set up audience panels for you and get you full data in under 48 hrs.
Use this data to identify any obvious tests that should be prioritized. Are there any quick “wins” you can capitalize on? Do technical issues exist that immediately need fixing in order to enhance a lackluster customer experience?
Make sure these are at the top of your list when deciding what to optimize first.
Conclusion
The magic of a conversion rate formula is to glean insights into your marketing efforts. It’s a window into what’s working and what isn’t so you can test, optimize, and improve.
But conversion rates are not the be-all and end all—they have limitations. They don’t help you measure the entire customer experience. They don’t provide a road map to creating the most value. Conversions are only one piece of the puzzle. If you want to create a sustainable customer experience, you need to optimize beyond the conversion rate.
Don’t get hung up on “good” conversion rates, either, as those will vary based on your unique goals and outcomes. That could also lead to wasted time and money chasing conversion rate optimization that doesn’t produce a meaningful ROI.
Instead, make sure your actions are nurturing customers toward a conversion and double down on what’s working. Measure success against yourself, not the competition. And build an experimentation culture to help you make smarter decisions.


Fun fact: you can also calculate the same number in another way.
( 100 / Action) * Conversions
Epic stuff Tom! Really loved your latest article on CXL and this one too :)